INTERNAL LABOR MARKETS: A CASE STUDY
Francisco Lima
Abstract
We select one firm from a large data set of firms and study its internal economics. First we prove that the information available allows us to inspect the personnel policies of the firm. Furthermore, this fact allows moving from the case study to more comprehensive studies in personnel economics using institutional surveys. The analysis also shows the patterns of workers' promotions and the differences in the characteristics of insider versus outsider workers. The decision to promote is analyzed. The hierarchic design directly influences the wage policy. Wages are determined to a great extent by the layers of the hierarchy. There are wage premiums upon promotion, even if the worker does not change his place in the organization. When the promoted worker moves up in the hierarchy he comes from the top of the wage distribution at the old job and goes to the bottom of it in the new job. We present evidence on workers' exit and entry to the bottom of the wage distribution, especially in the lower part of the hierarchy.
Theme: Internal labor markets
Keywords: Internal labor market, personnel economics, hierarchy JEL-Code: J31, J33, J41
1. Introduction
In this paper we study the internal economics of a firm. We analyze the hierarchy structure, the promotion policy, workers' entry and exit from the firm, and the relationship between the layers in the hierarchy, promotions and pay.
Faculdade de Economia da Universidade Nova de Lisboa. Travessa Estêvão Pinto, Campolide, P 1099-032 Lisboa, Portugal. [email protected]
I am grateful to Pedro Telhado Pereira for helpful comments and suggestions. Financial support from PRAXIS XXI, grant 2/2.1/CSH/781/95 and PRAXIS XXI - Subprograma Ciência e Tecnologia do 2°
Quadro Comunitário de Apoio is acknowledged. I also thank the Bank of Portugal where this research
The firm was drawn essentially at random from a large sample of firms. The sample comes from a firm-based survey (Quadros de Pessoal) conducted by the Portuguese authorities every year. We have five years of data. The survey contains personnel data and covers a great proportion of the Portuguese firms. As far as we know, it is the first time an attempt has been made to pursue this type of study using the survey Quadros de Pessoal. The study is a first step in a larger analysis research project. We intend to apply the same type of procedures to the sample of firms across the board. We start with a case study because we need to establish if the information contained in the data set is valid for an internal analysis of firms. Furthermore, the study of a particular firm, albeit an individual case study, has a value in and of itself. There are several results in the personnel economics literature that we intend to set against the evidence presented in the study of the internal organization of "our" firm. The paper is in part descriptive in the sense that we first identify the structure of the hierarchy, promotion policies, and pay policies of the firm.
There are relatively few works on the applied internal labor market. One reason for this is due to the scarcity of good personnel records. Among those works are the papers of Baker, Gibbs, and Holmstrom (1993, 1994a, b). The authors analyze twenty years of personnel data from one firm, focusing on the hierarchy, promotion policies, port of entry and exit, pay policies and their relationship with the hierarchical levels. The present study is in the spirit of these papers. Medoff and Abraham (1980) study personnel records from two large firms. It challenges the prediction that worker's experience positively influences its wage. The analysis shows that experience is not positively related with the worker's performance. McCue (1996) presents evidence on the positive and important effect that workers' movements inside the firm have on wage growth. More recently Ariga, Ohkusa and Brunello (1999) study the promotion policy of a firm, while Lazear (1999) explores some new directions with the analysis of personnel records of two different firms.
The novelty of our work lies in the fact that the firm under study comes from an institutional survey conducted on virtually every firm operating in Portugal. This will allow us to pursue a more systematic analysis and to reach broader results. With the present case study we must determine if the data are reliable as a representation of the internal organization of the firm. At the same time we advance some new results and try to point out possible new directions for the applied research.
The literature on internal labor markets is by now relatively extensive. We pretend to test some of the main existing results with our applied analysis. The personnel policies and the internal organization of the firm have been modeled, for example, by Calvo and Wellisz (1979) and Waldman (1984b). The allocation of the most able
workers to higher hierarchical layers and the skewness the wage distribution relative to the distribution of the workers' ability is proved in those papers.
Bernhardt (1995) and Waldman (1984a) study the information signals sent by the employer when he promotes a worker and pays a corresponding wage. Among the same lines there is the work of Ricart I Costa (1988). The framework relies on the assumption that there is an information asymmetry in the labor market where only the current employer observes a worker's ability, while other firms observe the worker's wage and occupation. The market therefore uses the worker's employment and promotion history to reduce this information asymmetry. Given the signaling propriety of the wage and promotion decisions, wages are attached to jobs and not to workers' productivity. The employer also tries to extract some rents from the employees, leading to an inefficient job assignment of workers and longer tenure in a given job. The degree of the inefficiency is related with the human capital composition. The higher is the proportion of general human capital, the higher is the degree of the inefficiency. In addition, as Bernhardt (1995) states, the driven forces of wage growth are the job assignment and tenure at the job and not the total tenure at the firm. In fact, tenure can have a negative impact in wage growth, when controlling for the promotion and job assignment histories of the worker. If a worker is not promoted and if the proportion of specific human capital, with no value in the external labor market, increases with tenure, then the worker can have a negative wage growth. The information asymmetry between the actual employer and the market concerning the worker's ability can be related with the worker's visibility. A worker is more visible if he can reveal in a more accurate way his ability to the market. Then, the more visible is the worker, the smaller is the degree of the information asymmetry. Milgrom and Oster (1987) prove that firms discriminate against invisible workers given that promotion decreases the information asymmetry. The invisible workers receive lower wages than visibles and have a lower probability of promotion. Then, according to Bernhardt (1995) and Milgrom and Oster (1987) workers with more years of schooling and only considering its signaling propriety about ability, have better career prospects. Additionally, if a worker is promoted first, then he has a higher probability of being again promoted first, given the information content of the decision to promote − the "fast track" effect.
The promotion policy can also be thought as a tournament where workers compete with each other to get a promotion. Lazear and Rosen (1981) prove that the workers can be paid according to an ordinal rank and that this pay scheme is in some cases superior to pay schemes based on the worker's productivity. Chan (1996) opens the contest to outsiders. In that way the employees increase their effort given that the probability of promotion is reduced. Additionally, when the firm wants to reduce the
wage premium received upon promotion, then it can set different decision criteria regarding the quality of the insiders and outsiders applicants in order to favor the insider over the outsider in the contest. The result is that the external hires have to possess a superior quality than the current employees to be recruited by the firm.
Manove (1997) argues that one way to induce workers' effort is to construct a job ladder. The combination of the promotion motive with incentive wages increases the gains of the employer. The result is valid, even if the jobs in the different hierarchical layers do not correspond to different tasks. In addition to the use of a hierarchy with several layers, the employer pursues an internal promotion instead of external hiring.
The analysis demonstrates that we can consider the information in the data as valuable to study the internal economics of the firm. Furthermore this fact allows moving from the case study to more comprehensive studies in personnel economics using institutional surveys. We study the patterns of workers' promotions and the differences in the characteristics of insider versus outsider workers. Namely that more educated workers are assigned to the higher level of the hierarchy and that the external hires although generally younger hold more years of schooling. The decision to promote is modeled and estimated. The results show that more educated workers have a higher probability of promotion and that the more time a worker remains in a given level, the lower his probability of promotion. The hierarchic design directly influences the wage policy. Wages are determined to a great extent by the layers of the hierarchy. There are wage premiums upon promotion, even if the worker does not change his place in the organization. In addition to estimate this positive effect of promotion on wage growth, we decompose it in promotions within and between levels. The effect of tenure on wage growth is small and negative, when controlling for promotions. When the promoted worker moves up in the hierarchy he comes from the top of the wage distribution at the old job and goes to the bottom of it in the new job. We present evidence on workers' exit and entry to the bottom of the wage distribution, especially in the lower part of the hierarchy.
We analyze the firm in the next section of the paper. First there is the overview of the firm. The hierarchy, promotion policy and workers' entry and exit are analyzed in the second part, the wage policy in the third. The paper ends with the conclusion and appendix.
2. Analysis
The firm comes from a firm-based survey. We have chosen this firm for no particular reason other than to have data for the five years of data available to us. It was an aleatory draw as some information on the identification of the firm is concealed. The objective is to explore and discuss results on the internal labor market of this firm.
The information contained in the data set reveals to us the employment history of the worker. Namely, the date of entry, his place in the hierarchy, his promotions and if and when he leaves the firm. A description of the data set is found in the Appendix.
Pay variables are distinguished between base wage and total wage. The difference between the two is the additional pay related to tenure, career and performance, as defined by the survey: tenure-based compensation, bonus payments and other regular compensations.
2.2 The Hierarchy of the Firm
The first objective is to determine if the levels can be considered layers in a hierarchic structure, that is, if the levels reported define the hierarchy inside the organization and if the promotion policy respects that hierarchy. The regulation concerning this data set obliges the firm to assign a level to each worker. The firm has to "fit in" its own hierarchy to the hierarchy implied by the levels defined by law, and each level corresponds to a certain responsibility level and task complexity. Furthermore, the information regarding the employees includes the date of last promotion, allowing us to observe the changes in the employee's data at that date. This is unlike Baker, Gibbs, and Holmstrom (1994a) who built the hierarchy using information on transitions between job titles aggregated to form levels, and identified promotions as moving in up the hierarchy.
Hierarchical Levels
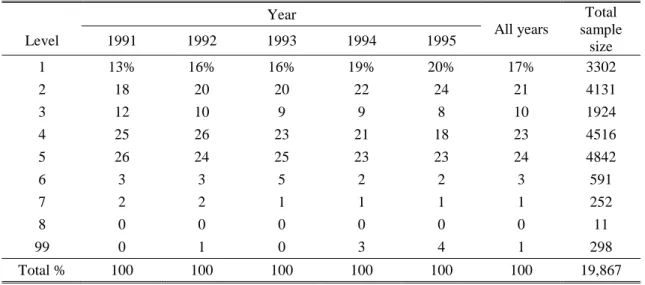
There are eight levels, from Level 1, the highest rank (top executives), to Level 8, the lowest rank (apprentices). (See the Appendix for a detailed description of the levels.) A ninth level is considered (Level 99) that corresponds to "ignored and residual". The sample has 19867 employee-years. The workers’ distribution by level for each year and for the total of the five years is in Table 1. Although the size of each level remains fairly stable over the five-year sample, Levels 1 and 2 increase their relative weight at the expense of Levels 3, 4, and 5. The hierarchy does not present a pyramidal structure: Level 8 can be considered unused by the firm; Levels 6, 7, 8, and 99
represent 5% of the total number of workers; Levels 4 and 5 represent 51% of the total in 1991, and 47% in 1995; Level 3 has less than 10% in 1995; Levels 1 and 2 represent 44% of the total. The number of levels and their nature is the same in all years due to the fixed regulation used. We cannot capture changes in the hierarchical structure in this sense.
There is no information on job titles. We have data on an individual's occupation, but there again it is a variable categorized according to a national classification system. We tried an analysis similar to the one presented herein using this individual's occupation but as we expected it was not very fruitful.
Table 1. Level size by year and across years Year
Level 1991 1992 1993 1994 1995 All years
Total sample size 1 13% 16% 16% 19% 20% 17% 3302 2 18 20 20 22 24 21 4131 3 12 10 9 9 8 10 1924 4 25 26 23 21 18 23 4516 5 26 24 25 23 23 24 4842 6 3 3 5 2 2 3 591 7 2 2 1 1 1 1 252 8 0 0 0 0 0 0 11 99 0 1 0 3 4 1 298 Total % 100 100 100 100 100 100 19,867
Worker's Movements and Promotions
The workers’ movements from one year to the next by level summed over all years, along with exits and entries are presented in Table 2. In the cells of the diagonal are the workers who did not change level from one year to the next. Above the diagonal are the workers who moved down at least one level. Below the diagonal are the workers who moved at least one level up. For example, 85% of the workers in Level 2 stayed in that level in the next year, 8% moved to Level 1, and 7% exited the firm over the five years of the sample. As we go from Level 5 to Level 1, we observe that the percentage of stayers increases. Above the diagonal the transitions are rare, except that 9% of the workers moved from Level 4 to Level 5. Below the diagonal we have movements of up by one level and, with lower figures, up by two levels. The figures in Table 2 support the fact that the data supplied by the firm mirrors a hierarchy. It is
not the “true” hierarchy, but rather, a filtered representation, shaped by the norms of the survey. This proposition is supported by the fact that movements to lower levels are rare, and movements to upper levels are mainly to the next level. Can these movements of workers from one level to the next upper level be considered as promotions, and the movements to the next lower level as demotions? As we have data on promotions this issue is discussed in Table 3 (roughly 90% of the transitions between levels can be explained by the data on promotions). This means that the employees that move down in the hierarchy and are not promoted are the best candidates to be considered as demoted.
Workers leave the firm irrespective of their position in the hierarchy: exit is present in all levels (except for Level 8). Entry is about zero in Levels 3, 4, 7, and 8.
The transitions of workers through time can be visualized in Figure A1 in the Appendix, where we plot the transitions from each year to the next. The four graphs in the figure are alike. The pattern of the transitions is stable over the five years.
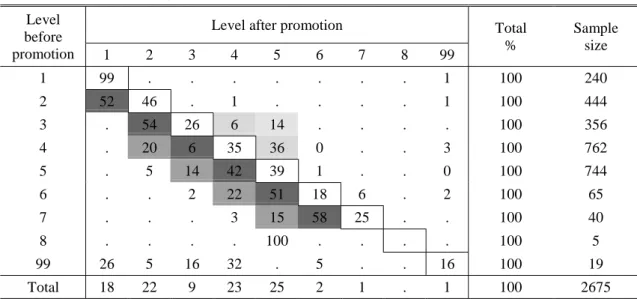
Table 3 shows the movements of the workers when they are promoted. The level before promotion in one year is set against the new level after promotion in the next year and summed across years. There are promotions within levels and between levels. The cells in the diagonal of the table represent promotions within levels. The cells off the diagonal represent promotions between levels. The fact that the promoted worker remains in the same level means that the nature of his job did not change. The use of promotion within levels by the firm can be thought as a way to incentive the worker (Manove 1997). Promotions between levels are mainly to the next upper level. Slightly more than half of the workers in Levels 2, 3, 6, and 7 moved up one level upon promotion. We do not know if the individual had more than one promotion from one year to the next, given that only the date of the last promotion in each year is known. This may explain why there are workers promoted up by two levels or more. Another explanation can be the existence of different career paths blurred by the rigidity imposed by the survey norms.
Table 2. Transition matrix, 1991-1995 New Level Old Level Exit 1 2 3 4 5 6 7 8 99 Total Sample size Entry 12 33 1 1 15 20 . 0 18 100 557 1 8 91 . . . 1 100 2352 2 7 8 85 . 0 . . . . 0 100 3127 3 9 . 12 73 1 4 . . . . 100 1625 4 7 . 4 1 77 9 0 . . 2 100 3829 5 10 . 1 3 8 78 0 . . 0 100 3946 6 31 0 . 0 3 7 58 1 . 0 100 507 7 16 . . 1 0 3 11 69 . . 100 217 8 . . . 100 . . . . 100 5 99 20 10 3 3 11 . 1 . . 52 100 99 Total 9 15 20 8 21 22 3 1 0 . 100 16,264
Table 3. Promotion matrix, 1991-1995
Level after promotion Level before promotion 1 2 3 4 5 6 7 8 99 Total % Sample size 1 99 . . . 1 100 240 2 52 46 . 1 . . . . 1 100 444 3 . 54 26 6 14 . . . . 100 356 4 . 20 6 35 36 0 . . 3 100 762 5 . 5 14 42 39 1 . . 0 100 744 6 . . 2 22 51 18 6 . 2 100 65 7 . . . 3 15 58 25 . . 100 40 8 . . . . 100 . . . . 100 5 99 26 5 16 32 . 5 . . 16 100 19 Total 18 22 9 23 25 2 1 . 1 100 2675
Transitions of all employees promoted as a percentage of the total at each level before promotion across years.
The major exceptions are Levels 4 and 5 (there are transitions from 5 to 4, as well from 4 to 5) where 27% of the workers in Level 4 were promoted to Level 5. The other exceptions are the transitions from Level 3 to Levels 4 and 5 (6% and 14% respectively). Nevertheless, 54% of the workers moved from Level 3 to Level 2.
Summing up, Levels 4 and 5 are those in which a clear statement on the hierarchical ladder is problematic. As mentioned, it may be the case that different ladders overlap. For example, technical and administrative workers can have different paths along the hierarchy.
Tables 1 through 3 show that the hierarchical levels reported by the firm can be considered as a representation of its internal organization. This is especially true of Table 3 because with the pattern of workers' promotions, we can confirm if the ladder represented by the levels is, in fact, the ladder that the worker climbs.
Promotion Policy, Entry, and Exit
We intend to analyze the assignment of workers to hierarchical levels. Namely, who is promoted and what differences exist between the insiders and outsiders. If we consider that the firm functions as an internal labor market, then there are differences between the workers who are moving inside the firm and those who enter the firm for the first time.
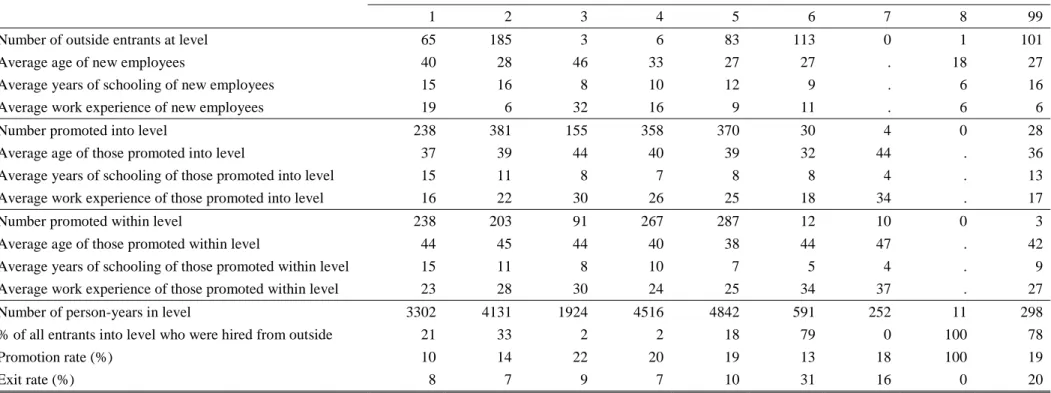
Table 4 compares the entrants' characteristics with the insiders' characteristics by Level. Are there specific points in the hierarchical ladder where workers enter or exit? Entry occurs mainly in Levels 1, 2, 5, 6 and 99. Level 99 is a "natural candidate" to be a port of entry. When the worker enter the firm, there can be a lag of time before he is assigned to a specific hierarchical level. The problem is solved by assigning the worker to this level, given that the firm must to assign a level to the worker when answering the survey. Are the figures evidence of the existence of "ports of entry"? Clearly, what we can state is that there are "ports of no entry": the Levels 3,4, 7 and 8. Nevertheless, for 1993 Level 6 can be considered a port of entry. In that year almost 50% of entrants to the firm, came in at this level. In all of the five years of the sample that was the only time Level 6 was used as a level for new employees.
There is no evidence of "ports of exit": it occurs in all levels. The exit rate is higher in Level 6. Nevertheless, the data can be misleading: given the size of each level, Level 5 has the highest workers' exit, in absolute value, followed by Level 6 and Level 2.
The average years of schooling of the workers who enter Level 1 and 2, from outside or inside the firm, is higher than in any other level (except Level 99). The difference between the average years of schooling between Level 1 and 2 (one year) can be explained by the average age. The younger outside entrants into Level 2 have experienced a reform of the educational system that added one year to upper secondary education. If we consider schooling attainment as a measure of ability, then the fact that in the upper hierarchical levels are the more educated worker is in line with the results that the more able workers should be assigned to more complex and responsible jobs (for example in Calvo and Wellisz 1979, Waldman 1984a, b, and Bernhardt 1995).
The average age of new employees for a given level is lower than the average age of those promoted into the level, except for Level 1. The reverse is true for the average years of schooling. The entrants compensate for their lack of experience inside the firm with general human capital. Or, if the new employees have more years of schooling, and the specific human capital accumulated during the working life inside the firm is not important to do the job, then they should have different career paths. A slightly different case is possible if the firm experiences a change in the nature of the jobs resulting from a change in the environment in which the firm operates. Then it can be the case that more years of schooling are needed than before. A firm can set up a compensation scheme with tournament for jobs where the outside contestants have to possess higher ability than insiders as presented in Chan (1996). Outside entrants to Level 1 are older, on average, than those entering Levels 2, 5 and
6. In the highest rank of the hierarchy, not only the worker needs more years of schooling, but also more years of experience.
The average age of the promoted workers within levels is higher than the average age of the promoted workers between levels, comparing by levels, except for Level 5. If we think of what to expect in the career path of a typical worker through his working life in the firm, when he is promoted to a level (promotion between levels) he has to wait some time in that level (and perhaps be promoted within the level) before he experiences a second promotion between levels.
The promotion rate is lower in Levels 1 and 2 (and Level 6). In the other levels it hovers around 20%. Nevertheless, if we go back to Table 3, the promotion matrix, we observe that in Level 1 the promotion is only within level (obvious); the proportion of promotion within levels decreases as we move down in the hierarchy; and the promotion between levels increases in proportion.
There remains the issue of career duration. The data on workers entry are not sufficiently informative to explore it, and we do not have enough periods to advance much more. Nevertheless, 60% of the 1991 employees were still in the same level in 1995. This fact suggests that careers in this firm tend to be long. When discussing the importance of careers, Baker, Gibbs, and Holmstrom (1994a) found evidence that supports this fact. If the firm explores the information advantage over the other firms in the market about the employees' abilities, then the promotion is delayed at least to some workers (Waldman 1984a, Ricart I Costa 1988, and Bernhardt 1995). The result is an inefficient promotion of workers and longer tenure in a given level.
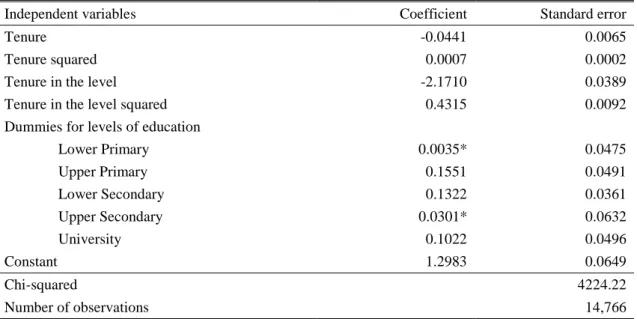
The decision to promote an employee can be further analyzed using a probit model. If the worker fulfills a set of conditions, then the employer decides to promote him. Medoff and Abraham (1980) and Ariga, Ohkusa and Brunello (1999) follow this approach by estimating a probit equation for the decision to promote. Table 5 presents our preliminary results. Education has a positive effect on promotion. Better educated workers can be considered not only more able by the firm but also are more visible to the external labor market. Milgrom and Oster (1987) argue that the more visible employees will have a higher probability of promotion. Nevertheless, the results in Table 5 must be read with care given that we are using only the information for the five-year sample and that education is probably correlated with hierarchical level. The negative coefficient associated with tenure in the level means that the more time the worker stays in a given level, the lower is his promotion probability. Is this a sign of fast track effects? We need more results to answer that question.
Table 4. Level characteristics
Level
1 2 3 4 5 6 7 8 99
Number of outside entrants at level 65 185 3 6 83 113 0 1 101
Average age of new employees 40 28 46 33 27 27 . 18 27
Average years of schooling of new employees 15 16 8 10 12 9 . 6 16
Average work experience of new employees 19 6 32 16 9 11 . 6 6
Number promoted into level 238 381 155 358 370 30 4 0 28
Average age of those promoted into level 37 39 44 40 39 32 44 . 36
Average years of schooling of those promoted into level 15 11 8 7 8 8 4 . 13
Average work experience of those promoted into level 16 22 30 26 25 18 34 . 17
Number promoted within level 238 203 91 267 287 12 10 0 3
Average age of those promoted within level 44 45 44 40 38 44 47 . 42
Average years of schooling of those promoted within level 15 11 8 10 7 5 4 . 9
Average work experience of those promoted within level 23 28 30 24 25 34 37 . 27
Number of person-years in level 3302 4131 1924 4516 4842 591 252 11 298
% of all entrants into level who were hired from outside 21 33 2 2 18 79 0 100 78
Promotion rate (%) 10 14 22 20 19 13 18 100 19
Exit rate (%) 8 7 9 7 10 31 16 0 20
Figures for all workers in the firm summed through 1991 to 1995. Exit rate uses workers who left the firm between 1992 and 1995. Promoted into the level are the workers who were promoted and changed to the respective level in the table. Promoted within the level are the workers who were promoted and remained in the same level. Promotion rate is the total number of promoted workers divided by the total number of workers in the level before promotion.
A richer specification can be modeled for the decision to promote. The firm can decide to promote a worker between levels or within levels, to not promote the worker, or even to fire the worker (or the worker quits, which is a different event, a decision taken by the employee, not the firm).
Table 5. Promotion − probit estimates
Independent variables Coefficient Standard error
Tenure -0.0441 0.0065
Tenure squared 0.0007 0.0002
Tenure in the level -2.1710 0.0389
Tenure in the level squared 0.4315 0.0092
Dummies for levels of education
Lower Primary 0.0035* 0.0475 Upper Primary 0.1551 0.0491 Lower Secondary 0.1322 0.0361 Upper Secondary 0.0301* 0.0632 University 0.1022 0.0496 Constant 1.2983 0.0649 Chi-squared 4224.22 Number of observations 14,766
Dependent variable: dummy equal to one every time the worker is promoted between 1991 and 1995. Random-effects probit model using a generalized estimating equation approach. An asterisk marks the coefficients which are not significant at any reasonable level. Tenure in the level defined for the current level if the worker is promoted within levels or is not promoted and defined for the level prior to the promotion if the worker is promoted between levels.
2.3 The Wage Policy
There are several theories that model the relationship between pay, promotions and hierarchy. Namely, tournaments, incentive schemes, or information revelation can explain the promotions associated with higher pay and the hierarchic design of a firm. We expect to find, for example, a positive relationship between pay and hierarchical level, as we move up in the hierarchy; that this hierarchical level explains the wage level; promotions explain a great part of the wage increase during the working life of the employee. We also want to look for the place of the worker in the wage distribution when he enters the firm, leaves it, or is promoted.
Wages and Hierarchical Levels
Over five-year window the relative position of the mean base wages did not change, except for Levels 6 and 7 in the year 1993, as we can see in Figure 1. The relative position of the mean base wage is parallel to the relative position of the levels. Thus, as we move up the hierarchy the mean base wage increases. Comparing Figure 1 with Figure 2, the mean total wage is higher than the mean base wage for all levels. The figure has the same proprieties as Figure 1, but from 1993 onwards the mean total wage of Level 5 is higher than the mean total wage of Level 4. Once again, and as a sequence of what we have already stated for these levels, the wage data confirms that considering them as two consecutive layers of the hierarchy is problematic for the firm under study.
A question that Baker, Gibbs, and Holmstrom (1994a) tried to answer was whether or not wages were attached to jobs. Bernhardt (1995) and Waldman (1984) prove that wages are attached to jobs and not to workers' productivity. Given the signaling propriety of the wage and promotion decisions, the willingness to pay depends on this job assignment and not on the worker's ability. Looking at the evidence presented in Figure 1, this seems to be the case. When the total wage is considered, it is not so clear.
In Figure 3 we present the mean total wages and the 5th and 95th percentile in 1991 by level. Mean wages increase with level, as seen in Figure 2. Note also that a worker can receive a lower wage than his colleague in a lower level. Even when the base wage is considered, there is this overlap between wages from workers assigned to different hierarchical levels (Figure A2 in the Appendix). Although the hierarchical level appears to explain the wage level to some extent, the individual characteristics also play a role.
Figure 3 also shows that the dispersion apparently increases with level, as well. Table 6 presents a dispersion measure, standard deviation divided by the mean wage, for base and total wage. Generally, the dispersion increases with the levels, looking by raw. Looking by column, the dispersion of the total wage is higher than the dispersion with base wages, except for Level 1. This means, once again, that the hierarchical levels cannot explain all the wage differentials, and that the individual attributes grow in importance as we move to more responsible jobs.
100,000 150,000 200,000 250,000 300,000 350,000 400,000 450,000 500,000 91 92 93 94 95 1 2 3 4 5 6 7
Figure 1. Mean base wage by level from 1991 to 1995
100,000 150,000 200,000 250,000 300,000 350,000 400,000 450,000 500,000 550,000 91 92 93 94 95 1 2 3 4 5 6 7
Figure 2. Mean total wage by level from 1991 to 1995
0 100,000 200,000 300,000 400,000 500,000 600,000 700,000 800,000 900,000 1,000,000 | 1 | 2 | 3 | 4 | 5 | 6 | 7 | 8
Table 6. The wage dispersion by level - the coefficient of variation Level Coefficient of variation 1 2 3 4 5 6 7 Base wage 1991 0.39 0.20 0.07 0.11 0.08 0.07 0.07 Total Wage 1991 0.37 0.22 0.12 0.16 0.14 0.15 0.17 Base wage 1992 0.38 0.18 0.11 0.11 0.09 0.09 0.12 Total Wage 1992 0.33 0.19 0.14 0.15 0.15 0.13 0.19 Base wage 1993 0.51 0.26 0.18 0.21 0.23 0.33 0.23 Total Wage 1993 0.48 0.27 0.20 0.25 0.26 0.29 0.29 Base wage 1994 0.40 0.18 0.10 0.10 0.10 0.10 0.17 Total Wage 1994 0.35 0.20 0.11 0.15 0.15 0.14 0.23 Base wage 1995 0.43 0.19 0.09 0.10 0.10 0.07 0.10 Total Wage 1995 0.38 0.21 0.14 0.23 0.16 0.11 0.23
The table shows the coefficient of variation, the ratio of the standard deviation to the mean of wages in each year for each level.
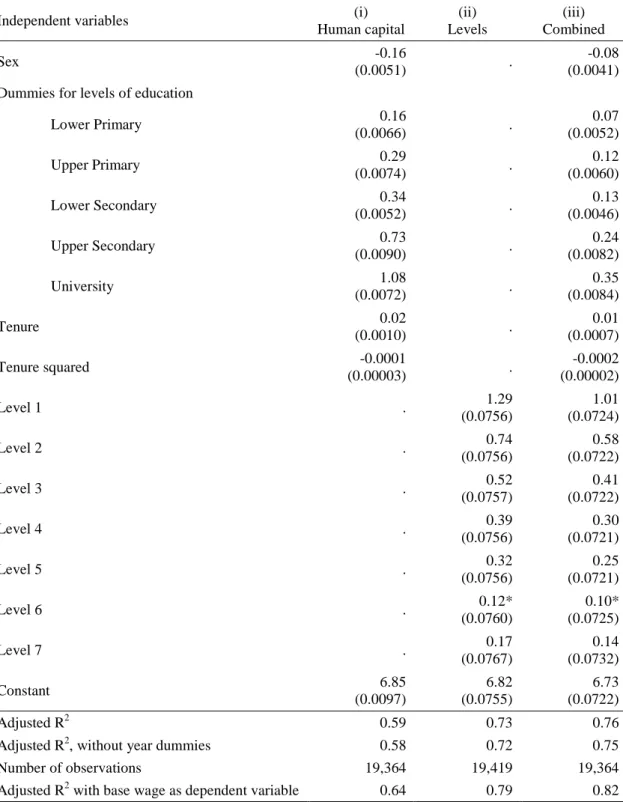
This does not mean that the levels have no effect on wages. We arrived at the same results presented in Baker, Gibbs, and Holmstrom (1994a) − that they do, indeed, have a strong explanatory power, as can be observed in Table 7 where we run several wage regressions. The first equation can be considered to be a human capital wage equation. The second has only the levels as explanatory variables. Notice the jump in the R-squared from 59% to 73%. The third equation combines the two sets of regressors, resulting in another increase in the R-squared. The estimated coefficients in the table show that higher education degree or hierarchic level implies a higher wage. Including general experience in the labor market among the independent variables does not change the results much. Cross section wage regressions were also estimated and the results confirm those of Table 7.
In order to explore the relationship further, we tried to estimate the same regression but with the difference between total and base wage as the dependent variable (results shown in Table A2 in the Appendix). The R-squared drops drastically when compared with Table 7, but the interesting result is that the dummies for levels in the hierarchy are not significant at any reasonable level.
Table 7. 1991-1995 pooled regressions − effects of human capital and hierarchical level on total wage
Independent variables (i)
Human capital (ii) Levels (iii) Combined Sex -0.16 (0.0051) . -0.08 (0.0041) Dummies for levels of education
Lower Primary 0.16 (0.0066) . 0.07 (0.0052) Upper Primary 0.29 (0.0074) . 0.12 (0.0060) Lower Secondary 0.34 (0.0052) . 0.13 (0.0046) Upper Secondary 0.73 (0.0090) . 0.24 (0.0082) University 1.08 (0.0072) . 0.35 (0.0084) Tenure 0.02 (0.0010) . 0.01 (0.0007) Tenure squared -0.0001 (0.00003) . -0.0002 (0.00002) Level 1 . 1.29 (0.0756) 1.01 (0.0724) Level 2 . 0.74 (0.0756) 0.58 (0.0722) Level 3 . 0.52 (0.0757) 0.41 (0.0722) Level 4 . 0.39 (0.0756) 0.30 (0.0721) Level 5 . 0.32 (0.0756) 0.25 (0.0721) Level 6 . 0.12* (0.0760) 0.10* (0.0725) Level 7 . 0.17 (0.0767) 0.14 (0.0732) Constant 6.85 (0.0097) 6.82 (0.0755) 6.73 (0.0722) Adjusted R2 0.59 0.73 0.76
Adjusted R2, without year dummies 0.58 0.72 0.75
Number of observations 19,364 19,419 19,364
Adjusted R2 with base wage as dependent variable 0.64 0.79 0.82 Dependent variable: log of hourly real total wage. Year dummies included in the regressions. Standard errors are in parentheses. An asterisk marks the coefficients which are not significant at any reasonable level.
Wage growth and promotions
What is the effect of promotions on the wage received by the worker? Directly related to the issue discussed above are the effects of promotions on wages. If promotions and job assignments have a signaling propriety, then not only should the change in level accompanying promotion have a positive effect on wage, but so too should the promotion which does not result in a level change (which we denominate as "promotions within levels"). They imply that even if the worker changes only a job title, the nature of his job remains the same and he stays in the same level following the promotion. As already noted Manove (1997) argues that the firm can induce individual effort with the worker's competition for a promotion, even if the after-promotion job is qualitatively equal to the before-after-promotion job.
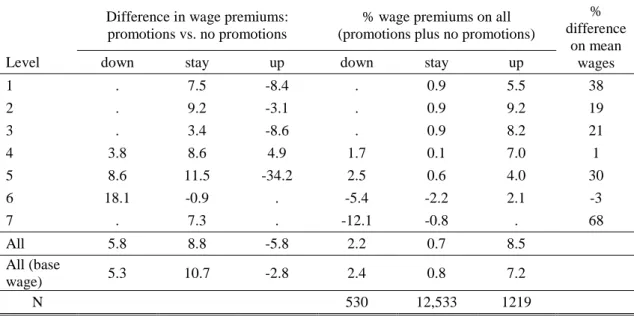
Table 8 computes the wage premiums for workers promoted and not promoted for all levels and across years. The wage premiums are calculated in each year relative to the wage increase of those workers who were not promoted in that year and stayed in the same level, and then the mean wage growth across years is computed. The last column of Table 8b presents the percentage difference on mean wages between levels. In Table 8a we have the wage premiums for workers promoted and not promoted. The workers promoted receive a wage premium. When the worker moves up in the hierarchy the wage premium becomes higher with the level of arrival: the effect of promotions is stronger in the higher levels. If the promotion is within levels, the worker stays in the same level but receives a wage premium that in some cases is higher than the wage premium received by their promoted colleagues who move to the same level from below. The same data, but with base wages, show the same propriety but for all levels, except for Level 6 (Table A3 in the Appendix). Promotion has a positive effect on wages even if the worker does not experience a change in the nature of his job assignment. Moving down the hierarchy upon promotion also has a positive effect for Levels 4 and 5. The data for these levels must be read with care. As we have already seen in Table 3, there are substantial movements of workers upon promotion to Level 4 and 5, coming from upper levels. Concerning the movements to Levels 6 and 7, there is a negative premium. Can we consider this promotion and reassignment of the worker as a demotion? That would make no apparent sense. From another perspective we can consider that their relative position inside the organization declined.
When we look to the wage premiums of the workers not promoted, they are negative for those who stay in Levels 4 or lower in the hierarchy and positive, but small, for the other levels. The data on unpromoted workers who move up in the hierarchy must be read with care, given that the total number of observations is 45
employees for the five years. Nevertheless, moving up with no promotions implies a substantial wage premium. The moves downward carry a negative wage premium. Can these movements of not unpromoted workers to lower levels in the hierarchy be considered as demotions? They are the best candidates.
Table 8a. Wage premiums − total wage
% wage premiums on:
promotions no promotions
Level down stay up down stay up
1 . 8.6 10.6 . 1.2 19.0 2 . 9.5 9.1 . 0.2 12.2 3 . 4.0 7.6 . 0.6 16.2 4 3.2 7.9 7.2 -0.6 -0.7 2.3 5 4.0 11.0 1.1 -4.5 -0.4 35.3 6 -2.8 -3.1 2.1 -20.9 -2.2 . 7 -12.1 5.9 . . -1.3 . All 3.7 8.8 8.2 -2.1 0.0 14.0 All (base wage) 3.8 10.4 7.1 -1.1 0.0 9.4 N 390 1111 1174 140 11,422 45
Table 8b. Wage premiums − total wage Difference in wage premiums:
promotions vs. no promotions
% wage premiums on all (promotions plus no promotions)
Level down stay up down stay up
% difference on mean wages 1 . 7.5 -8.4 . 0.9 5.5 38 2 . 9.2 -3.1 . 0.9 9.2 19 3 . 3.4 -8.6 . 0.9 8.2 21 4 3.8 8.6 4.9 1.7 0.1 7.0 1 5 8.6 11.5 -34.2 2.5 0.6 4.0 30 6 18.1 -0.9 . -5.4 -2.2 2.1 -3 7 . 7.3 . -12.1 -0.8 . 68 All 5.8 8.8 -5.8 2.2 0.7 8.5 All (base wage) 5.3 10.7 -2.8 2.4 0.8 7.2 N 530 12,533 1219
Looking at all workers irrespective of being promoted or not in Table 8b, there is a premium for those who moved up in the hierarchy. The premium is increasing with the level, except for Level 1. There is a small premium for those workers who stay in the same level and a negative premium for those who moved down in the hierarchy,
except for workers who moved to Levels 4 and 5. These figures hide the differences in the wage premiums upon workers promoted and not promoted for the same movements as we have seen before. Comparing with Baker, Gibbs, and Holmstrom (1994a), our results are similar except that we can distinguish the effect of promotions within levels that does not show up when we used all workers, promoted or not.
The difference between the wage increase for workers promoted and not promoted is presented in Table 8b. The difference is positive for those who stay in the same level and for those who move up in the hierarchy.
These results are in line with previous empirical work (Baker, Gibbs, and Holmstrom 1994a, McCue 1996, and Lazear 1999) and the theoretical work that reveals the importance of promotions to explain the employee's wage path.
The difference in the mean wage by level is substantially greater than the wage premiums. Promotions and/or movements between levels cannot explain all of this wage variation.
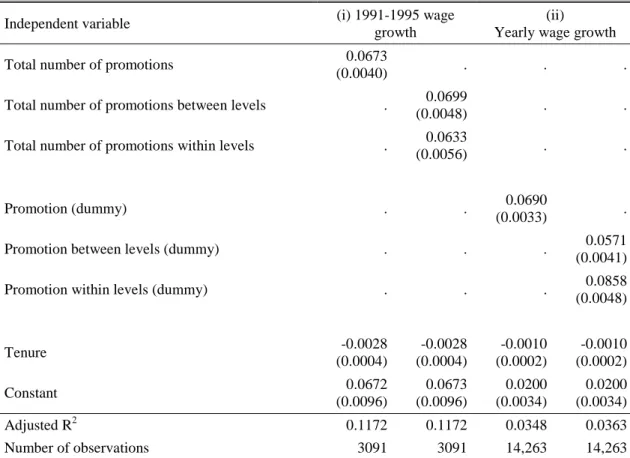
In order to explore further the effect of promotions on wage growth we run the regressions presented in Table 9. The results are similar to the ones in Lazear (1999). The difference is that we can identify the two types of promotions: within levels and between levels. A worker that is promoted one time between 1991 and 1995 has 7% wage increase from the first regression. If we breakdown the number of promotions into promotions between and within levels we observe that the coefficients do not differ much. In the second regression the dependent variable is the annual change of wages. The coefficient associated with promotion in a given year is also 7%, but the coefficients associated with the two types of promotion differ. The effect of promotion within levels is 8%, a value slightly higher that the effect of promotion between levels, 6%. This result confirms the analysis on the wage premiums. The worker receives an important wage increase every time he is promoted even if he does not change his position inside the hierarchy. The effect of tenure is small and negative. When controlling for promotions, we observe that the individual's total work experience at the firm is not the major force behind wage growth, as predicted in the model of Bernhardt (1995).
Table 9. Wage growth and promotions
Independent variable (i) 1991-1995 wage growth
(ii)
Yearly wage growth
Total number of promotions 0.0673
(0.0040) . . .
Total number of promotions between levels . 0.0699
(0.0048) . .
Total number of promotions within levels . 0.0633
(0.0056) . .
Promotion (dummy) . . 0.0690
(0.0033) .
Promotion between levels (dummy) . . . 0.0571
(0.0041)
Promotion within levels (dummy) . . . 0.0858
(0.0048) Tenure -0.0028 (0.0004) -0.0028 (0.0004) -0.0010 (0.0002) -0.0010 (0.0002) Constant 0.0672 (0.0096) 0.0673 (0.0096) 0.0200 (0.0034) 0.0200 (0.0034) Adjusted R2 0.1172 0.1172 0.0348 0.0363 Number of observations 3091 3091 14,263 14,263
Dependent variable: regression (i), change in log of hourly wage between 1991 and 1995; regression (ii), annual change in log hourly wage. Standard errors are in parentheses. All coefficients are significant. Ordinary least squares coefficients presented. Other estimation methods like the fixed-effects estimator were applied to regression (ii), but the results remained qualitatively the same. Regression (i) uses the workers who were in the firm in 1991 and still remain there in 1995.
Promotions and Wage Distribution
This section analyzes the distribution of pay for promoted employees. We want to find the wage decile before promotion and after promotion. Before and after promotion we can find the place of the worker in the wage distribution of workers who are in the same level as him.
If the employee changed level, then he was promoted between levels and we have to place him in one wage decile in the level before the promotion and in another wage decile in the level following the promotion. Table 10 shows the employees' transitions of levels upon promotion and the resulting wage deciles. The promoted workers came from all deciles. If that is so, we expect that the employees change their places in the respective distribution, from the higher deciles in the level before promotion to lower deciles in the level after promotion. That seems clear in data concerning the promotions from Level 2 to Level 1. For the other cases it is not so clear. To highlight
this issue we computed the cumulative distribution of promotees for each case of level change; that is, we put the cumulative distribution of promotees before promotion against the cumulative distribution of promotees following promotion, summing the values by row in Table 10. The results are in Figure 4. If more workers are promoted from the top deciles, then the cumulative distribution should have more weight near 100%. If workers are promoted to the bottom deciles, then the cumulative distribution should have more weight near zero. The resulting figure would have the plot of the distribution before promotion under the distribution after promotion. Figure 4 confirms what we have just stated.
a. from Level 2 to Level 1
0 10 20 30 40 50 60 70 80 90 100 1 2 3 4 5 6 7 8 9 10 Deciles %
Before promotion After promotion
b. from Level 3 to Level 2
0 10 20 30 40 50 60 70 80 90 100 1 2 3 4 5 6 7 8 9 10 Deciles %
Before promotion After promotion
c. from Level 4 to Level 3 0 10 20 30 40 50 60 70 80 90 100 1 2 3 4 5 6 7 8 9 10 Deciles %
Before promotion After promotion
d. from Level 5 to Level 4
0 10 20 30 40 50 60 70 80 90 100 1 2 3 4 5 6 7 8 9 10 Deciles %
Before promotion After promotion
e. from Level 6 to Level 5
0 10 20 30 40 50 60 70 80 90 100 1 2 3 4 5 6 7 8 9 10 Deciles %
Before promotion After promotion
Table 10. Distribution of pay for promotees between levels in salary deciles before and after promotion
Percentage in each wage decile
Promotion Statistic N 1 2 3 4 5 6 7 8 9 10 all
from Level 2 Decile before promotion 233 0.9 0.4 2.6 3.4 3.9 15.9 27.0 12.9 18.5 14.6 100
to Level 1 Decile after promotion 233 49.4 15.9 8.2 11.6 5.6 3.4 3.4 1.7 0.9 0.0 100
from Level 3 Decile before promotion 193 6.7 8.3 5.7 6.2 7.3 9.3 10.9 14.5 16.6 14.5 100
to Level 2 Decile after promotion 193 7.8 8.3 6.7 22.8 13.0 11.4 13.0 11.4 5.7 0.0 100
from Level 4 Decile before promotion 46 4.3 17.4 6.5 4.3 6.5 13.0 15.2 8.7 6.5 17.4 100
to Level 3 Decile after promotion 46 28.3 10.9 15.2 10.9 4.3 2.2 8.7 6.5 0.0 13.0 100
from Level 5 Decile before promotion 311 9.3 11.9 12.2 8.4 10.6 12.9 15.4 8.0 6.1 5.1 100
to Level 4 Decile after promotion 311 10.3 12.2 6.4 5.8 4.8 13.2 12.9 7.1 17.4 10.0 100
from Level 6 Decile before promotion 33 6.1 0.0 12.1 12.1 6.1 6.1 9.1 18.2 18.2 12.1 100
to Level 5 Decile after promotion 33 21.2 27.3 18.2 12.1 9.1 3.0 6.1 3.0 0.0 0.0 100
from Level 7 Decile before promotion 23 4.3 8.7 21.7 21.7 17.4 8.7 13.0 4.3 0.0 0.0 100
to Level 6 Decile after promotion 23 4.3 4.3 8.7 26.1 8.7 13.0 30.4 0.0 0.0 4.3 100
The reverse is true for promotions within levels. Table 11 shows the distribution of pay for promoted workers who remained in the same level following the promotion and compares the deciles before and after promotions. If the individual's wage increases following the promotion and if he stays in the same level, then he moves from lower deciles to upper deciles. The information in the table does not allow reaching a conclusion concerning these movements of the workers up in the distribution. Nevertheless, if we observe Figure 5 (that plots the cumulative distribution of workers before and after the promotion for each level), the distribution following the promotion is always under the distribution before promotion. There is a shift in the number of workers from the bottom deciles to the top deciles. This shift is in the reverse direction of the shift that resulted from promotion in which the worker moved up one level in the hierarchy.
a. Level 1 0 10 20 30 40 50 60 70 80 90 100 1 2 3 4 5 6 7 8 9 10 Deciles %
Before promotion After promotion
b. Level 2 0 10 20 30 40 50 60 70 80 90 100 1 2 3 4 5 6 7 8 9 10 Deciles %
Before promotion After promotion
c. Level 3 0 10 20 30 40 50 60 70 80 90 100 1 2 3 4 5 6 7 8 9 10 Deciles %
Before promotion After promotion
d. Level 4 0 10 20 30 40 50 60 70 80 90 100 1 2 3 4 5 6 7 8 9 10 Deciles %
Before promotion After promotion
e. Level 5 0 10 20 30 40 50 60 70 80 90 100 1 2 3 4 5 6 7 8 9 10 Deciles %
Before promotion After promotion
Table 11. Distribution of pay for promotees within levels in salary deciles before and after promotion
Percentage in each wage decile
Promotion Statistic N 1 2 3 4 5 6 7 8 9 10 all
From Level 1 Decile before promotion 236 6.4 3.8 7.6 11.0 11.4 11.9 13.1 13.1 13.1 8.5 100
to Level 1 Decile after promotion 236 5.1 5.1 3.4 11.4 8.9 11.9 10.6 14.0 16.1 13.6 100
from Level 2 Decile before promotion 203 13.3 21.2 17.7 8.4 7.9 5.9 10.3 3.0 6.9 5.4 100
to Level 2 Decile after promotion 203 0.5 3.9 17.2 20.2 4.4 12.3 12.3 7.4 8.4 13.3 100
from Level 3 Decile before promotion 91 3.3 6.6 5.5 15.4 9.9 27.5 11.0 8.8 11.0 1.1 100
to Level 3 Decile after promotion 91 3.3 1.1 3.3 15.4 12.1 17.6 14.3 13.2 18.7 1.1 100
from Level 4 Decile before promotion 267 13.1 21.3 16.5 12.0 12.0 5.6 10.9 4.5 2.6 1.5 100
to Level 4 Decile after promotion 267 3.7 10.1 10.9 12.7 14.2 11.6 14.2 8.2 10.1 4.1 100
from Level 5 Decile before promotion 287 16.7 9.4 14.3 8.4 9.8 9.4 9.4 10.1 7.3 5.2 100
to Level 5 Decile after promotion 287 14.3 6.3 6.3 7.0 8.4 10.5 9.8 13.2 9.4 15.0 100
Shows the place of the worker in the wage distribution of all workers in the same level before and after he is promoted summed for all years. Levels 6, 7 and 8 excluded, due to limited number of observations.
Exit and Wage Distribution
If a worker does not match with his employer or does not match up with his colleagues, he has a high probability of leaving the firm. In addition his relative wage should be low. As a result, when he leaves the firm, his last place in the wage distribution should be at the bottom.
Table 12 computes workers' exit by wage decile from each hierarchical level of the firm. The bottom decile has the highest percentage of exits, except in Level 1 and Level 6. Beyond that fact, we can not add much. What is stated above finds some support in the data. The percentage of exit seems to decrease as we move up in the wage distribution, but in Level 1 the top deciles have the highest percentage of exit and in Level 4 the top decile as the second highest value. The exits from the top decile can be interpreted as the worker accepting better proposals from other firms. We performed a Chi-squared test to see if the workers flow out of the firm in a uniform way (10% from each decile) as Baker, Gibbs, and Holmstrom (1994a). This hypothesis was refuted in all levels. In the paper just mentioned the authors did not find evidence of significant workers' selection upon exit. The evidence on the firm that we analyze shows that exit has a role in the selection of workers in the hierarchical levels.
Table 12. Distribution of pay for workers that exit the firm
Percentage from each wage decile
Level N 1 2 3 4 5 6 7 8 9 10 All 1 186 11.3 7.0 7.5 10.2 5.4 9.1 7.0 11.3 11.3 19.9 100 2 209 12.0 9.6 12.4 8.6 9.1 12.0 12.9 7.2 7.2 9.1 100 3 147 28.6 16.3 10.2 12.9 7.5 4.1 7.5 4.1 1.4 7.5 100 4 264 22.7 9.1 6.8 8.7 8.0 7.2 7.6 8.7 7.2 14.0 100 5 379 21.1 9.8 10.6 9.8 11.9 10.3 9.0 6.3 5.0 6.3 100 6 144 17.4 13.9 14.6 13.9 18.1 4.2 6.9 4.9 2.1 4.2 100 7 34 23.5 2.9 0.0 11.8 8.8 5.9 11.8 17.6 14.7 2.9 100
Shows the place of the worker in the wage distribution of all workers in the same level when he exits the firm summed for all years. Chi-squared tests were performed to test the hypothesis of a uniform distribution (10% in each decile): the hypothesis was rejected in all levels of the hierarchy.
Entry and Wage Distribution
The worker is expected to enter to at bottom deciles of the wage distribution. Table 13 presents the wage distribution at entry. Although workers' entry occurs in all deciles of Level 1, it is concentrated in the top deciles. We can link this fact with the analysis of Table 3, where the workers hired into this level are older, have more years of schooling, and have more years of experience in the labor market than the do entrants into other levels. We can surmise that the general human capital plays a higher role in this level, which does not allow the firm to treat the outsiders too differently from the insiders. In Level 2 we have a similar situation, although not as pronounced. As we move down in the hierarchy there a clear tendency to place the newly hired workers in the bottom deciles. Notice that fewer than 5% of the workers are placed in the second half of the wage distribution for Levels 6 and 99.
Table 13. Distribution of pay for workers who enter the firm
Percentage to each wage decile
Level N 1 2 3 4 5 6 7 8 9 10 All 1 64 9.4 3.1 6.3 7.8 3.1 12.5 6.3 9.4 15.6 26.6 100 2 185 3.8 3.8 7.0 3.2 10.8 18.4 15.7 22.7 11.9 2.7 100 5 81 7.4 8.6 38.3 27.2 6.2 3.7 1.2 3.7 3.7 0.0 100 6 98 20.4 18.4 18.4 16.3 20.4 2.0 1.0 1.0 0.0 2.0 100 99 86 27.9 48.8 3.5 9.3 8.1 2.3 0.0 0.0 0.0 0.0 100
Shows the place of the worker in the wage distribution of all workers in the same level when he enters the firm summed for all years.
3. Conclusion
The objectives of the analysis performed were to assess whether or not the data available could be used to study the internal economics of the firm and whether or not we could reach manageable results. We have fulfilled both objectives to some extent. The data set is unique in the perspective of personnel economics. We are not using the
firm personnel records. Instead we are using information contained in a large survey of firms gathered annually by the employment authorities. This fact allows for the moving from the case study to more comprehensive studies.
The hierarchical levels assigned to the employees by the firm replicate the true hierarchy of the firm. The firm has its own hierarchic structure that is filtered by the mandatory rules of the survey. With the analysis of the workers' transitions between levels and the firm promotion policy we established that there is a hierarchical ladder that the employee climbs during his working life. Furthermore the promotion patterns respect the organization design, translated into promotions mainly to the next upper hierarchical level, given that this level corresponds to an increase in the task complexity and responsibility.
The study of the promotion policy can be extended with a direct estimate of the factors that influence the worker's probability of promotion. The results show a positive effect of education and a negative effect of tenure in a given hierarchical level on the promotion probability.
The analysis of the wage policy could be undertaken after ascertaining that the data were valuable for studying the hierarchy of the firm. The wage structure is determined by the hierarchic structure. This determination is not complete but the results show a strong relationship between the two. If the levels cannot explain all of the wage variation, then there is evidence and the firm also pays the workers according to the individual performance. The individual effects are stronger in the upper levels of the hierarchy, as the wage dispersion increases.
The wage path along the working life is strongly influenced by the promotion policy of the firm. The worker's promotion implies a positive wage premium. If we distinguish between promotion between levels and promotion within levels, then we find that being promoted and staying in the same level is sufficient to receive a higher wage. Thus, promotion by itself − promotion within levels − has a positive effect on wages (that is, with no change in the job nature with respect to responsibility and complexity, the worker experiences a wage jump). The effect of promotion on wage can be further explored by estimating and quantifying this effect. The results presented show that promotion sorts the employees between higher earners and lower earners, given that promotion implies a higher wage growth.
Four major events were related to the wage distribution: promotion between and within levels, exit, and entry. The workers promoted between levels come from the top of the wage distribution but move to the bottom of it in their new level. On the contrary and obviously, workers promoted within levels move from the bottom to the top of the wage distribution of their colleagues in the same level. Though there is workers' exit independently of the wage received, there is some evidence that it is
concentrated in the bottom of the wage distribution. Entry is also concentrated in the bottom of the distribution, especially for those hired into the lower levels of the hierarchy.
The next step in this research is to find ways of applying the same type of analysis to a sample of firms and to get readable results.
Appendix
A. Data Set Description and Summary Statistics
The survey, Quadros de Pessoal, that the Ministry of Employment annually collects from the Portuguese firms, is the data source used in this paper. The survey includes the data collected in questionnaires that are sent to Portuguese firms every year. Every firm with more than one employee gives information about workers' personal characteristics and firm characterization. The firm is required by law to respond to the survey. The reference month is March until 1993. After this year the reference month is October. The survey does not cover the individuals in the army and civil servants. The sample used in this paper dates from 1991 to 1995. As explained above, the objective is to study the internal economics of firms using this data set. As a first step toward achieving that goal, we draw aleatorilly one firm from the original data set, requiring only that the firm was present in all years of the survey.
The data is yearly based. This means that we do not know what happens to the worker between two consecutive years. Furthermore, it is possible that some workers are hired and fired within the year and that fact does not show up in the employee records. Until 1993 the survey was conducted in March. The yearly data used in this paper is constructed in a way that the period ends in this month and not on the previous December 31. In this perspective, we respect the fact that the reports are for a specific month and not for the end of the year. Otherwise the analysis conducted would be in the wrong path. The drawback is that the 1994-year is longer than 12 months: starting in that year the survey was conducted in October. In any event, this problem persists even if another approach to the data is used.
We describe the variables used below.
Qualification level. Classification of jobs according to the task performed and skill
requirement. Each qualification level can be considered as a layer in a hierarchy defined in terms of increasing responsibility and task complexity. The firm is required to classify jobs using these levels defined by law (Decreto Lei 121/78 of July 2). The levels are:
Level 1 − top executives;
Level 2 − intermediary executives; Level 3 − team leaders;
Level 5 − qualified professional; Level 6 − semi-qualified professionals; Level 7 − non-qualified professionals; Level 8 − apprentices;
Level 99 − ignored and residual.
Level of education. Last completed level of education (years assigned to each level
between brackets): illiterate (0 years); can read and write (0 years); Lower primary (4 years); Upper Primary (2 years); Lower Secondary (3 years); Upper Secondary (2/3 years); University (3 years for baccalaureate or 5 years for undergraduation). After 1978 the Upper Secondary had one more year.
Date of admission. Variable used to compute the worker's tenure in the firm.
Date of last promotion. Variable used to compute the timing of the worker's
promotion.
Base wage. Monthly base wage. All the monetary variables are real values in 1995
constant PTE using the CPI.
Tenure-based compensation and bonuses. Additional monthly compensation paid to
the worker in a regular fashion.
Other regular compensations. Additional monthly regular compensation.
Table A1. Summary statistics
Year
Variable Statistic 1991 1992 1993 1994 1995
Tenure mean 17 17 16 17 17
Age mean 43 43 42 43 43
Years of schooling mean 9 9 9 10 10
Mean base wage mean 200,314 212,783 235,759 226,491 235,174 std. dev. 118,107 125,093 154,771 141,598 149,205
Mean total wage mean 257,754 269,683 290,518 280,420 292,768 std. dev. 128,484 128,576 164,560 140,462 149,170
Entry rate (%) 0.3 2.7 5.8 1.9 3.6
Exit rate (%) . 13.6 8.1 10.0 4.2
Employment growth
B. Additional Tables and Figures a. 1991-1992 entry 1 2 3 4 5 6 7 8 99 exit 1 2 3 4 5 6 7 8 99 0 100 200 300 400 500 600 700 800 900 b. 1992-1993 entry 1 2 3 4 5 6 7 8 99 exit 1 2 3 4 5 6 7 8 99 0 100 200 300 400 500 600 700 800 900
c. 1993-1994 entry 1 2 3 4 5 6 7 8 99 exit 1 2 3 4 5 6 7 8 99 0 100 200 300 400 500 600 700 800 d. 1994-1995 entry 1 2 3 4 5 6 7 8 99 exit 1 2 3 4 5 6 7 8 99 0 100 200 300 400 500 600 700 800
0 100,000 200,000 300,000 400,000 500,000 600,000 700,000 800,000 900,000 | 1 | 2 | 3 | 4 | 5 | 6 | 7 | 8
Table A2. 1991-1995 pooled regressions − effects of human capital and hierarchical level on total minus base wage
Independent variables (i)
Human capital (ii) Levels (iii) Combined Sex -0.37 (0.0121) -0.29 (0.0123) Dummies for levels of education
Lower Primary 0.14 (0.0156) 0.06 (0.0156) Upper Primary 0.14 (0.0174) 0.08 (0.0178) Lower Secondary 0.18 (0.0123) 0.07 (0.0136) Upper Secondary 0.13 (0.0213) 0.06 (0.0246) University -0.12 (0.0172) -0.17 (0.0252) Tenure -0.002* (0.0022) -0.003* (0.0022) Tenure squared -0.0003 (0.0001) -0.0003 (0.0001) Level 1 -0.01* (0.2356) 0.16* (0.2295) Level 2 0.34* (0.2355) 0.42 (0.2289) Level 3 0.54* (0.2357) 0.55 (0.2290) Level 4 0.03* (0.2355) 0.12* (0.2287) Level 5 0.18* (0.2355) 0.20* (0.2287) Level 6 -0.24* (0.2368) -0.16* (0.2299) Level 7 -0.18* (0.2389) -0.03* (0.2320) Constant 5.89 (0.0229) 5.60 (0.2352) 5.72 (0.2289) Adjusted R2 0.09 0.09 0.15
Adjusted R2, without year dummies 0.08 0.09 0.14
Number of observations 19,147 19,199 19,147
Dependent variable: log of hourly additional pay. Additional pay is the difference between total wage and base wage or: tenure-based compensation plus bonuses plus other regular compensations. Year dummies included in the regressions. Standard errors are in parentheses. An asterisk marks the coefficients not significant at any reasonable level.
Table A3a. Wage premiums - base wage
% wage premiums on:
promotions no promotions
Level down stay up down stay up
1 . 13.8 11.0 . 1.3 18.6 2 . 11.3 9.4 . 0.4 7.0 3 . 5.4 3.1 . 1.6 13.7 4 2.3 9.0 5.6 -0.6 -1.2 -0.1 5 4.4 11.2 2.6 -3.2 -0.8 21.2 6 -3.6 -6.0 -0.3 -20.0 -1.7 . 7 -13.7 9.6 . . 0.0 . All 4.0 10.6 7.4 -1.3 0.0 10.2 N 390 1111 1174 140 11,425 45
Table A3b. Wage premiums − base wage Difference in wage premiums:
promotions vs. no promotions
% wage premiums on all (promotions plus no promotions)
Level down stay up down stay up
% difference on mean wages 1 . 12.5 -7.7 . 1.5 6.5 60 2 . 10.8 2.4 . 1.3 9.4 34 3 . 3.8 -10.6 . 1.9 3.8 8 4 2.9 10.1 5.8 -0.1 -0.2 5.4 8 5 7.7 12.0 -18.6 3.0 0.3 4.1 20 6 16.4 -4.3 . -6.0 -1.8 -0.3 -1 7 . 9.6 . -13.7 0.6 . 68 All 5.3 10.7 -2.8 2.6 0.9 7.5 N 530 12,536 1219
References
Ariga, Kenn, Yasushi Ohkusa, and Giorgio Brunello. 1999. Fast track: is it in the genes? The promotion policy of a large Japanese firm. Journal of Economic
Behavior and Organization 38: 385-402.
Baker, George, Michael Gibbs, and Bengt Holmstrom. 1993. Hierarchies and Compensation. European Economic Review 37: 366-378.
________. 1994a. The Internal Economics of the Firm: Evidence from Personnel Data. Quarterly Journal of Economics 109: 881- 919.
________. 1994b. The Wage Policy of a Firm. Quarterly Journal of Economics 109: 921- 955.
Bernhardt, D. 1995. Strategic promotion and Compensation. Review of Economic
Studies 62: 315-339.
Calvo, Guillermo A. and Stanislaw Wellisz. 1979. Hierarchy, Ability, and Income Distribution. Journal of Political Economy 87: 991-1010.
Chan, William. 1996. External Recruitment versus Internal Promotion. Journal of
Labor Economics 14: 555-570.
Lazear, Edward P. 1999. Personnel Economics: Past Lessons and Future Directions.
Journal of Labor Economics 17: 199-236.
Lazear, Edward P. and Sherwin Rosen. 1981. Rank-Order Tournaments as Optimal Labor Contracts. Journal of Political Economy 89: 841-864.
Manove, Michael. 1997. Job Responsibility, Pay and Promotions. The Economic
Journal 107:85-103.
McCue, Kristin. 1996. Promotions and Wage Growth. Journal of Labor Economics 14: 175-209.
Medoff, James I. and Katherine G. Abraham. 1980. Experience, Performance, and Earnings. Quarterly Journal of Economics 95: 703- 736.
Milgrom, Paul and Sharon Oster. 1987. Job Discrimination, Market Forces and the Invisibility Hypothesis. Quarterly Journal of Economics 102: 453-476.
Ricart I Costa, Joan E. 1988. Managerial Task Assignment and Promotions.
Econometrica 56: 449-466.
Waldman M. 1984a. Job assignments, signalling, and efficiency. Rand Journal of
Economics 15: 255-267.
________. 1984b. Worker Allocation, Hierarchies and the Wage Distribution. Review