Inequality and Economic Growth:
Are Both Walking Hand in Hand?
The Case of Latin America
Catarina Alexandra Belerique Duarte Ferreira
Dissertation submitted in partial fulfillment of requirements for the degree of MSc in
Business Administration, at Católica-Lisbon School of Business and Economics
ii
Abstract
Title: Inequality and Economic Growth: Are Both Walking Hand in Hand? – The Case of Latin America
Author: Catarina Alexandra Belerique Duarte Ferreira
The responsible for dictating policies, sometimes choose a path were they put in second plan the problematic of inequality which is intrinsically connected with other complex realities such as poverty. The conception is that income distribution in the long run will remain constant, so the best way to increase the life conditions of the population is betting in economic growth because there is not a plain relation among economic growth and inequality.
The aim of the study performed in this thesis was to understand the correlation among inequality and economic growth. Does economic growth lead to a better situation of the population in a homogeneous way indeed? Or do those benefits not reach the entire population? A quantitative method was applied in this study in order to gather results and responses. The analysis was based on statistical measures of Pearson’s correlation derived from data of Gini Index and GDP indicators, since they are both able to represent the equity in distribution of income and economic growth respectively. The group of countries in which the analysis was performed was the Latin America.
The results indicate that, if in one hand it was not proved a direct and undoubted connection among economic growth and a raise on inequality, on the other hand it was not proven that they are completely independent either. The fairest way to look at this problem is not the impact of economic growth on inequality and the other way around but how those economic growth policies are chosen and their impact on the society.
iii
Acknowledgement and Motivation
The elaboration of my Master Thesis Dissertation can be seen as the final chapter of my Masters but I decided not to look at it simply as a requirement that has to be fulfilled in order to complete the Master program.
In my perspective, it is the chance to use all the knowledge and skills I acquired and developed during the academic path and apply them in an area in which I have a particular interest and at the same time contribute for the development of that field. The opportunity of doing the thesis in the area of Development meant, to me, the possibility of working in a field that mattered. Maybe I will not be able to solve all the problems in the world, but now I am a step closer to do so. If this thesis is not a solution, at least I would like it to be seen as a part of the understanding and a way of tackling the problem.
Therefore, I would like to show my gratitude to Católica-Lisbon School of Business and Economics for providing all the means and academic support along the path that started on the Undergraduate Programm until now that allowed me to receive immeasurable knowledge and tools for the future. And in this context I would like to give a special thank to Prof. Ana Canhoto for the support given to me when I needed it the most.
I owe a special thanks to my Thesis advisor, most of all for providing the motivation, for always making me go a step further and for the patience to listen and give me feedback along these last months.
I also want to thank Claudia Martínez for being so cooperative in providing information for my thesis and by giving me valuable inputs regarding the scope of my studies, also to Raquel Miranda and Laura Anselmo that were my partners during the elaboration of the thesis.
There are also some other participants that have a role in making this thesis possible and is with an enormous satisfaction that I thank them.
First, and it could not be in any other way, a special thank to my family who always put their faith on me, helped and supported me regardless of the situation, especially to my parents and grandparents whom created the correct atmosphere to made this path the obvious path to follow.
iv To my friends João Pires, Mariana Mendes, Natália Gonçalves, Raquel Azevedo and Sílvia Barroso, that are part of my life since ever, I would like to express my gratitude mainly for making me feel that I could not tell the story of my life without mentioning them.
Last, but not least, I would like to thank Joana Martins, who is my Dopplegänger, also Antonella Costa, Melissa Fonseca and Teresa Matamouros for turning some moments with a potential of becoming a catastrophe, into happy remarkable moments.
v
Table of Contents
ABSTRACT………. ii
AKNOWLEDGEMENTS AND MOTIVATION……….. iii
CONTENTS 1. Introduction……… 1
2. Literature Review………..……….….. 3
2.1 What is Inequality………..………. 3
2.1.1 Broad Approach to Inequality……….………..……….… 3
2.1.2 Narrow Approach to Inequality……….. 3
2.2 Global Inequality……….. 4
2.3 Sources of Inequality………. 5
2.3.1 Traditional Causes………. 6
2.3.2 New Causes………...… 7
2.4 Sources of Inequality by Geographic Area………..……… 9
2.5 Consequences of Inequality……….. 10
2.6 Theories of Economic Growth………. 11
2.6.1 Solow’s Growth Model……….. 11
2.6.2 Endogenous Growth Model………..………... 11
2.6.3 The Convergence Hypothesis………..………. 12
2.7 Determinants of Economic Growth………..……….. 12
3. Methodology………. 14
3.1 Data……… 14
3.2 Correlation………. 15
3.3 Scope of Analysis……….. 16
3.4 Countries Exclusion………. 17
3.5 GDP and Gini Coefficient Correlation………..……….. 17
3.6 Variables with Different Scales ………..……… 19
3.7 Annual Percentage Growth of GDP and Gini Coefficient Correlation..……… 19
4. Discussion of the Results……..………..………. 21
4.1 Limitations………. 25 4.2 Future Research………. 26 5. Conclusion……….. 28 6. References……….. 30 6.1 Bibliography………. 30 6.2 Netgraphy……….. 33 APPENDICES………... 34
1
1. Introduction
“The data confirm that countries that are more unequal are also more politically unstable; they have more revolutions and coups. Societies with a large middle class, on the other hand, have incentives favorably aligned for growth, political stability, and democracy.”
—William Easterly,
The Elusive Quest for Growth (2001), p. 267
The world is usually seen as a place full of inequalities and with uneven access to opportunities. And the situation is getting worse as the time goes by, although the relative share of the population considered poor is reducing, the number of poor population is rising in absolute values ( Chen and Ravallion, 2000).
This issue of increasing poverty became so relevant in the international community that elimination, or at least reducing poverty to “acceptable” values (from 30 to 15 percentage points between 1990 and 2015 in developing countries) was turned into one of the top priorities by the United Nations Millennium Summit, representing in an indirect way of expressing the concerns of a representative part of the world leaders.
This problematic becomes more relevant when looking at some figures that allow a better understanding of how unevenly wealth is being distributed in the world population. The top 10 percent of the world population account for 85 percentage points of the global household income, on the other side, the bottom 10 percent of the population owns 0.7 percent of the wealth and the bottom 5 percent accounts for 0.2 of the global income. This means that the people in the richest group take approximately 48 hours to receive the same income that the people in the bottom need a year to earn. (Milanovic, 2006; IPC, 2007)
But those differences have not always been so pronounced. The total income inequality has quickly increased in the last decades in all different levels of inequality, from the individual perspective inside a certain society or country, but also inequalities among countries. If we step back and look into the numbers of this disparity computed by Adam Smith at the time he was writing The Nature and Causes of the Wealth of Nations in 1776, he estimated a gap where richest countries were approximately four times wealthier than the poorest countries. The same gap nowadays increased drastically and the difference among the richest and the
2 poorest countries is 145 times measured in GDP per capita1 (at Purchasing Power Parity (PPP), between the USA and the DR Congo).
Estimating the evolution of those inequalities in terms of the Gini coefficient, in 1820, the Global Gini coefficient was estimated to be roughly 0.43 (Milanovic, 2009), currently it has the value of around 0.65. It means that if the world had only a country, it would have a higher inequality than the most unequal country has nowadays. Among the developed countries, the one with higher inequality is Portugal and it has a value bellow the 0.4 regarding Gini coefficient (Lopez and Perry, 2007). But if historically, inequality worsened, the predictions for the future made by Hillebrand (2008) do not indicate a better scenario in the coming years with increases not only in inequality but also in the number of poor people between 2015 and 2050.
One of the paths the international community and development agencies put their focus on and usually follow to improve the life conditions in the developing countries is through economic growth. Recent trends are more focused in a particular type of growth, the growth with equity. The analysis discovered that the effectiveness of the economic growth in improving lives is dependent on the inequality in that society. So what is really happening? What is the real impact of growth on inequalities?
Section II has two main parts. It addresses the topic of inequality and some relevant issues regarding it such as the definition of inequality, some sources of inequality and consequences of inequalities, among others. And the other topic is related to the economic growth, some theories that aim to explain the growth and their predictions. The research question that will be accessed in this study is: what is the correlation between the economic growth and the reduction of the inequality in the life conditions of the population within countries?
Section III has the methodological component of this study. This study will have a focus on an analysis of countries from Latin America and it will take the data of Gini coefficient and GDP of the countries in the last five decades into consideration and use it to perform some statistical calculations using the correlation of Pearson. In Section IV, using the results of the previous section, we will draw conclusions of the main findings, points some limitations of the research and present suggestions for further research on this topic. And the final Section V concludes this study.
1 World Bank Development Indicators, 2009
3
2. Literature Review
2.1 Definition
The word inequality tends to be used vaguely and is capable of encapsulating a lot of different aspects (Krueger, 2002). In order to create a more systematic approach to the definition, it can be divided into two: narrow and broad approaches (Crow et al., 2009).
2.1.1 Broad Approach to Inequality
Inequality has no one consensual definition to everybody, it encompasses different aspects depending on the individual and is dependent on each personal sense of justice (Krueger, 2002) and there are the ones who defend that inequality is an ethical problem and therefore it should be fought (Cornia and Court, 2001). Furthermore, inequality can also be seen as unequal access to opportunities and rights (such as health, education, resources and infrastructures) due to gender, ethnicity, religion, social status and geographic location (Barber, 2008).
2.1.2 Narrow Approach of Inequality
Although, as seen before, inequality alludes to more than just value (Barber, 2008), the narrow view of inequality, and used more commonly, is that it can be summarized and simplified to by some measure of income, output or productivity (Crow et al., 2009). In this context the income inequality can be defined as “the inequality of the distribution of household income among the population of one country”, where the magnitude of the income inequality is subordinated most of all on the allocation of wages, assets and to the policy of each government (Cornia and Court, 2001).
There is a concept of different levels of inequality that is used for several authors that aims a better understanding of what inequality is. Those levels of concepts are the following: concept (1), “un-weighted international inequality”, measured by the difference of the average incomes of each country. Although this concept is used often, it does not take into account the dimension of each country, which is relevant because the impact of growth in the income differs according with the dimension of the country itself. The concept (2), “weighted international inequality”, tries to correct the flaws of the first concept since it is the level of discrepancy taking into account the population of each country. However, it still does not have into consideration the disparities within-country, assuming by default that the income is
4 distributed equally to each individual inside a society. To solve that problem, the concept (3) also called “global inequality” looks into the difference of income at an individual or household level. This concept is particularly important because this level of inequality is the base to all the other levels of inequality and more easily revertible by changing policies. (Cornia and Court, 2001; Crow et al., 2009; Milanovic, 2006).
2.2 Global Inequality
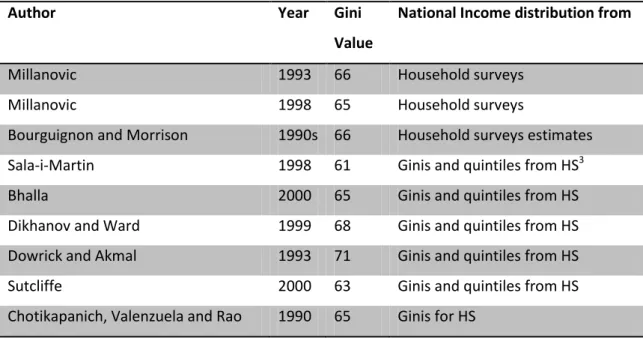
Table 1 summarises the results for the Gini value from different authors regarding different studies about inequality. All those studies have in common that the inequality is measured at an individual level (per capita) and all the national incomes are transformed into international using PPP2.
Table 1. Global Inequality (in Gini points) in the 1990s, According with Various Authors
Author Year Gini
Value
National Income distribution from
Millanovic 1993 66 Household surveys
Millanovic 1998 65 Household surveys
Bourguignon and Morrison 1990s 66 Household surveys estimates Sala-i-Martin 1998 61 Ginis and quintiles from HS3
Bhalla 2000 65 Ginis and quintiles from HS
Dikhanov and Ward 1999 68 Ginis and quintiles from HS Dowrick and Akmal 1993 71 Ginis and quintiles from HS Sutcliffe 2000 63 Ginis and quintiles from HS Chotikapanich, Valenzuela and Rao 1990 65 Ginis for HS
Source: Milanovic (2006)
The Gini values that are resultants from the studies, excluding the furthest values, the 61 and the 71, are among the interval of 63 and 66. This a very small range of results which denotes a certain degree of agreement regarding the values and it becomes even more notable if it is taken into consideration that the majority of the estimated values lie inside the standard error of the other results. The value for the Gini of about 65 points is a high value for inequality,
2
The PPP exchange rates may have diverse sources
5 higher than countries such South Africa and Brazil that are known for the high levels of inequality. So, it means that if the world were one only country, than it would be more unequal than any country that exists (Milanovic, 2006).
Even though those authors mentioned in the Table 1 ended up getting identical results, on the other hand there are no consensus regarding course of the evolution of those values and the dimension of that variation (Milanovic, 2006). Hillebrand (2008) however, predicts not only an increase in inequality until 2050 and also an increase in the number of poor population.
When looking historically at the evolution of inequality, from the 1950s until the middle of the 1970s, during an era of economic growth steadiness, there was a diminution of income inequality in a group of countries. According to the data provided by WIID4, for the group of 73 countries who had good information regarding inequality, 48 of them showed an increase in inequality in the previous two decades. Other 16 of the 73 countries preserved stable and inequality decreased in 9 countries. It is possible to look at the weight of each group of countries by the GDP-PPP and the population that they account. The group of countries with increasing inequalities has a share of 59 percent of the population and 78 percent of the GDP-PPP. On the other hand, the countries where was witnessed a decrease in inequality have 5 percent of the population and 9 percent of the GDP-PPP. All of these percentages are of the sum of the values for the sample (Cornia and Court, 2001).
2.3 Sources of Inequality
The rise of the inequalities is consequence of a continuous process that occurred for an extended period in time. It did not happened suddenly (Lopez and Perry, 2007).
There is not a conjecture that according to the broad definition of inequality, explains the phenomenon of inequality. The assumptions and patterns that are used in order to explain inequality only get their focus in explaining the narrow approach because they try to explain the differences in distribution assessed in terms of income and productivity (Crow et al., 2009). But the data is very consensual in showing that the rule is the increase of the income inequality within country (UNPD, 2010).
4
6
2.3.1 Traditional Causes
However there are some aspects with bigger incidence in countries with bigger inequality and that are often used to explain higher levels of inequality, the so-called “traditional causes of inequality” that are land concentration, urban bias, abundance of natural resources and inequality in education (Cornia and Court, 2001; Heshmati, 2005).
Land concentration inequality stands for the differences in the bequest of land (Carter, 2000). Land concentration is a source of inequality (Li at al., 1998) and it is particularly important to explain disparities in developing countries where the agricultural sector is more relevant rather than in developed countries where the industrial sector replaced the previous importance of the agricultural sector (Cornia and Court, 2001). Although there is a decrease in the weight of inequality due to agricultural structure, it is not possible to consider it irrelevant to the current tendencies of inequality. Due to the exclusionary agricultural growth5 in some countries, there is an increase in the allocation of the unequal incomes proceeding from the agriculture. But besides that, there is also an indirect effect in inequality caused from the land ownership that has to do with the impact that it has, in an imperfect financial markets scenario, on the accumulation of human capital that will later, lead to a rise in inequality (Carter, 2000).
Based on the available data, there is a worrying stability or even an increase of the inequality among the rural and the urban population within developing countries (Cornia and Court, 2001), where the majority of the low income population lives in the rural areas with agriculture as their main source of subsistence (Eastwood and Lipton, 2000). De Haan and Lipton (2000) emphasizes other problematic that are associated with the rural surroundings such as rural inhabitants have lower incomes because the tendency is that they have higher rates of children per adult, living isolated, working in professions with lack of productivity and in a significant part of the countries, high rates of female population. Eastwood and Lipton (2000) presented the possibility of the “offsetting trends in inequality” where in one hand, the recent price liberalization should correct price distortions and it would lead to a reduction in the rural-urban bias, while on the other hand, the best access to education, higher income, less parallel economy in urban areas among other have a rising effect in inequality would offset. This hypothesis was rejected by the author because there is not a general and clear tendency and in some parts of countries do these not happen to offset.
5
It is a term that describes the “growth process in which small-scale agricultural producers are displaced and the successor farm units respond to a different set of shadow factor prices such that the sector itself becomes labour-displacing” (Carter, 2000).
7 In what concerns the resources, there is a connection between the type of products exported and inequality. Calderón and Chong (2001) found that those countries with exportation of primary goods, such as developing countries, have an augment in inequality, while countries that export manufactured goods, such as developed countries, they have a fallen inequality. But a relevant point is the future results in countries with high increases in commodities, where the “conditional resource course” is an expression used to describe the fact that, the impact of having such commodities is always benefic in the short run, but the impact in the long run is reliant on the kind of commodity and also in the capacity of governance of each country. If the commodities are not from agriculture and the governance is poor, the long run effects on output are so unfavorable that they will tend to offset the initial increase on income (Collier and Goderis, 2007).
An increase of the average years of education (mainly secondary education and in the female population) will diminish inequality (Cornia and Court, 2001) since different access to education has differences in income as a consequence in the majority of countries. (López et al., 1998). This is explained by the fact that there is a substantial boost in the income of the population that finished the secondary school which is more frequent in already high income households (because in lower income households the cost of having the children studying instead of working to help the family is too high which also explains the higher abandon rates from school in poor households), but more than that, the returns of education are higher in richer households (that can be explained by worse access to education, inferior quality of the education, nutrition levels, etc… ) (Lopez and Perry, 2007). According to Castelló and Doménech (2002) education matter in terms of development and a fair distribution of education has impact more than in the stock of human capital and life expectancy, in the growth rates, income and physical capital.
2.3.2 New Causes of Inequality
Although “traditional causes” of inequality help explaining inequality, some authors defend that they do not explain the aggravation of the inequality and that are “new causes” that actually explain it (Cornia and Court, 2001; Heshmati, 2005).
Alter the relative prices of goods inside a certain economy is the aim of the liberalizations. But in order to access the repercussion that it will have in households it is necessary to look not only to the side of the income but also the impact in consumption. Because it is possible that the product of a certain household depends on as a source of income may be depreciated, then they are relatively poorer than initially, but the result will be positive or negative
8 depending on the way that it will impact on the products that compose the consumption basket, if the price of those products also fall, then they may be ending in a more favorable position that the one they started (Lopez and Perry, 2007).
Fiscal policy also takes an important role in what is concerned to income inequality because a different starting point in terms of assets does not have to mean a substantial difference regarding income inequality, except if it taxes do not have an effective role in rectifying those differences (Lopez and Perry, 2007).
One of the reasons that have been pointed as a cause in the increase in inequality is a trend on the increase of the capital share in income in detriment of the labor share. This has been associated with financial liberalization and stabilization packages6 in developing countries. But not only had the change on weight of the capital versus the labor share income impacted on inequality. Also the gap among the minimum wages and the highest wages accelerated. It was not only caused by demand and supply effects, and returns on education but also by the deregulation on the labor market (Cornia and Court, 2001).
The political system in power in a certain country may also affect the trends in inequality. Barro (2000) argues that in systems similar to democracy where the power is equally distributed inside a certain society and the economic power influence inequality due to the redistributive impacts. Beer and Boswell (2002) mention the reliance on foreign investment as a cause of inequality for being more beneficial to the richer than to the rest of the population. Political freedom also has a role in inequality due to the unequal distribution that happens in cases where the richer are able to be in charge of economic policies ensuring that they do not lose wealth limiting the access of poor to capital (Li et al., 1998). Globalization is also mentioned as one of the possible causes of worsening inequality (although it improves the well-being of the population) (Birdsall, 2000: Manasse and Turrini (2001). But this idea is not consensual, Lindert and Williamson (2001) suggest that it has nothing to do with inequality, and that non democracy and poor governance are the factors that really influence inequality. Inflation also as effects in income inequality because it contributes to increase the returns of the rich population (Li and Zou, 2002).
Alderson & Nielsen (2002) performed a broad study in understanding the impact of an extensive number of variables on inequality. The findings are that the factors that affect
6
Stabilization packs are commonly associated with more inequality and economic recession. This is mainly attributed to the fact that wages, mainly the not qualified ones, decreases at a higher rate than GDP. But at the recuperation period, the increase in wages tends to be less than the previous fall during the recession (Cornia and Court, 2001).
9 negatively and lead to lower inequalities are the coordination of the wage definition, “de-commodification”7 and the number of workers in unions (also referred by Cornia and Court, 2001). The factors that affect positively are direct investment outflow, rate of female workers, exportation from south countries to north countries affection the returns of unskilled workers, rate of workers on agricultural products and migration flows.
2.4 Sources of Inequality by Geographic Area
The geographical location that faces a remarkable increase in inequality is the former Soviet Union, in some cases, increasing 10 Gini points (Cornia and Court, 2001; UNPD, 2010). Nevertheless, the values for the Gini coefficient remain comparatively low due to the starting point for the Gini coefficient resultant of the high rate of employed people pertaining to the state institutions (90% compared with the 20% in the OECD countries) (UNPD, 2010). In Sub-Saharan Africa, the values of inequality have been showing a decrease in the last two decades, at the same time that there is also an improvement in the economic performance, opposite to what happened in the 1980s where the economy was deteriorating and the values of inequality increased, but there are parts of Africa witnessing an increase in inequality (Cornia and Court, 2001; UNPD, 2010). The majority of countries in the East Asia and the Pacific also register an increase in inequality. This is a consequence of the increasing difference between the urban and rural areas due to the industrial growth, while agriculture is slowing down and the disparity between high and low schooling payments is increasing. In this region, the tendency leans to lower values of inequality in countries with previous central economies (Cornia and Court, 2001; UNPD, 2010). The reasons that are often noted as causes of the traditional high income disparity in Latin America and the Caribbean are the decrease in public expenditure, a high gap in the payments among the high and low skilled workers, imbalanced access to education and distribution of land and elevated fertility in low income households (UNPD, 2010).
7
Term used to describe the attempt to reduce the individuals’ dependence on the market for their welfare.
10
2.5 Consequences of Inequality
Poverty and income inequality seem to be different issues however they have connections. In cases where the inequality is very high a situation where is more probable that a part of the population live under the poverty line is created (Reynolds, 1996) meaning that for a certain amount of average income per capita, countries in which the inequality is higher have consequently higher poverty. According to Lopez and Perry, (2007), if Latin America had the same values for inequality as Europe has, than the number of people living below the poverty line of 2$PPP per person would decrease from the actual 25 percentage points to 12 percent8. Higher inequality not only leads to higher levels of poverty but it makes harder to reduce that poverty, several authors looked into that relation (Ravallion, 2004; Perry et al, 2006; Cornia and Court, 2001) and found that growth elasticity of poverty reduction is higher in countries with lower disparities in income. Ravallion (2004) quantified that elasticity and countries with low income inequality have values of -4.3 while countries with very high inequalities have a value of -0.6.
Another consequence of having high levels of inequality relates with the fact that countries with higher rates of poverty and inequality are likely to have lower rates of growth (Alesina and Rodrick 1994; Perry et al, 2006). Barro (2000) defends that higher levels of inequality have a negative impact on growth in poor locations and positive impact in rich locations. And there are also authors that argue that higher levels on inequality lead to higher rates of growth (Li and Zou, 1998; Forbes 2000) but those studies tend to be focused only in short term relationship of the two variables.
There is also a relationship among income inequality and criminality. Fajnzylber et al. (1998) and Cramer (2001) indicate that the relationship is positive because the increase in inequality is an important factor in the increase of the levels of violence and crime (they estimate a rise between 1 and 4 percent in crime for an increase of 1 percent in the Gini coefficient. Neumayer (2011) also point the increase of violent crime as a consequence of higher income inequality. But Cramer (2001) state that although there is a link between inequality and violence and social conflict it does not imply directly a connection with civil war. But there are consequences of inequality that have impacts on economic growth, at a macro level by reducing the economic growth (Alessina and Perotti, 1996).
11 As seen before, higher inequality leads to higher levels of poverty which has a negative impact in school enrolments. According to Lopez and Perry (2007), an increase of 1 percentage point in the rate of poverty turn into a reduction from 0.5 to 1.5 percent in the enrollment rates in secondary schooling.
Alesina and Rodrick (1994) argue that along with higher inequality, the voters may tend to chose for more redistributive policies creating negative impacts on growth and uncertainty.
Nevertheless, high inequality itself does not have to be a negative thing when in a certain environment. For instance if there is inequality but also equality in the access to opportunities, it may create the right incentives for people to endeavor and to develop new ideas. All of this leads to better rates of growth. But when the environment is not favorable, for instance, existence of high barriers to social ascension, than there are not incentives to risk and to put effort in work (Lopez and Perry, 2007).
2.6 Theories of Economic Growth
2.6.1 Solow’s Growth Model
The framework developed by Solow (1956) suggests that income increases with the level of capital, physical and human, however those increases are limited. Specialized workers impact income generation as any other productive factor and technological development is independent (exogenous variable). The illation is that in the long run, the economic rate of growth is equal to the rate of growth of the labor in addition to the rate of technological progress established exogenously9. The consequence of the model is that the differences in the growth rates between countries are a result of the different levels on the direction of convergence. Accordingly, developed countries have lower growth rates than developing countries, and the income of both converges in the long run.
2.6.2 Endogenous Growth Models with Innovation
The endogenous models aroused from the necessity of including the technological progress in the economic process of growth. Schumpeter (1950) and Schmookler (1966) present the idea that technological progress is a consequence of innovators seeking sources of profit and not only by curiosity. Each new product raises the stock of human capital in that economy, it is a
12 cumulative process. Lucas (1988) finds that the process of technological development is also faster in countries with more knowledge because there is a learning curve in production. According to this model, the countries’ growth rates are not related with their incomes but with the amount of human capital. So, different from the Solow’s model, in the endogenous models the growth will be faster in countries with higher stock of capital (that are the ones that facilitate the access to education).
2.6.3 The Convergence Hypothesis
Both models previously presented point in different directions in their predictions. Solow predicts a convergence while the endogenous models accept that it is possible to have a gap due to difference in stock of capital. Summers and Heston (1991) presented data based on the computation of income at PPP of the nations and the results seem to corroborate the Solow’s predictions. But when using the same data and doing different calculus, relating the incomes with growth rates the results follow the predictions of economic endogenous growth theories.
2.7 The Determinants of Economic Growth
Several authors indicate that having a population with higher education is essential to economic growth (Barro; 1991: Gould and Ruffin, 1993). And it leads to growth through two different channels: in on hand it increases the capacity of production of the country, on the other hand it leads to technological innovation due to the accumulativeness of technological development. Barro (1991) estimated that Guatemala’s rate of growth could have raised about 1.3 percentage points per year if they have increased the enrollment on secondary schooling in 50 percent between the years of 1960 to 1985.
The role of government also influences the growth of a country. An increase in government expenditures other than education and defense will diminish growth and government investment has a neutral impact on growth rates (Barro ,1989; 1990: 1991).
Another factor that may hinder economic growth is political instability such as revolutions or assassinations of politicians reduce the rate of growth. For instance, El Salvador could have grown an extra 7 percent per year if it was not the political instability in the country (Barro, 1991).
13 One additional important topic, and very consensual among different authors, is the openness of the market. De Long and Summers (1991) estimate that countries that are very protective, have productivity growth of 1.1 percent lower than the countries that are not so protective. That is consistent with Ben-David (1991) that found that countries that joined European Union and let fall the barriers, became closer to the richer nations. The cost of changing from an open economy to a closed one can be a lost in 2.5 percent per year Roubini and Sala-i-Martin (1991).
De Long and Summers (1991) defend that investing in equipment and machinery also impacts growth positively because it will increase the technological progress. Keeping everything constant, they calculated that an increase in 1 percent of the output invested in machinery and equipment, are translated on an increase in 0.26 percent increase in the growth rate.
14
3. Methodology
The overall objective of this analysis is to try to verify the hypothesis that economic growth does not mean necessarily a reduction in the gap among the richest people and the poorest people within a country. Often, the external help for developing countries has a huge focus on helping those countries regarding the economic factors (Heshmati, 2005). The logic behind it is that, if the country is growing economically, it should be directly connected with progress of the life conditions of the population and inequality is seen as factor that remains constant over time. So, helping the countries to better perform economically would be a leverage to ensure a better quality of life of the population in general.
As a matter of fact, in the United Nations Millennium Declaration (2000) where they claim “to reaffirm our faith in the Organization and its Charter as indispensable foundations of a more peaceful, prosperous and just world”, eight goals were defined in order to “uphold the principles of human dignity, equality and equity at the global level”. Those goals are: eradicate extreme poverty and hunger, achieve universal primary education, promote gender equality and empower women, reduce child mortality rates, improve maternal health, combat HIV/AIDS, malaria, and other diseases, ensure environmental sustainability and develop a global partnership for development. Although, almost all of them require some economic investment in order to be reached, none of them has exclusively an economic dimension by implementing, for instance, economic growth goals.
Is it happening because economic growth is indeed possible to neglect when fostering equality and the improvement of population live conditions? Is it counterproductive?
3.1 Data
In order to verify if exists a relationship or not between inequality and economic growth, it will be performed the calculation of Pearson´s correlation coefficient in a group of countries to have results, see the trends and better understand the relation. The factors that are meant to be explained are inequality and economic growth, therefore it will be used data that allow to translate into numbers what is happening in the reality. The two indicators chosen as the source of data to perform this analysis are the Gini coefficient to represent the inequality and GDP at purchases prices corresponding to the economic growth, where:
15 Gini coefficient, using World’s Bank definition, “measures the extent to which the distribution of income (or, in some cases, consumption expenditure) among individuals or households within an economy deviates from a perfectly equal distribution. A Lorenz curve plots the cumulative percentages of total income received against the cumulative number of recipients, starting with the poorest individual or household. The Gini coefficient measures the area between the Lorenz curve and a hypothetical line of absolute equality, expressed as a percentage of the maximum area under the line. Thus a Gini index of 0 represents perfect equality, while an index of 100 implies perfect inequality”.
And GDP at purchaser's prices that, accordingly to the World Bank, is “the sum of gross value added by all resident producers in the economy plus any product taxes and minus any subsidies not included in the value of the products. It is calculated without making deductions for depreciation of fabricated assets or for depletion and degradation of natural resources. Data are in current U.S. dollars. Dollar figures for GDP are converted from domestic currencies using single year official exchange rates. For a few countries where the official exchange rate does not reflect the rate effectively applied to actual foreign exchange transactions, an alternative conversion factor is used”. It is important to use purchase’s price in order to convert the currency in international dollars for better comparability.
According to this, the focus will be to study the relationship among the economic growth measured by the GDP and the promotion of equality within a society, measured by the Gini Index. Then it will be possible to understand if the increase of the GDP is positively related with the increase of the Gini index. If this is proven to be true, then it is possible to conclude that although some countries are having good performances regarding the economic growth, such performances are not translated equally in the improvement of the life conditions in general, and the gap among the richest part of the population and the poorest is getting bigger.
3.2 Correlation
The calculus used to understand the relationship of the two indicators is the correlation. The most common used to measure the correlation is Pearson’s correlation coefficient. It is often represented the ρ and measures the linear dependency among two variables and is given by the result of the covariance of the two variables divided by the product of the standard deviation of each variable.
16 As the analysis will be performed based on a sample and not over the entire universe, the value for the correlation for the sample is given by r and is formulated in the following way (Croux and Dehon, 2008):
given that x bar and y bar are the mean of the sample.
The results of the correlation coefficient can vary from -1 to +1 (both inclusive) (Egghe and Leydesdorff, 2009). The result +1 means that the correlation is a pefect positive linear correlation, on the other hand, when the value is -1, then it is a perfect negative linear correlation. Regarding the value in the interval, the general rule that is usually used (although these values are not completely strict and the evaluation may change regarding the context) is that when the 0 ≤ |r| ≤0,20, the correlation is considered “non-important”, and the strength of the correlation increases as the absolute value of the ρ became closer to 1 (Kozak, 2009).
3.3 Scope of Analysis
This analysis would be valid and relevant for all the countries in the world. However, for the purpose of this study it would be too extensive. So, the focus to perform this analysis will be Latin America. The reason why Latin America seemed an interesting case to compute an analysis regarding inequality has to do with the fact that among the top three countries with highest inequality in the world are Chile and Mexico (OECD, 2011)10 which indicate a incidence of inequality on that geographical area.
The group of countries that is considered to belong to the Latin America is not always consensual and the definition itself of which countries should be included has been changing in time. For the sake of this analysis, it will be taken in consideration the first definition where Latin American countries refer only to the ones that are Portuguese- or Spanish-speaking countries (Colburn, 2002). Accordingly, the list of countries that is considered to constitute
17 Latin America are: Argentina, Bolivia (Plurinational State of), Brazil, Chile, Colombia, Costa Rica, Cuba, Dominican Republic, Ecuador, El Salvador, Guatemala, Honduras, Mexico, Nicaragua, Panama, Paraguay, Peru, Puerto Rico, Uruguay and Venezuela (Bolivarian Republic of).
3.4 Countries Exclusion
From the list of countries that belongs to Latin America, not all of them had enough quantity of data available regarding the Gini Index that would allow doing a robust analysis of the correlation among the two variables. To proceed with the study, those countries that did not present sufficient data were excluded from the analysis. The exclusion criteria were that the country should have at least ten observations and to have Gini observations at least in two different decades.
The first criteria regarding the minimum number of ten observations has the goal of guaranty that the sample is representative, and as the study has a period of five decades, this minimum number ensures that all the countries in analysis have a sample of minimum of twenty per cent of the range of years that is being analyzed.
The restriction regarding the two decades has to do with the fact that a relevant part of the analysis holds on the temporal evolution of the two indicators that are being used, and with the objective of analyze it, it is necessary to have at least two points to be possible to compare and see the evolution.
According to those criteria, the excluded countries are Cuba, Nicaragua, Guatemala and Puerto Rico.
3.5 GDP and Gini Index Correlation
After excluding the countries that did not had enough data to calculate a solid correlation value, it was combined the Gini Index observations from the different sources (Appendix 1) in the same table and, from this point on in the analysis they are all used together as one regardless of the source.
As the distribution of the observations does not follow any temporal pattern due to the lack of observations in some years, it was calculated a simple average of observations for each decade
18 bringing all the observations for the same point in time (Appendix 2). This way, it will become more straightforward to judge because it they are similar and possible to compare among countries.
In order to be possible to do the correlation, the same procedure of averaging each decade t the GDP was applied in order to also have the values in decades.
And the results for the correlation between the Gini Index and the GDP are:
Table 2. Gini index and GDP correlation
r
Argentina 0,910611772 Bolivia 0,963224568 Brazil 0,077878811 Chile 0,559068242 Colombia 0,836737329 Costa Rica 0,044469548 Dominican Republic 0,641452188 Ecuador 0,033478997 El Salvador 0,483084813 Honduras -0,631472395 Mexico -0,139162219 Panama 0,801865194 Paraguay 0,971767232 Peru -0,498607778 Uruguay 0,989157557 Venezuela 0,381426722By looking at the values of the correlations, is possible to see that thirteen out of the sixteen countries present a positive value for the correlation and only three of them present a negative value.
However, the strength of those correlations may be different and it can be accessed by the value of the Pearson’s correlation. It is possible to see that the number that presents strong positive correlations reduces to ten countries. Those countries are Argentina, Bolivia, Chili, Colombia, Dominican Republic, El Salvador, Panama, Paraguay, Uruguay and Venezuela. The
19 group of countries that show a “non-important” but still positive correlation is Brazil, Costa Rica and Ecuador and the only one with a “non-important” negative correlation is Mexico. On the other hand, the countries with a relevant negative correlation are Honduras and Peru.
3.6 Variables with Different Scales
Although these results seem to be very interesting in proving the initial hypothesis and showing that the economic growth also means the increase in inequality, it is important to bear in mind that when we are evaluating two variables in terms of correlation, if both values are presented in different units of measure, we might have a problem of scale. Computing correlation of two different variables with very different scales, will influence the results by giving more weight to the biggest variable and influencing the results towards it.
This means that these results might be biased and influenced by the problem of scale. So, in order to solve that, it implied a change of variable to the “Annual percentage growth rate of GDP at market prices based on constant local currency. Aggregates are based on constant 2000 U.S. dollars. GDP is the sum of gross value added by all resident producers in the economy plus any product taxes and minus any subsidies not included in the value of the products. It is calculated without making deductions for depreciation of fabricated assets or for depletion and degradation of natural resources.”
3.7 Annual Percentage Growth and Gini Index Correlation
By changing the variable GDP to this new variable, the problem of scale is mitigated because now the comparison is done among an Index and a percentage and both have approximately the same scale.
Similar to the previous calculation of the correlation, using the raw data (in Appendix 5) we calculated the average of the Annual percentage growth of the GDP (in Appendix 6).
The results of the new correlation among the percentage annual growth rate of the GDP are the following:
20 Table 3. Gini index and GDP growth rate correlation
r
Argentina 0,151808764 Bolivia 0,242743747 Brazil -0,061402795 Chile 0,426454294 Colombia -0,709496292 Costa Rica 0,652391737 Dominican Republic -0,800678021 Ecuador 0,783106332 El Salvador 0,109308978 Honduras 0,655609854 Mexico 0,264841017 Panama -0,386897759 Paraguay -0,583254798 Peru 0,00841896 Uruguay 0,578421647 Venezuela -0,618286236Looking at the results, it is possible to see that ten countries out of the sixteen have a positive value on the correlation.
But once more, analyzing the strength of the correlations, there are seven countries with relevant positive correlation, that are Bolivia, Chile, Costa Rica, Ecuador, Honduras, Mexico and Uruguay. The countries with a negative correlation are Colombia, Dominican Republic, Panama, Paraguay and Venezuela. And finally, there are four countries with non-relevant correlation that are Argentina, Brazil, El Salvador and Peru.
It is possible to see that the new calculus affected the results because some countries changed from positive to negative results and the other way around. The most significant change was Paraguay that went from a correlation of 0,972 to a -0,583. An interesting fact that arise from the comparison with the Table 2, is that the countries who present positive values for the correlation, even when they are relevant, they never reach such extreme values such as 0,989 in Uruguay in Table 2. But when it comes to the negative correlation, it changes; there are bigger values in absolute terms regarding the negative values in Table 3 than in Table 2.
21
4. Discussion of the Results
The aim of this study was to understand the correlation between the economic growth and the income inequality with a focus of analysis in Latin American countries. In Section II several relations between inequality and economic growth were presented, some more direct than others and some with opposite relationship but all point to a relation between the two concepts. When analyzing the correlation between percentage of GDP growth and Gini index using data, the results were not conclusive enough to determine the direction of the relation among the two variables due to the diversity of results. So, in this section, we will have a more integrated approach in order to understand the meaning of the results observed in the previous section.
The result for correlations that is more frequent in this group of countries is the positive correlation. So, it is possible to argue that the most likely correlation is that when there is an increase in the GDP then inequality will also increase.
But this let some questions open, for instance, is the part of population with higher income receiving even more income, or the people on the bottom getting even poorer?
A way to have an overall feeling of what is happening is by looking at GNI per capita using the Atlas Method11 values. If the values are increasing, in countries with positive correlations, then it is possible to assume that the population in general is getting more income, so there is an increase in the gap because of a poor distribution of the income.
11
“GNI per capita (formerly GNP per capita) is the gross national income, converted to U.S. dollars using the World Bank Atlas method, divided by the midyear population. GNI is the sum of value added by all resident producers plus any product taxes (less subsidies) not included in the valuation of output plus net receipts of primary income (compensation of employees and property income) from abroad. GNI, calculated in national currency, is usually converted to U.S. dollars at official exchange rates for comparisons across economies, although an alternative rate is used when the official exchange rate is judged to diverge by an exceptionally large margin from the rate actually applied in international transactions. To smooth fluctuations in prices and exchange rates, a special Atlas method of conversion is used by the World Bank. This applies a conversion factor that averages the exchange rate for a given year and the two preceding years, adjusted for differences in rates of inflation between the country, and through 2000, the G-5 countries (France, Germany, Japan, the United Kingdom, and the United States). From 2001, these countries include the Euro area, Japan, the United Kingdom, and the United States” according to the World Bank
22 Table 4. GNI per capita- Atlas Method (in current U.S. dollars)
1990
2000
2010
Bolivia 740 1000 1810 Chile 2250 4840 10120 Costa Rica 2340 3710 6810 Ecuador 900 1330 3850 Honduras 700 940 1870 Mexico 2790 5010 8890 Uruguay 2840 7100 10590Source: World Bank
According to Table 4, as the GNI per capita is growing while the inequality is also growing, this means that a bigger share of this increase in the GNI per capita is going to the part of the population that has higher incomes rather than to the population that has lower incomes.
The same approach is also possible to apply to negative correlations. In this case, the negative correlation does not allow an understanding, for instance, if the population with higher income is receiving less income, or the people in the bottom is receiving more.
Table 5. GNI per capita- Atlas Method (in current U.S. dollars)
1990
2000
2010
Colombia 1260 2350 5510 Dominican Rep. 870 2620 5030 Panama 2210 3730 6970 Paraguay 1190 1350 2710 Venezuela 2570 4100 11590Source: World Bank
Similarly to the group of countries with positive correlation, also in this group of countries there is an increase in the GNI (Table 5). So, if the correlations are negative, then it is plausible to assume that the income is being distributed more evenly in these countries.
23 This is not a perfect approach, ideally we would calculate the distribution of income in quintiles or fractiles of the distribution for the population in order to give the way that income is being distributed in the society, but, for lack of available data, the GNI per capita allows excluding some possibilities.
But just because there is a higher frequency of positive correlations, it is precipitated to jump to such conclusions taking into consideration the results for the correlations, it is observable the diversity of results of the correlations, not only because there are positive, negative and non-relevant correlations, but in the way that the countries are split in a very balanced way among those categories. As a result it is not possible to say that there is a clear and undeniable trend toward one direction of results. The small size of the sample itself and the complexity of other factors for instance, geographical environment, political environment, among others, limits in some extent not only the extrapolation of the results but a broader analysis too.
So, what are the differences among these countries that make them have different results for the correlation? Why are some reducing in an effective way the inequality and not the others?
According to UNDP (2010), the main causes of inequality in Latin America are decreases in public expenditure, imbalanced access to education and distribution of land, a high gap in the payments among the high and low skilled workers, and elevated fertility in low-income households.
In order to verify if these factors help in explaining a bit more the reason why some countries are able to tackle the problematic of inequality, we will use two countries to understand what is happening in those factors. The countries chosen were Ecuador (correlation of 0.7831) and Dominican Republic (a value of -0.8) because they are the ones with more extreme values regarding inequality either positive or negative correlation (although Dominican Republic is part of the Caribbean and Central America region, according to the definition used in this study to classify the countries that belong to Latin America, it is included, and it makes sense due to the similitude to those countries and the historical common factors).
These two countries have similarities. Ecuador has population of 15,007,343 people (CIA, 2012a) and Dominican Republic has 9,956,648 people (CIA, 2012b) and they are very similar in the structure of population by age, percentage of urban population, fertility rates, etc. Exportations have an important role in both of their economies, in Ecuador petroleum is the main exported product while in Dominican Republic are related with agriculture but the
24 services sector is now bigger that agriculture. However it is important to mention that Ecuador faced an economic crisis during the years of 1999 and 2000.
In order to assess education, the indicator used is the literacy rate on the adult total (in % of people ages 15 and above)12. And in this indicator the performance of both countries was different. If in one hand we have Ecuador that had a literacy rate of 84% in 1982 and still have the same value of 84% of literacy rate in 2009, on the other hand, Dominican Republic evolved from 73% literacy rate in 1981 to 88% in 2007 (World Bank). Accordingly, the country that had a negative correlation (Dominican Republic) is the one that managed to evolve in a favorable way in this indicator.
In what concerns with public expenditure, there are two important categories that are health and education. Regarding the public health expenditure, the public health expenditure was calculated, per capita (current US$) in Appendix 7 through the multiplication of Health expenditure, public (% of total health expenditure13) by Health expenditure per capita (current US$)14. The results show that in 1995 Ecuador invest almost the double comparing to Dominican Republic (40 opposed to only 22 US$) while in 2009 there is a convergence of those values (124 and 112 US$). The indicator public spending on education, total (% of GDP)15 has the objective of quantify the public expenditure in education. In this case Ecuador had a value of 2.64 in the year of 1998, a value of 1.32 in 2000 and a value of 0.98 in 2001. Dominican Republic had a value of 1.91 in 2000, decreased in to 1.88 in 2003 and has a value of 2.3 in 2009 (World Bank). Also in this case, Dominican Republic had a better improvement in the indicators.
12
“Adult literacy rate is the percentage of people ages 15 and above who can, with understanding, read and write a short, simple statement on their everyday life” according to World Bank’s definition.
13
“Public health expenditure consists of recurrent and capital spending from government (central and local) budgets, external borrowings and grants (including donations from international agencies and nongovernmental organizations), and social (or compulsory) health insurance funds. Total health expenditure is the sum of public and private health expenditure. It covers the provision of health services (preventive and curative), family planning activities, nutrition activities, and emergency aid designated for health but does not include provision of water and sanitation” by World Bank
14
“Total health expenditure is the sum of public and private health expenditures as a ratio of total population. It covers the provision of health services (preventive and curative), family planning activities, nutrition activities, and emergency aid designated for health but does not include provision of water and sanitation. Data are in current U.S. dollars” use by World Bank
15
“Public expenditure on education consists of current and capital public expenditure on education includes government spending on educational institutions (both public and private), education administration as well as subsidies for private entities (students/households and other privates entities)” by World Bank.
25 The other factors that are considered relevant in order to explain inequality that are fertility in low income households, high gap in the payments among the high and low skilled workers and land distribution it would be very interesting to see if would also help explain the different performance of both countries, however the lack of data available did not allow to make such conclusions.
Therefore, for the indicators that were possible to collect data for the most important factors influencing inequality in this geographic area, it is visible that the country that manages to have a reduction of inequality along with an economic growth (negative correlation) happens to have performed better in the indicators above studied.
Accordingly, the leading approach used by governments worldwide and by International Financial Institutions that has a focus on pushing the economic growth, not taking inequality issues into consideration and following the idea that is that inequality is stable overtime inside a society (Cornia and Court, 2001) seem to be a too simple approach to this problem. It is possible to say that more important than create economic growth to improve equality, is how those means are used, in favor of the population or not.
4.1 Limitations
The first limitation that influenced this study of inequality has to do with the definition of what inequality really is and what it represents. There is not one universal and consensual definition for it so, for the sake of the analysis, it was only focused on the inequality that is created with the different distribution of income inside a certain society. However this is just a narrow approach of the bigger picture and it only captures a part of the inequalities and not the global picture regarding the life conditions of the individuals. So, this is a limitation in the sense that it is only capturing a part of a much bigger concept that is inequality.
Other points that also have some flaws are the indicators that were used. On one hand, the GDP Purchasing Power Parity uses the relative price level of each country to convert into an international measure, it has the advantage that it facilitates the comparison among different currencies but it does not take into account that the exchange rates are not the same in different regions even when inside the same country. Concerning the Gini coefficient, it is possible to argue that it gives an incomplete measure of the income inequality by not taking into consideration the difference in aspects such as opportunities or even risk aversion.
26 A factor that can influence the results is the data itself. The fact that the data available is limited can condition somehow the conclusions, the Gini index is only measured yearly (at least the public data that is possible to be collected) and it is a relatively recent measure which limits the availability of data. With the aim of solving, or at least to lessen the problem of a reduced amount of data, it was used data from different sources in this analysis. This is not the ideal situation because data collected from different sources may influence the global congruence of the results if there are some differences in the way that the Gini index is measured by each source.
This study also faces the limitation of extrapolate this results for other groups of countries. The output of this study is dependent on the data that is extremely influenced by very specific external factors. Using the conclusion of the study different environments with different influence factors without adaptations may lead to less correct outcomes.
On top of all of these points, it is also important to keep in mind that this analysis does not hold the condition ceteris paribus, meaning that the data may be influenced by external factors for this analysis. This is particularly relevant regarding the conclusions and when establishing relationships of cause and effect among the variables.
4.2 Future Research
This field of studies is important because it brings very important insights in such an important matter that is, in the limit, the life condition of the individuals. And by being such a complex issue, it opens a myriad of possibilities in future research.
The first potential of future research is to overcome the points that could be improved that were mentioned in the limitations and doing it creates several possibilities. One way is to increase the database that was used in this study to make it more robust. Another possibility is the creation of some other new indicator that could be better and more comprehensive than Gini Index in capturing the bigger reality that is inequality, not only in what income inequality is, but also in a broader sense of the concept of inequality.
The same study can also be replicated in other groups of countries and it will still be valid and interesting and also it would be interesting to include the relationship of other variables in this study. This seems to be a very demanding but important and fruitful field of studies.
27 A last proposal of research that might extend the knowledge in the study of the relationship among the economic growth and inequality would be to reproduce the same study but using the GDP with and without external aid. It would give the perception on how the external aid influences the relationship among the economic growth and inequality.
28
5. Conclusion
Inequality issues are now backing in the international institutions’ agenda. This is happening after a period of economic growth that was used in developing countries as the primordial path to try to converge with developed countries. But the results were not compatible with that growth and the increases in the number of poor people made realize that maybe it was not the solution for the problem (Beer and Boswell, 2002).
Accordingly, there are some sources of apprehension that derive from the results regarding the correlation between economic growth measured based on the GDP with Gini Index where a substantial number of countries present positive correlations. This means that the gap between rich and poor is growing inside countries.
It is possible to understand in Section II of the thesis, inequality not only bad just by the fact that it exists and because it is an ethical or philosophical issue. It is a real problem of the people that are trapped in the bottom of the economy. Gini coefficient is not only an abstract figure, but a numerical representation of it and demands to be looked carefully. Also seen in Section II, the consequences of high levels of inequality are very noxious and can at some point became a vicious circle, that will later effect growth. The persistence of such correlations denote incapacity of internal governance or lack of willingness to change the paradigm and the persistence of international communities in promote economic growth in countries with high inequality may be extending the situation.
But there is some good news that brings hope and show that is possible to have a reduction of inequality during periods of economic growth. That happens because those countries use mechanisms that allow them, when there is economic growth, it is more evenly distributed, focusing in a growth but with equity. As previously mentioned in Section II, it brings a myriad of subsequent benefits.
The case of the two countries studied in more depth, Ecuador and Dominican Republic, it was possible to see that following different policies was crucial to influence the final output. Even though they are very similar in dimension and demographics, they differ completely in the result of correlation between growth and inequality.
Even though there are countries with worrying results, there are also good examples that open the possibility of a change in that relation. And change is possible by looking into the local factors that are influencing and creating inequalities, although there are general reasons of