A Work Project, presented as part of the requirements for the Award of a Master Degree in Finance from the
NOVA – School of Business and Economics.
Modest growth ahead
José Maria Parreira Jonet, 33941
Rita Silva Ataíde Ferreira Gomes, 29864
A Project carried out on the master’s in finance Program, under the supervision of:
Francisco Martins
Abstract
We conduct an analysis on Booking Holdings, Inc. and the Online Travel Market in which it operates
to understand the trends opportunities and risks driving the market. Following this analysis, we focus
on a Discounted Cash Flow model to derive a forecasted stock price for Booking Holdings, Inc. as of
December 2020.
Keywords: booking, accommodations, travel, priceline
This work used infrastructure and resources funded by Fundação para a Ciência e a Tecnologia
(UID/ECO/00124/2013, UID/ECO/00124/2019 and Social Sciences DataLab, Project 22209), POR
Lisboa (LISBOA-01-0145-FEDER-007722 and Social Sciences DataLab, Project 22209) and POR Norte
(Social Sciences DataLab, Project 22209).
MASTER IN FINANCE
THIS REPORT WAS PREPARED EXCLUSIVELY FOR ACADEMIC PURPOSES BY JOSÉ MARIA JONET AND RITA FERREIRA GOMES,MASTER IN FINANCE STUDENTS OF THE NOVA SCHOOL OF BUSINESS AND ECONOMICS.THE REPORT WAS SUPERVISED BY A NOVA SBE FACULTY MEMBER, ACTING IN A MERE ACADEMIC CAPACITY, WHO REVIEWED THE VALUATION METHODOLOGY AND THE FINANCIAL
MODEL.
(PLEASE REFER TO THE DISCLOSURES AND DISCLAIMERS AT END OF THE DOCUMENT)
Page 1/32
Modest growth ahead
In the search for room nights
Based on our FY20 target price $2,102.97, with total return of 7.6%, we issue a HOLD recommendation for BKNG. We expect share repurchases of $4.2 billion in 2020, accounting for 5.2% of total return.
BKNG’s room nights growth has slowed from 21.1% in 2017 to 10.9% in 2019, as the shift from offline to online bookings in Europe and the U.S. matures. The Group’s future performance is highly dependent on its ability to find new sources to derive room nights growth. Until 2026, we expect its room nights to grow at an 8.7% CAGR.
We believe BKNG has clear opportunities to boost room nights growth, through: 1) further expansion in China and Southeast Asia, driven by strategic partnerships, 2) winning the race to deliver innovative and differentiated products as the Connected Trip and 3) capturing a share of the emerging alternative accommodations market.
We see the Group’s future performance threatened by key risks in the market, particularly 1) the loss of direct channel traffic to Google Travel, resulting in higher performance marketing costs and lower margins, and 2) macroeconomic instability taking a negative toll on demand in the travel sector. Company description
Booking Holdings Inc. is a leading Online Travel Agency, connecting customers to travel service providers in over 230 countries and territories. The Group operates six primary brands: Booking.com, KAYAK, priceline.com, agoda, Rentalcars.com and OpenTable.
B
OOKING
H
OLDINGS
I
NC
.
C
OMPANY
R
EPORT
O
NLINE
T
RAVEL
M
ARKET
03
J
ANUARY2020
J
OSÉ
M
ARIA
J
ONET
,
R
ITA
F
ERREIRA
G
OMES
Recommendation: HOLD
Price Target FY20: 2,101.46 $
Price (as of 31-12-2019) 2,053.03 $
Reuters: Bloomberg: BKNG
52-week range (USD) 1,606.27 - 2,082.67
Market Cap (USD M) 85.9
Outstanding Shares (M) 41.86
(Values in USD millions) 2018 2019E 2020F
Revenues 14,527 15,041 16,895 Revenue growth 14.6% 3.5% 12.3% Performance MKT / Rev 30.61% 29.31% 28.95% EBITDA 5,767 5,742 5,742 NOPLAT 4,429 4,346 5,063 EPS ($) 45 109 126 P / E 21 19 17
Economic Profit / Rev 27.8% 26.0% 27.5% Source: Booking Holdings Annual Reports, analyst estimates
Figure 1: BKNG vs S&P500 share price; Source: Bloomberg
0 1000 2000 3000
Dec-14 Dec-15 Dec-16 Dec-17 Dec-18
P ric e ( $) BKNG S&P500
“BOOKING HOLDINGS” COMPANY REPORT PAGE 2/32
Table of Contents
COMPANY OVERVIEW ... 3
COMPANY DESCRIPTION ... 3 BUSINESS MODEL ... 4 A DYNAMIC OVERVIEW ... 5INDUSTRY OVERVIEW ...10
TRENDS ... 11 CHALLENGES ... 12 OPPORTUNITIES ... 14 COMPETITIVE LANDSCAPE ... 16VALUATION ...18
DCF APPROACH ... 18 WACC CALCULATION ... 19 MULTIPLES ANALYSIS ... 20 REVENUE MODEL ... 21 SCENARIO ANALYSIS ... 23 SENSITIVITY ANALYSIS ... 26APPENDIX ...28
REFERENCES ...29
“BOOKING HOLDINGS” COMPANY REPORT
PAGE 3/32
Company overview
Company description
Booking Holdings recognizes Booking.com, Rentalcars.com, agoda, priceline.com, KAYAK and OpenTable as its 6 primary brands, which manage a variety of other secondary subsidiaries. Before 2018, the name of the group was “Priceline Group”, named after its flagship brand at the time. In this report, we refer to Booking Holdings, Inc. as Booking Holdings, Booking, BKNG, the Group, the company and to the brand Booking.com as Booking.com.
Priceline.com became popular for its innovative “Name Your Own Price” option, which allowed consumers to bid on the price they wanted to pay for a product without previous knowledge of the name of the provider. Despite its success, Priceline gradually phased out this service. Today, the brand offers deals on hotel rooms, airline tickets, rental cars, vacation packages and cruises. The move into the retail hotel business was made by several acquisitions, most importantly ActiveHotels in 2004.
Booking.com grew from a small start-up to one of the largest travel e-commerce companies in the world, providing room nights, car rentals and airline tickets reservations. A little over 10 years after Booking.com was acquired by Priceline, the Group changed its name to Booking Holdings, in recognition of its main revenue source, Booking.com. The company generates approximately 76% of the group’s revenues every year.
Like booking.com, agoda is an online accommodation reservation service that operates mainly in the Asia-Pacific (APAC) region. It was acquired as a key strategic move into the Asian market.
Rentalcars.com, formerly known as TravelJigsaw, is a leading car hire booking service. It connects its customers to car hiring companies, enabling them to compare between agencies and choose the best price. As of 2018, Rentalcars.com integrated the business of Booking.com.
KAYAK is a leading online meta-search service that searches and compares rates for airline tickets, accommodation and rental cars from hundreds of travel websites at once. KAYAK operates 7 international brands: KAYAK, SWOODOO, checkfelix, momondo, Cheapflights, Mundi and HotelsCombined.
Finally, OpenTable is a restaurant reservations and information service. As a result of an internationalization strategy in the past years, it now has offices in the U.S., U.K., India, Australia and Mexico.
“BOOKING HOLDINGS” COMPANY REPORT
PAGE 4/32
Although OpenTable works quite independently, the remaining 5 main brands have their business highly interconnected. For instance, agoda and Booking provide flight comparison and car rental services on their websites that are operated de facto by KAYAK or priceline.com (flights search) and Rentalcars.com (car rentals). Furthermore, depending on its characteristics, a property listed on priceline.com or Booking.com can also be automatically listed on agoda and vice versa. This allows customers to keep using the website they are familiar with even in countries or regions where it has little or no representation.
Business model
Booking Holdings Inc., as a technological company operating in the travel services industry, has a rather complex revenue model that can be broken down into three main revenue streams: Agency revenues, Merchant revenues, and Advertising & Other revenues (Figure 2). The first two are mainly derived from Booking.com, agoda, priceline.com and Rentalcars.com, while Advertisement & Other revenues are earned through KAYAK and OpenTable.
Agency and Merchant revenues
Agency and Merchant revenues are mostly derived from the sale of room nights, rental car days and airline tickets to travellers, but (at a much smaller scale) also include the sale of travel packages, cruise tickets, tours, activities and airport taxis. Room nights sold is the most important driver for the company, accounting for 93.7% of the total Agency and Merchant revenues, and 86.5% of total revenues in 2019, according to our estimates. In the same year, our estimates point to the sale of 843 million room nights, 77 million rental car days and 7 million airline tickets, which lead to total Gross bookings1 of $97 billion (Figure 3). We estimate
2019’s average fee charged to be 14.3% for room nights, 25.0% for rental cars and 3.5% for rental car days2 (Figure 4).
Agency revenues are those where the Group does not receive payments directly from travellers, but rather from the travel service provider (accommodation owners, car rental companies, airlines), typically at the end of the month. Most of these revenues come from reservation commissions (on room nights, rental car days and airline tickets) and a small fraction is derived from ancillary fees, such as transaction fees and some travel insurance products.
In the Merchant model, travellers make payments directly to the Group, most commonly at the time of booking. Merchant revenues include the net transaction
1 Gross bookings is the annual sum of total bookings paid by the final customers in agency and merchant models. 2 Detailed information about estimation’s assumptions in Revenues Model Chapter.
Figure 2: Revenues streams as a % of total revenues; Source: Company reports, Analysts estimates
0% 25% 50% 75% 100% 2013 2015 2017 2019E
Advertisement & Others Merchant Model Agency Model 0% 10% 20% 30% 2015 2016 2017 2018 2019E Gross bookings Room nights
Figure 3: Gross bookings and Room nights; Source: Company reports, Analysts estimates 13% 14% 15% 16% 2015 2016 2017 2018 2019E
Figure 4: Accommodations' average fee charged; Source: Company reports, Analysts estimates
“BOOKING HOLDINGS” COMPANY REPORT
PAGE 5/32
revenues, ie the difference between the price charged to travellers and the amount the Group owes to travel service providers, as well as ancillary fees, credit card processing rebates and customer processing fees.
The Group is currently investing in having more properties operating under the Merchant Model (Figure 2). This comes as a response to customers’ increasing demand for different online payment options (Figure 5), which many property owners – particularly in the alternative accommodations market, with less resources available – do not have the ability to provide.
Advertising & Other revenues
The last stream of revenues, Advertising and Other revenues, is derived by KAYAK’s and OpenTable's websites. While KAYAK offers metasearch engines, which earn revenues by displaying advertisements or when customers purchase rooms, flights and car rentals through referrals, OpenTable collects revenues through restaurant reservations and subscription fees.
A dynamic overview
Revenues: BKNG’s revenues have grown at a double-digit rate from 2015 to 2018 (CAGR of 12.2%, Figure 6), mostly driven by growth in room nights. From 2016 onwards, room nights’ growth has decelerated (Figure 7) dragging revenues growth down.
However, in 2019E, although room nights grew 10.9%, revenues only grew 3.5%. This was due to a 3.4% estimated decrease in Average Daily Rates (ADR) for room nights (Figure 8). The steep drop, considering the diversity of geographies in which BKNG operates and the diversity of its brands, can be explained by: 1) higher business volume growth in countries with lower ADRs (Southeast Asia, China), and slower growth in countries with higher ADRs (Western Europe, U.S.); 2) a shift in demand towards alternative accommodations, which are typically cheaper; and 3) higher price competition pressures, which we attribute mostly to increasing popularity of metasearch price comparison tools (such as Google Travel)3.
Room nights: in the past few years, BKNG’s room nights growth was achieved mainly through organic expansion, although strategical acquisitions also played a role. The organic increase in the number of room nights was derived from two main factors: 1) increasing market share in countries where BKNG’s products were not fully established, namely Southeast Asia and China4 and 2) increasing market
demand for room nights in locations where Booking was already well established,
3 Detailed explanation further in Competitors chapter. 4 Read Opportunities Chapter for further detail.
Figure 5: Global eCom Payment Methods’ forecast; Source: Worldpay
Figure 6: BKNG's revenue and revenue's growth; Source: Company reports, Analysts estimates
Figure 8: Estimated Room nights Average Daily Rate (USD); Source: Analysts estimates 0% 5% 10% 15% 20% 0 5,000 10,000 15,000 20,000 20 15 20 16 20 17 20 18 20 19 E
Total Revenues YoY Growth
Figure 7: Driver's year-on-year growth; Source: Company reports, Analysts estimates -10% 0% 10% 20% 30% 2015 2016 2017 2018 2019E Room Nights
Rental car days Airline Tickets 0% 20% 40% 60% 80% 100% 2018 2019 2020 2022 eWallet Credit Card Others 106 109 112 115 20 14 20 15 20 16 20 17 20 18 20 19 E
“BOOKING HOLDINGS” COMPANY REPORT
PAGE 6/32
such as Europe (Figure 9). Regarding inorganic growth, the acquisition of HotelsCombined, in 2018 was the only acquisition in the past 5 years contributing to room nights growth. According to our estimates, HotelsCombined sold approximately 11 million room nights in 2017, accounting for 2% of BKNG’s 13% room nights growth in 2018.
Rental car days: following the same pattern as room nights, rental car days growth also decreased in the past three years (Figure 7). In 2019E, however, it is expected to grow 3.5%, as a consequence of the recent integration of Rentalcars.com with Booking.com. The strategical integration is part of a broader strategy to invest in the Connected Trip: a consumer experience with less frictions, allowing costumers to plan their whole trip online (flight, accommodation, car, experiences, airport taxis, etc)5.
Airline tickets: airline tickets followed a different path in the last years, with negative growth in 2016 and 2017 and a recovery in 2018 and 2019 (Figure 7). While we associate the slowdown to higher competition in the market, propelled by metasearch engines’ predominance (which favour a more balanced distribution of market shares), we consider the recovery in 2018 and 2019 might be a consequence of efforts related to the Connected Trip. However, it is hard to isolate the different factors weighing in on these results and reach an absolute conclusion. Cost Structure
The company’s largest costs are Performance marketing (29.3% as a percentage of revenues), Brand Marketing (3.6% as a percentage of revenues) and personnel-related costs (14.9% as a percentage of revenues). Nevertheless, BKNG’s EBITDA margin, at 38.2% in 2019E, is one of its most important competitive advantages (Table 1).
BKNG’s marketing costs can be separated into performance and brand marketing: performance marketing includes search engines’ keywords (Google AdWords) and metasearch referrals (Google Travel, SkyScanner, TripAdvisor), while brand marketing, as the name suggests, includes brand awareness campaigns on social media, TV and outdoor advertising. As a percentage of revenues, the latter has been increasing in the past years, while the former started decreasing in 2018. This decrease is part of the company’s strategy to be less dependent on indirect channels (Table 1), due to alleged lower return on investment in paid channels.
5 Read the Chapter Opportunities for further detail
Table 1: BKNG's cost structure; Source: Company reports, Analysts estimates
Figure 9: Number of nights spent in tourist accommodations in Europe (billion); Source: Eurostat [32]
2.5 2.7 2.9 3.1 3.3 3.5
“BOOKING HOLDINGS” COMPANY REPORT
PAGE 7/32
BKNG’s EBITDA margin is relatively high when compared to its peers (Figure 10), standing at 40% in 2018, while Expedia’s stood at 15% and Trip.com’s at 12%. Two competitive advantages of the Group justify these differences.
The first relates to the Group’s low dependence on marketing costs, given its stronger brand recognition (stronger direct channels lead to lower dependence on paid channels6, Figure 11). For BKNG, Marketing & Sales costs reached 39.8% of
Revenues in 2018, while for Expedia, for example, this figure was as high as 51.4%. Conversely, Trip.com presented Sales & Marketing costs even lower than Booking’s, at 31%. We believe the low figure is justified by the absence of Google in Trip.com’s largest market, China.
Secondly, BKNG benefits from large economies of scale, resulting in lower personnel costs (as a % of sales). While Booking’s revenues per employee in 2018 were $593 thousand, Expedia’s stood at $458 thousand and Trip.com’s at $104 thousand (Figure 12). The latter is quite low even when considering lower average wages in China. Despite high revenue per employee when compared to its peers, the Group reports growing costs per employee. Personnel costs as a percentage of total revenues were 14.1%, up from 2017 and 2016’s 13.1% and 12.6%, respectively. We interpret growing costs per employee as a consequence of the expansion of the merchant model, which requires higher personnel costs per sale. Moreover, we believe workforce specialization also plays a role in increasing costs per employee, particularly as data analysis and AI have become part of the Group’s core offer.
Invested Capital
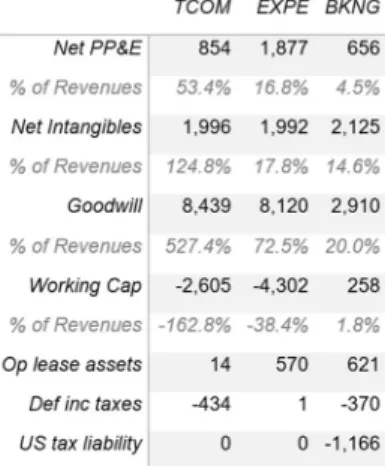
Booking is non capital-intensive company and in 2018 its operating invested capital was 34.7% as a percentage of revenues, a rather low value comparing with Expedia’s 68.6% and Trip.com’s 516.5% (Table 2). This difference is explained by lower values of PP&E and Goodwill (as a percentage of revenues) and higher Working Capital (as a percentage of revenues). BKNG’s PP&E is related to the company’s buildings and offices, as well as “Capitalized software development”. TCOM’s (Trip.com’s ticker) PP&E is higher, since the company has a higher number of offices and buildings, due to customer service needs related to its transportation tickets business. EXPE (Expedia’s ticker), in its turn, manages more brands than Booking (and therefore, has more offices and buildings) and has more “Capitalized software development”.
6 A direct customer goes directly to BKNG’s websites, while paid channel’s customers are redirected by paid clicks or
trough metasearch platforms (like TripAdvisor and Google Travel)
Figure 10: 2018’s peers' EBITDA Margin; Source: Companies reports
Figure 12: Personnel costs (thousands); Source: Companies reports
Figure 11: Keyword's interest over time Source: Google Trends
Table 2: Peer's 2018’s operating invested capital; Source: Companies reports
Figure 13: Deferred merchant bookings (% of revenues): Source: Companies reports 40% 22% 15% 15% 11% 2% Booking eDreams… Webjet Expedia Group Trip.com Tongcheng-… 0 50 100
Dec-17 Jun-18 Dec-18 Jun-19 Booking.com Ctrip Expedia 0 200 400 600 0 15 30 45 R e v pe r E m pl oy ee N r of E m pl oy ee s 7.04% 38.60% 86.10% BKNG EXPE TCOM
“BOOKING HOLDINGS” COMPANY REPORT
PAGE 8/32
BKNG’s Goodwill as a percentage of revenues is much lower than EXPE’s and TCOM’s due to a less aggressive acquisition strategy: since 2014, while BKNG’s acquisitions’ value totalled $3.5 billion, EXPE’s totalled at least $6.2 billion7 [1].
TCOM’s high Goodwill value is related to its merger with the Chinese company Qunar in 2015.
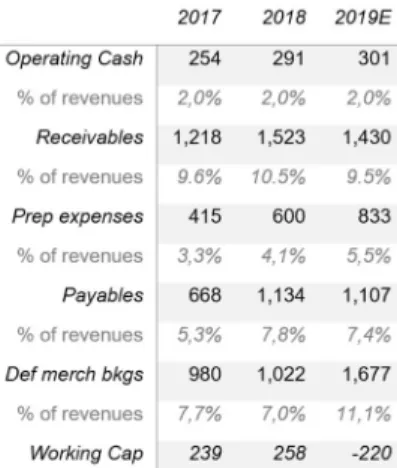
Booking’s Net Working Capital was lower than EXPE’s and TCOM’s in 2018 due to lower Deferred merchant bookings (7% as a percentage of revenues against 39% and 86%, respectively, Table 3). In EXPE’s case, this difference is explained by the fact that only 21% of BKNG’s revenues are derived from the Merchant model, while for Expedia this figure is as high as 52%. A Deferred merchant booking corresponds to liabilities owed by OTAs to service providers for receiving payment directly from customers
In 2019E Deferred merchant booking’s account as a percentage of revenues increased, justified by Booking’s Merchant revenues’ increase. Moreover, Accounts receivable, which is related to Agency revenues (the model in which service providers pay fees to OTAs at the end of the month) has decreased, due to a slowdown in this business model’s revenues in 2019E (Figure 2).
Cash flow
In 2019E, we expect Core Operating and Investing cash flow to be $5.0 billion and -$0.4 billion, respectively, and Non-Core Operating and Investing cash flow to be $0.5 billion and $6.3 billion, respectively (Figure 14). The high Non-Core Investing cash flow is linked to a high investment in marketable securities (governments’ bonds, corporate bonds, equity securities). Nevertheless, this value more than halved from 2018 to 2019 due to the maturation of $6.77 billion of Governments’ bonds, that contributed to historically high cash reserves by the end of the year (at 31% the revenues).
We expect the company to reinvest part of these cash reserves in safe marketable securities, for example US government bonds, as a way to protect its investors against downsides and slowdowns. Moreover, in the past 5 years, the company has been investing in other companies’ securities, mainly in Asia, as part of commercial agreements, (as it is the case with Didi Chuxing, Grab, Meituan and Trip.com)8 and we foresee BKNG will continue investing in these agreements, as
well as in new agreements, as a way of gaining sales and brand recognition in countries where it has a small market share.
7 Not accounting for 3 acquisitions in 2018 and 2019 whose terms were not disclosed. 8 Read Oportunities’ chapter for further detail.
Table 3: BKNG's net working capital; Sources: Company reports, analysts estimates
Figure 15: Cash reserves over time; Source: Company reports, Analysts estimates
Figure 14: 2019’s Operations and Invested cash flow; Source: Analysts estimates -1 1 3 5 7
Core Non Core Investing Cash flow Operations Cash flow
3.1 1.5
2.1 2.5 2.6
4.7
“BOOKING HOLDINGS” COMPANY REPORT
PAGE 9/32
Share Repurchase Program
Although BKNG has never paid dividends and does not expect to do so in the foreseeable future, it has been conducting a stock repurchase program, financed by cash reserves. From 2014 to the third quarter of 2019, the group repurchased 23.7% of its shares outstanding, worth $18.7 billion, of which $6.2 billion were repurchased in 2018 and $6.8 billion until the third quarter of 2019 (Figure 16). The group has a current authorization to buy back $10.9 billion worth of shares and expects to complete it in 2 to 3 years. Given the company’s historically high cash reserves, we expect repurchases of $2.0 billion in the fourth quarter and $4.2 billion in 2020. The latter account for 5% of our target shareholder’s total return.
Through share repurchases the company is inflating EPS artificially9 instead
of investing in internal growth. We understand it might be choosing to return capital to its shareholders over investing for example in Government securities, given the current low interest rate environment. However, it is somewhat concerning that the company is not using this cash to invest in projects that would yield higher returns to investors. The Group’s CEO has stated he is not afraid to make large investments, as long as they are the right investments, hinting he is waiting for a big opportunity in the market, possible another high-profile acquisition. Fiscal Policy
In 2018, BKNG paid $898 million in operating cash taxes (Figure 17) at a 17.4% effective tax rate. In the same year, 99.3% of the company’s income came from its international business (Booking.com, agoda and Rentalcars.com). For this business, we considered corporate taxes of 25.0%, 19.0% and 17.0% in the Netherlands, UK and Singapore, respectively. We estimate 47.8% of Booking.com’s income qualifies for the Innovative Tax Box (5.0% until 2018 and 7.0% onwards), a benefit created to attract investment in The Netherlands of companies that can prove to be innovating in their activity. As for KAYAK, priceline.com and OpenTable, we considered the U.S.’s 21.0% corporate tax rate. Capital Structure
In December 2019E, we estimate the company’s market Debt-to-Equity (D/E) ratio to be 11.7%, a low value when compared to the industry’s average (Figure 18). The company paid $318 million in interests, at an implicit average interest rate of 3.8% (including operating leases’ implicit interest), obtaining a $67 million tax shield. The company’s credit rating was recently upgraded from Baa1 to A3 by Moody’s [2]. Moreover, interest coverage ratio was 14.3, a high value, meaning
9 An artificial increase in EPS is achieved by decreasing the number of shares, rather than by increasing earnings.
Figure 18: Comparables' Market D/E; Source: Companies reports, Bloomberg
T ax a t U S s ta tu to ry r a te F o re ig n r at e di ff e re n tia l T ax B ox b e ne fit O th e r ad ju st m en ts C h an ge in d e fe rr ed t ax e s O pe ra tin g c as h ta xe s
Figure 16: Number of shares outstanding (million) and share repurchases ($ million); Source: Company report, Analysts estimates
Figure 17: Taxes reconciliation in 2018; Source: Company report, Analysts estimates 0 2.5 5 7.5 10 35 40 45 50 55 Shares Outstanding Share Repurchases 58% 22% 10% 8% TCOM EXPE BKNG WEB
“BOOKING HOLDINGS” COMPANY REPORT
PAGE 10/32
the company has the ability to pay its debt obligations, all the more considering its high levels of cash reserves.
Performing a sensitivity analysis to D/E, we acknowledge that while an all-equity discounted cashflow would lead to a share price of $1,880, a D/E of 20%, closer to the industry’s average, would lead to over $2,286. The latter would represent an 8.6% increase compared to our target share price at the current 11% D/E (Figure 20). Considering these factors, we believe there are no reason for solvency concerns at the current D/E levels. At this point, there is no evidence the company will change its target D/E level in the short term.
Shareholder’s structure
Institutions hold roughly 95% of all shares outstanding [3], while 4% are held by the general public and less than 1% by employees as part of stock compensation benefits. 41% of the investors pursue an Intrinsic value strategy (long term), 34% pursue a Traders growth strategy (short term) and 25% of the shares are invested mechanically (ETFs, market tracking portfolios). The low share of Traders growth strategy for BKNG’s stock, below the U.S. Equity market’s average [3], contributes to lower share price volatility. On the contrary, a higher-than-average Intrinsic strategy share [3] (with lower trading frequency and higher acceptance of short term bad results) should positively influence management to focus on driving long term returns.
Management
Glenn Fogel, BKNG’s CEO since January 2017, joined the group in 2000. While head of BKNG’s Worldwide Strategy division, he was responsible for the acquisitions of ActiveHotels and Booking.com, as well as for commercial partnerships with Chinese companies. We place credibility on his leadership, given his successful history in the company. Although his 2018’s annual compensation was twice the size of the average compensation for CEOs of similar size U.S. companies ($20 million), 96.3% of his compensation was performance-based.
Industry overview
Bloomberg places Booking Holdings in the Media industry, in the sub industry of Internet Based Services, within the Communications' Sector. However, we insert the Group in the Travel & Tourism industry for the purpose of analysing it in light of the major market trends, challenges and opportunities, guiding the business forward. Geographically, Booking Holdings' key markets are Europe, the U.S. and Asia, namely China and Southeast Asia.
Figure 20: Share price sensitivity to market Debt-to-Equity
Figure 21: BKNG's CEO compensation ($ million); Source: Company report 1800 1900 2000 2100 2200 2300 0% 5% 8% 11% 14% 17% 20% 0.8 5.7 14.0
“BOOKING HOLDINGS” COMPANY REPORT
PAGE 11/32
Trends
Travel & Tourism Industry Growth
Booking Holdings’ growth is highly correlated to the Travel & Tourism industry’s growth. To the exception of 2015, the latter has continuously expanded since the last recession [4]. The sector is driven by economic growth, growing middle class and internet penetration in emerging countries, as well as visa facilitation policies and affordable travel solutions [4].
Growing demand for Tours & Activities
The global market for tours and activities is estimated to be $150 billion annually, and research suggests expected growth of 9% per year [5]. This market includes a broad range of activities from museum tickets, to tour reservations or multi-day activities. The fact that most of these activities are still likely to be purchased offline (80% as of 2017 [6]), represents an opportunity for Online Travel Agencies to bring these customers online. By expanding their offers to these activities, OTAs are not only responding to customer’s demand but also capitalizing on the cross-selling of products in their websites.
Going Mobile
The continuing decrease in the number of computers sold worldwide [7] is evidence of the increasing consumer preference for mobile rather than computer platforms. We believe the shift towards mobile bookings is positive for OTAs, since we expect customers using mobile apps will likely only comparison shop10 between
the apps they have installed and will come back to these same apps whenever they need booking services. These dynamics benefit brands with higher brand recognition, as these will likely be the most downloaded apps. Moreover, mobile sales contribute to the direct channel, as OTAs do not need to incur in any performance marketing costs.
Consolidation
Consolidation has played an important role in the travel industry for some time, particularly in the airlines and hotels business. In a market where differentiation between product offers is low, Booking Holdings and The Expedia Group have used mergers and acquisitions (M&A) to gain scale, strengthening their competitive positions as market leaders [8] and to diversify their offers [9]. Through acquisitions of smaller companies, often tech start-ups, OTAs are able to quickly
10 Comparison shopping refers to comparing product prices between different stores or suppliers before making a purchase in order to
achieve the best deals
Figure 22: BKNG Revenue Growth highly correlated to Global International Tourism Receipts; Source: Company Reports, UNWTO -5% 10% 25% 40% 20 10 20 11 20 12 20 13 20 14 20 15 20 16 20 17 20 18 BKNG Revenue Growth Global International Tourism Receipts Growth
Figure 23: Consumers' spending preferences; Source: Skift's 2017 U.S. Experiential Traveler Survey
59% 67%
41% 33%
2017 2018
Spend more on better activities Spend more on nicer hotel room
Figure 24: U.S. Digital Travel Sales by Device (in billions of dollars); Source: eMarketer 60 80 100 120 2016 2017 2018 2019 2020 2021 Desktop/Laptop Mobile $37 B $68 B +84% 2017 2018
Figure 26: Volume of M&A in Travel & Tourism; Source: BusinessWire [1]
Figure 25: Share of Internet users worldwide who used a mobile payment service in December 2018; Source: Bloomberg Intelligence [8]
47% 38%
31% 29% 29%
Asia
Pacific AmericaLatin Europe AmericaNorth MiddleEast & Africa
“BOOKING HOLDINGS” COMPANY REPORT
PAGE 12/32
incorporate new technologies or innovative products in which those start-ups specialize, while maintaining focus on the core aspects of the business [11].
Challenges
Google Travel & Google Flights
Google Travel is a metasearch engine that collects and organizes information from travel websites and displays it to travellers looking for flights, hotels or car rentals. Launched in 2019, this feature is gradually being integrated into Google’s widely used app, Google Maps (Figure 28). It enables easy comparison shopping for travellers who can then make an informed decision on which travel agency to purchase from. These travellers would otherwise search for "hotel room" or "Lisbon to London flight" on Google’s search engine and look into the 2 or 3 websites that appeared on top. As such, Google Travel intensifies competition, particularly price competition, for large players by giving visibility to smaller (often cheaper) players who might otherwise not even appear on the traveller's radar. We believe Google Travel’s increasing popularity will force companies such as Booking and Expedia to lower their commissions at least to some extent in order to stay competitive. We factor this into our forecasted drivers, estimating a gradual decrease in commissions charged across our forecasting period.
Moreover, Google Flights, Google’s metasearch engine for flights, launched in 2011, is competing directly against KAYAK and Priceline. Although Google does not disclose any data concerning Google Flights, we know from Google Trends feature user searches for “google flights” on Google already surpassed those for Priceline.com and KAYAK (Figure 29). This poses a threat to Booking, as the Group currently derives 7% of its revenues from Advertising & Other revenues, the majority of which corresponds to advertising revenues from KAYAK. This threat is likely to materialize in the near future and, as such, we expect a decrease in year-on-year revenue growth from Advertising and Other revenues (Figure 30). Additionally, we analysed a scenario in which a dramatic loss of KAYAK’s market share to Google Flights would result in a steep decrease in advertising revenues11. This resulted in a valuation of $1288 per share, a 40%
drop when compared to the base scenario of $2141 per share. Google entering the market as an OTA
The advances Google has been making in the OTA business pose yet another risk. Recently, the company offered consumers the option to book accommodations directly through Google Travel. Although this offer is still
11 Refer to the Chapter “Scenario Analysis” for more detailed information on this analysis
Figure 28: Example of a hotel search on Google Maps; Source: Google Maps
Figure 27: BKNG and EXPE’s total acquisition deals and highlights; Source: Crunchbase
Figure 29: Keyword searches on www.google.com (relative popularity) Source: Google Trends
0 50 100 20 11 20 11 20 12 20 12 20 13 20 13 20 14 20 15 20 15 20 16 20 16 20 17 20 18 20 18 20 19 20 19 Kayak Priceline Google Flights
Figure 30: Advertising & Other Revenues forecasts (base case scenario); Source: Company Reports 0% 25% 50% 0 1000 2000 20 18 20 20 F 20 22 F 20 24 F 20 26 F Y oY g ro w th R e ve nu es
Advertising & Other Revenues YoY growth
“BOOKING HOLDINGS” COMPANY REPORT
PAGE 13/32
limited to selected locations, it might be a step towards becoming a travel agent itself. In this scenario, Google would hold large competitive advantages such as 1) the fact that it does not need to pay for advertising, as it can freely promote its products, and 2) the fact that it has access to larger amounts of consumer data than any OTA. Google’s entry in this market could, therefore, result in significant loss of market share for Booking Holdings. However, we do not deem a scenario in which Google would become the leading OTA very likely. Booking Holdings and the Expedia Group alone spent $10.6 billion on performance and brand marketing [10], the majority of which (around 80% according to our estimates) went to Google, accounting for advertising revenues. Moreover, anti-trust laws would make it difficult for Google to overtake the OTAs market. Macroeconomic instability
As BKNG’s products are essentially consumer goods, they are highly sensitive to economic conditions (in economic expansions consumption of travel products increases and vice versa). Since 2010, the global market has experienced economic expansion (Figure 32) bolstered by Monetary Policy in the U.S. and Europe, namely artificially low interest rates, and a growing middle class in Asia. In the future, we expect this trend to continue in Asia, despite China’s Gross Domestic Product (GDP) growth slowdown. Regarding the U.S. and Europe, however, we are concerned that Monetary Policies, which sustained growth in the last decade might not be sustainable. In 2019 the U.S. registered an inversion of the yield curve, which is typically a sign of an upcoming recession, while Europe’s largest economy, Germany, suffered a contraction of GDP growth. Although the Group hedges against economic recessions by maintaining Government Securities (in 2018 these accounted for 9% of its total assets), we believe this scenario would cause a significant decrease in room nights, average prices charged and advertising revenues.
Currency risks
While the Group reports its results in U.S. dollars (USD), 76% of its revenues were earned in Euros (EUR) in 2018. Therefore, the Group is largely dependent on exchange rates. Although the Group invests in derivative instruments in order to hedge against currency risks, it is still subject to unexpected changes in exchange rates. In 2015, for example, as the USD strengthened against the EUR, BKNG reported lower foreign currency-denominated results. Although this risk has materialised in the past, we do not deem it relevant for our valuation, as currency exchange rates are extremely hard to predict, and we believe that over the long run unexpected currency rate differentials would tend to balance out.
Figure 31: Google Travel's side bar; Source: Google Travel
0% 10% 20% 30% 40% 50% 1 1.1 1.2 1.3 1.4 1.5 20 09 20 11 20 13 20 15 20 17 20 19 N K N G 's r ev en ue g ro w th E ur o D ol la r ex ch an ge r at e
Euro Dollar Exchange Rate BKNG's Revenue Growth
Figure 34: BKNG's revenue growth highly correlated to Euro Dollar exchange rate; Source: Macrotrends
Figure 32: Real GDP (% change); Source: IMF 0% 2% 4% 6% 20 09 20 10 20 11 20 12 20 13 20 14 20 15 20 16 20 17 20 18
Figure 33: Real GDP (% change) by country; Source: IMF
0% 3% 6% 9% 20 12 20 13 20 14 20 15 20 16 20 17 20 18 20 19 E Germany China
“BOOKING HOLDINGS” COMPANY REPORT
PAGE 14/32
Stagnation
In the past, OTAs’ revenue growth was largely driven by consumers’ move from the offline to the online travel sector. In developed economies where, today, internet penetration is high [11], this shift may be already complete. In fact, BKNG has already experienced declining revenue growth in recent years. To tackle this problem, it is investing in different solutions (emerging economies, innovative products and expansion into new markets). However, if these investments do not materialise, the Group could face stagnating revenue growth and lose significant value, resulting in a share price of $1,372, according to our estimates, a 36% drop from our base case scenario12.
Regulation
Despite being a sign of strong travel demand, we believe over-tourism is also a significant risk to BKNG’s business, as among the most popularly discussed solutions for these problems is government regulation. The latter may consist of establishing limits for tourist arrivals or regulating short term rental supply, as was the case in Barcelona and New York [12]. This might become increasingly damaging for BKNG as the Group expands its alternative accommodations business. Particularly as the Group is shifting towards the Merchant Model, it is no longer able to defend its position as a mere facilitator of transactions between hosts and travellers, not carrying responsibility for collecting taxes or getting operating licenses [13]. Consequently, regulatory issues require the Group to expend significant time and resources and could end up affecting the growth and size of the alternative accommodations business.
Opportunities
Asia & strategic partnerships
The South and South-East Asia markets report the fastest growth for outbound travel, with forecasted growth of 5.8% and 5.1% per annum, respectively, until 2028, according to data from WTTC. In 2018, the Travel & Tourism industry saw above-average growth in the Asia Pacific region, with a 7% year-on-year increase in international tourist arrivals and tourism receipts. Moreover, according to Airbus, Asian middle class will grow by 37% from 2018 to 2028 and the manufacturer expects to deliver on average 816 new passenger aircraft per year to the region for the next 20 years. As inbound tourists need accommodation, these figures reflect a big opportunity for travel agencies to capture in the region.
12Refer to the Chapter “Scenario Analysis” for more detailed information on this analysis
Figure 35: Global internet penetration rate by region. Source: Statista
80% 71% 70% 55% 47% 24% E ur op e C IS A m er ic as A ra b S ta te s A si a P ac ifi c A fr ic a 7% 5% 4% 2% 0% 7% 5% 5% 7% 2% A P A C E ur op e M id dl e E a st A fr ic a A m er ic as
International Tourism Receipts growth 2018 International Tourism Arrivals growth 2018
Figure 37: International tourism arrivals (millions) and receipts (millions USD) in 2018 (% change); Source: UNWTO [28]
0 2 4 6 8 10 19 90 20 00 20 10 20 13 20 14 20 15 20 16 20 17
Figure 36: Tourist arrivals in Barcelona (in millions); Source: Statista
“BOOKING HOLDINGS” COMPANY REPORT
PAGE 15/32
Booking has been present in the Asian region through its acquisition of agoda since 2007 and, most recently, the Group has entered into strategic partnerships with local companies to further deepen its roots in the market. The first of these partnerships was made between Booking.com and Trip.com in 2014, where the Group entered into a commercial agreement to share access to the companies' combined hotel inventory. Similar agreements were made with Meituan-Dianping, Didi Chuxing and most recently, Grab, a ride-hailing app, operating mainly in Southeast Asia. While the partnerships with Trip.com and Meituan-Dianping contribute to room nights growth through shared inventory, the partnerships with Didi Chuxing and Grab contribute to BKNG’s brand recognition through referrals from the Asian companies to BKNG’s websites and apps.
The Connected Trip – personalization & cross-selling
The Connected Trip is the new buzz word among OTAs. The Connected Trip is similar to the concept of holiday packages and travel agents, as it aims to connect all aspects of travel from flight reservations, to transport from the airport, dinner reservations, accommodation and local activities. Major OTAs such as Booking and Expedia plan to use data collected from customers to personalize suggestions through Artificial Intelligence (AI) in real-time at each point of the trip. These suggestions would be the motor for cross-selling the brands’ products to travellers. Should this opportunity materialise, we believe BKNG would improve customer loyalty, and therefore direct traffic to its channels, which in turn would result in lower marketing costs and higher operating margins. Additionally, it maximizes revenue per customer by selling them a multitude of products, either as a bundle when planning the trip, or spontaneously along the trip.
To understand the impact of a truly successful delivery of the Connected Trip, we analyse an upside scenario. According to our estimates, this would yield a 17% increase on BKNG’s stock price to $2,502, when compared to our base case scenario of $2,140.
Alternative accommodations
In 2017, the alternative accommodations market in Europe grew over twice as much as the market for traditional accommodations [14]. Airbnb’s estimated total revenues for 2018, of which 99% were derived from alternative accommodations, were $4.4 billion, up 40% from the previous year [15] [16]. BKNG, in 2018, reported that 20% of its total revenues, or $2.9 billion, came from alternative accommodations. This places Airbnb as the market leader for the sector but shows BKNG is catching up. As we expect the market for alternative accommodations to continue growing in the next years, we believe continuing
Figure 38: Forecast of new passenger aircraft to be delivered in the next 20 years by Airbus; Source: Airbus
Figure 39: Accommodation Market Growth by segment; Source: Cleveland Research Company 62 per year 816 per year 74 per year 371 per year 134 per year 160 per year 298 per year A fr ic a A si a -P ac ifi c C IS E ur op e La tin A m er ic a M id dl e E a st N o rt h A m er ic a 0% 10% 20% 2011 2012 2013 2014 2015 2016 2017 Traditional Accommodations Alternative Accommodations 459 460 481 500 525 548 571 105 114 125 140 158 180 202 2014 2015 2016 2017 2018 2019 2020 Traditional (hotels) Alternative
Figure 40: Total global accommodations by type; Source: Cleveland Research Company [29]
“BOOKING HOLDINGS” COMPANY REPORT
PAGE 16/32
expansion into the market is an opportunity for Booking to derive further growth in the future.
Competitive landscape
The Market for Online Travel Agencies around the world is fragmented, as most players are small domestic private players operating on niche markets. There are only a selected few truly international players operating on a global scale. As such, the market is experiencing a consolidation trend with the largest OTAs increasingly acquiring smaller companies to consolidate their leading positions, develop inhouse expertise and expand to other markets, as mentioned above. When comparing leading Online Travel Agencies in 2018, Booking Holdings held the first place for the company generating the most revenues and with the highest market capitalization. The latter, at $84 billion corresponds to almost 4x as much as that of the second and third largest players, Trip.com with $20 billion and Expedia with $16 billion, respectively. As Airbnb is still a private company, its market capitalization is uncertain, but studies place it at $31 billion, which would make it the second-largest player in the market by market capitalization. Google Travel was not considered when analysing revenues nor market capitalization due to lack of reliable data.
Applying Porter’s Five Forces framework to the sector, we understand: bargaining power of customers is extremely high as travellers are becoming increasingly sensitive to prices, jumping between travel websites until they find the cheapest product to book; bargaining power of suppliers is moderately lowas suppliers (hotels, property owners, car rentals, airline companies, etc.) are increasingly dependent on OTAs for customers; despite the fact that there are no licensing requirements to begin operations and capital requirements are relatively low, barriers to entry are relatively high, given the increasing scale of the market’s largest players; there is high intensity of competitors, as previously mentioned; and high threat of substitutes, as a new wave of players, such as Google and Airbnb, threatens to disrupt the travel industry.
Google Travel
As described in the Risks section of this report, Google Travel represents BKNG’s greatest competitor. However, lack of available data prohibits us from further analysing this competitor’s financials and overall business.
The Expedia Group (NASDAQ: EXPE)
The U.S. based travel group operates a large portfolio of brands, which it groups into four different segments: core OTAs, Trivago, Egencia and HomeAway. The
14.5 11.2 4.7 3.8 1.6 0.8 0.7 0.6 0.6 BKNG EXPE TCOM Airbnb TRIP Tongcheng e-long MMYT WEB EDR
Figure 41: Online Travel Agencies with the highest revenues (in billions of USD); Source: Statista 0 1250 2500 2013 2015 2017 2019 BKNG EXPE
Figure 42: BKNG vs EXPE's historical stock price in USD; Source: Bloomberg
“BOOKING HOLDINGS” COMPANY REPORT
PAGE 17/32
Group derives most of its revenues from the OTA segment, which includes its largest brand, Expedia. The Egencia segment, which comprehends Orbitz for Business in addition to the Egencia brand itself, is a global B2B solution offering corporate clients travel management services. This segment positively differentiates Expedia’s offer from BKNG’s, as the latter has yet to offer a service fully specialized in business travel.
Unlike Booking Holdings, the majority of Expedia's revenues are domestic. We believe this key difference between the two partially explains the major differences in profitability. While the accommodation market in Europe is mostly composed of boutique hotels, in the U.S. it is dominated by large hotel chains. The latter have more bargaining power in negotiations with OTAs than the former, which explains EXPE’s lower commission fees, with a revenue margin of 11.3% in 2018, when compared to BKNG’s 15.7%.
Another key difference between the two is their brand recognition. While BKNG’s main source of revenues remains Booking.com, Expedia’s revenue sources are more equally distributed between its brands, of which none benefits from the same recognition as Booking.com [17]. This results in greater dependence on paid sources of traffic rather than direct traffic when compared to BKNG and leads to greater performance advertising costs and lower profit margins.
The Trip.com Group Limited (NASDAQ: TCOM)
The Chinese OTA holds a majority stake in many companies under its name, most notably Trip.com Limited (100% ownership stake), Skyscanner (97% ownership stake), and Qunar Cayman Islands Limited (43% ownership stake). Following a 2018 deal, Booking Holdings now holds an 8% stake in Trip.com. Moreover, the two companies have combined resources, with Booking.com and Trip.com sharing hotel inventory and Trip.com referring their clients to Booking Holding’s Open Table. Despite operating in the same industry and, in many cases, competing for the same client base, Trip.com's business model sets itself apart from Booking’s and Expedia’s, as its main source of revenue stems from Transportation ticketing, which corresponded to 42% of total revenues in 2018, down from 45% in 2017.
TCOM’s key competitive advantages over BKNG rely on the fact that the former derives most of its revenues from China, where Google does not operate. This results in lower advertising costs (as a percentage of revenues) for Trip.com (around 19%) than those reported by Booking Holdings (31% for performance advertising alone). Nevertheless, BKNG is still a more profitable company, given
$ 6202 million 55% of total … $ 1626 million 11% of total revenues EXPE BKNG
Figure 45: BKNG vs TCOM's historic stock price in USD; Source: Bloomberg
0 1000 2000 2013 2015 2017 2019 BKNG TCOM 40% 37% 28% 18% 15% 8% 4% 2% EBITDA
Margin OperatingProfit Margin
Net Profit
Margin Return onAssets BKNG EXPE
Figure 44: BKNG vs EXPE's margins, Source: Bloomberg, Company Reports
40% 37% 28% 18% 11% 8% 25% 1% EBITDA
Margin OperatingProfit Margin
Net Profit
Margin Return onAssets BKNG TCOM
Figure 46: BKNG vs TCOM's margins; Source: Bloomberg, Company Reports Figure 43: Domestic over total revenues per Group; Source: Company Reports
“BOOKING HOLDINGS” COMPANY REPORT
PAGE 18/32
Trip.com’s higher R&D and personnel expenses, as described in the chapter “Company overview”.
Airbnb, Inc.
The San Francisco based company offers apartments, houses and vacation rentals’ reservations. Airbnb is allegedly the market leader for the alternative accommodations market, benefitting from higher brand recognition than its competitors. This is its main competitive advantage over BKNG, as it threatens the Group’s ability to grow within the market.More recently, Airbnb has taken steps to expand its business and step up the competition with the likes of Booking Holdings and Expedia. In 2016, it expanded its offer with the launch of its Experiences business and in 2017 launched Aibiying, the Chinese adjusted Airbnb brand. The company has also made some acquisitions in preparation for its IPO next year, namely Urbandoor (which offers business travellers extended stays) and HotelTonight (which offers last minute accommodation bookings). Both these acquisition deals were part of a broader strategy of the company to expand its offer beyond the market of alternative accommodations.
TripAdvisor, Inc. (NASDAQ: TRIP)
TripAdvisor, Inc., splits its operations into two main business segments: hotel and non-hotel. Through its hotel business, TRIP acts mostly as a booking supplier, redirecting customers to its partner websites (Expedia.com, Booking.com, etc.). Through its non-hotel segment, it offers experiences, restaurants and home rentals. The company operates a large portfolio of brands, the largest being TripAdvisor. TRIP’s main value proposition differs from that of BKNG and its other competitors, as the former focuses on delivering travel reviews to customers in a stage prior to booking. It helps them decide where to go and stay, where to eat and what to do. Moreover, TripAdvisor is better positioned to deliver the Tours & Activities (or Experiences) product, as its subsidiary Viator is the market leader in the U.S. in the segment [18].This represents an important competitive advantage, as the Experiences segment is an essential part of the Connected Trip, BKNG is striving to deliver.
Valuation
DCF approach
We followed a Discounted Cash Flows (DCF) Model to value Booking Holdings, as we believe this to be the method that better captures the value the firm will derive to its shareholders. Firstly, the DCF allows for detailed assumptions and
Figure 48: "Where did you look for inspiration when considering which destination to visit?"; Sources: TripBarometer 2017/18
Figure 49: Total listings offered by brand to U.S. consumers across 100 of the most popular tourist destinations worldwide; Source: Skift Research
37% 10% 10% 9% 9% 8% 5% T rip A d vi so r S ea rc h e n gi n e re vi ew s T ra ve l G ui d es W o rd o f m o u th S oc ia l m ed ia co nt e nt OTA s O th e rs 38400 14000 8300 4400 2500 1900 Viator Get Your Guide Expedia Airbnb Klook Peek 0 1250 2500 2013 2015 2017 2019 BKNG TRIP
Figure 47: BKNG vs TRIP's stock price in USD; Source: Bloomberg
“BOOKING HOLDINGS” COMPANY REPORT
PAGE 19/32
as such, it benefits from our intimate knowledge of the Group and of the Industry. Secondly, the Group’s performance depends on the occurrence (or non-occurrence) of certain events and as such, the scenario analysis enabled by the DCF is yet another reason for choosing this method.
To value the company, we used a forecasting period of 6 years from 2021 to 2026 and applied a perpetuity growth rate to determine the terminal value. All future cash flows were discounted at a weighted average cost of capital (WACC) of 8.61%. The perpetuity growth rate was estimated based on long term GDP growth rate and inflation rate forecasts, yielding a value of 2.04%, slightly higher than the long term GDP forecast of 2%.
As the Group’s performance in the future is highly dependent on how the risks and opportunities identified evolve, we conducted five scenario analysis and weighted the resulting share price according to the attributed probability of occurrence of the respective scenario. We included a base case (most likely) scenario, two risk scenarios and two opportunity scenarios.
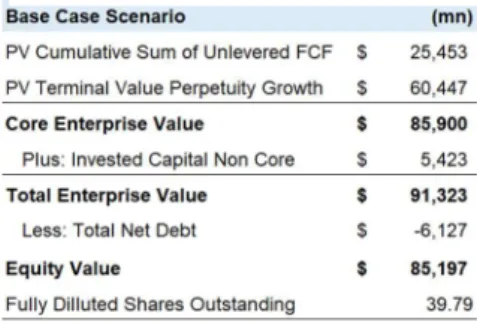
Our analysis resulted in a share price of $2,141, yielding a total return of 9% with capital gains of 4% and share repurchases of 5%. Therefore, we issue a HOLD recommendation for BKNG’s stock.
WACC calculation
To derive the Weighted Average Cost of Capital for the Group, we assumed its Market Debt-to-Equity (D/E) will remain stable during the forecasting period, as there is no evidence that the Group intends to make any major changes to its capital structure. At the time of valuation, BKNG’s market capitalization was at ~$87 billion and the estimated market value of Debt at ~$9.5 million, resulting in a market Debt-to-Equity value of 11%.
To estimate the Group’s cost of debt, 2.24%, we looked at its longest outstanding traded bond on Bloomberg. As it matures on March 2028, the bond had 7.25 years to maturity at the time of valuation. The Group’s credit rating is A3/A- (as rated by Moody’s and S&P, respectively), which gives it a 5 year probability of default of 0.51% and a corresponding recovery rate of 41.82%. As the bond’s Yield to Maturity (YTM) stood at 2.45%, we were able to derive a cost of debt using the following formula:
𝑟𝐷 = 𝑌𝑇𝑀 − 𝑃𝑟𝑜𝑏𝑎𝑏𝑖𝑙𝑖𝑡𝑦 𝑜𝑓 𝐷𝑒𝑓𝑎𝑢𝑙𝑡 ∗ 𝑅𝑒𝑐𝑜𝑣𝑒𝑟𝑦 𝑅𝑎𝑡𝑒
To estimate the cost of equity we applied the Capital Asset Pricing Model (CAPM), reaching a cost of equity of 9.39%. For the risk-free rate, we used the last rate of the U.S. Government 10Y Treasury Bond (USGG10YR), 1.94%, reflective of the
Figure 53: Cost of Equity; Source: analyst
estimates, Bloomberg, NYU Stern
Figure 52: Cost of Debt; Source: analyst estimate, Moody’s
Figure 50: DCF results for base case scenario; Source: analyst estimates
Figure 51: Valuation Summary; Source: analyst estimates
“BOOKING HOLDINGS” COMPANY REPORT
PAGE 20/32
low interest rate environment currently experienced in the US Market. We based our Market Risk Premium of 5.96% on NYU Stern’s analyst estimates.
In order to compute the raw beta of the Group, we first performed a regression analysis on Booking’s stock price against the S&P 500’s, dating back to November 2014, as to get 60 data points. This regression resulted in a beta of 1.08 with a confidence interval of [0.58,1.57]. As the confidence interval is wide, we performed the same regression for a selected group of comparable companies based on the type of business they operate, the geography they operate in, their EV/Sales and EV/EBITDA multiple. From the selected Group of companies, we excluded the ones with the broadest confidence intervals (eDreams and Tongcheng). Afterwards, to exclude the effects of different capital structures, we first unlevered each company’s beta. Secondly, we attributed weights to each comparable company based on relevance and finally, computed the weighted average unlevered beta of the comparable companies and BKNG’s. Knowing the beta of Debt (through reverse engineering the CAPM formula for the cost of debt) and the market D/E of the Group, we were able to reach a raw beta of 1.25. Having all the variables necessary and assuming a tax rate of 21% (U.S. corporate tax rate), we reached a WACC of 8.61%, through the formula:
[Eq. 1] 𝑊𝐴𝐶𝐶 = ∗ 𝑟𝐸 + ∗ 𝑟𝐷 ∗ (1 − 𝑇)
Multiples Analysis
To find suitable comparables, we analysed the company’s peers (Expedia, Trip.com, MakeMyTrip, Webjet, eDreams, Despegar, Tongcheng, Meituan and Trip Advisor). After a selection based on geographical exposure, business model and relevance of the multiples, we decided to follow the analysis with Expedia and Trip.com. Although EXPE’s main market is the US and TCOM’s operations reside mainly in China, these companiesare the ones that best capture BKNG’s worldwide exposure (Trip.com owns the UK based Skyscanner and EXPE has investments in Asian companies). As explained above, BKNG’s cost structure is different from EXPE and Trip.com, with a much higher EBITDA margin, which favoured the use of EBITDA to Enterprise Value (EV) or price to earnings ratio (P/E). Nevertheless, the three companies’ EBITDA to EV values are very different, which lead us to use only P/E. Using Trailing Twelve Months values for earnings and the most recent market caps, we reached a weighted average P/E of 27.09x (Figure 56).
This value is considerably higher than Booking’s 19.97x and would lead to a share price of $3106.15. Although it might be the case that Booking’s current price is
Figure 56: Comparables' Price to Earnings ratio
Figure 55: Software's amortization (as a percentage of revenues)
1.2%
6.9% Booking
Expedia
Figure 54: Betas, confidence intervals and attributed weights of comparable
companies; Sources: Bloomberg, analyst estimates
“BOOKING HOLDINGS” COMPANY REPORT
PAGE 21/32
undervalued, we are more inclined to conclude these companies are not appropriate comparables of BKNG, given company-specific factors. On the first place, Expedia’s high P/E ratio may be related to the belief from its investors that the company is being mismanaged and that current earnings do not reflect the company’s potential. In fact, Expedia’s CEO has lately resigned after disagreements with the board regarding strategy decisions. On the second place, EXPE has high investments in R&D with higher PP&E than BKNG, namely capitalized software development. This leads to higher amortizations and lower earnings in the short term (Figure 55). Finally, Trip.com’s higher pricing may be related to its strong and established presence in the Chinese market, where future growth prospects are higher than average.
Revenue model
The following relations must be clear to understand our revenue model,: [Eq. 2] 𝐺𝑟𝑜𝑠𝑠 𝐵𝑜𝑜𝑘𝑖𝑛𝑔𝑠 = 𝑃𝑟𝑖𝑐𝑒 ∗ 𝑄𝑢𝑎𝑛𝑡𝑖𝑡𝑦
[Eq. 3] 𝐴𝑔𝑒𝑛𝑐𝑦 & 𝑀𝑒𝑟𝑐ℎ𝑎𝑛𝑡 𝑅𝑒𝑣𝑒𝑛𝑢𝑒𝑠 = ∑ 𝐺𝑟𝑜𝑠𝑠 𝐵𝑜𝑜𝑘𝑖𝑛𝑔𝑠 ∗ 𝐴𝑣𝑔 𝑓𝑒𝑒 , 𝑛 = 𝑟𝑜𝑜𝑚 𝑛𝑖𝑔ℎ𝑡𝑠, 𝑟𝑒𝑛𝑡𝑎𝑙 𝑐𝑎𝑟 𝑑𝑎𝑦𝑠, 𝑎𝑖𝑟𝑙𝑖𝑛𝑒 𝑡𝑖𝑐𝑘𝑒𝑡𝑠
To be able to analyse and forecast the evolution of each driver independently, we estimated an average price for each product, while quantities sold are provided by the Group on a yearly basis [Eq.2]. Moreover, we estimated the average fees charged by the Group in the past, as to be able to isolate the forecast of room nights fee, which is one of most impactful factors on revenues [Eq.3].
The average price charged for rental car days was calculated based on the reports of rental car companies "Avis" and "Hertz", since we believe these companies are a good proxy of the car rentals market with a ~27% combined market share according to our estimates. The average price charged for airline tickets was based on the U.S. quarterly average airfares, provided by the Bureau of Transportation Statistics. Finally, to arrive at an estimate of the price charged for room nights in each year, considering the reported year-on-year ADR change, we used Excel’s tool “Solver” to minimize the difference between reported Gross bookings and estimated Gross bookings by changing room nights’ average price.
The Group’ s Advertising & Other revenues are forecasted mostly based on forecasts for KAYAK, from where most advertising revenues derive.
We applied a forecasted inflation rate to each year’s total projected revenues and then applied a forecasted inflation rate weighted by the number of listings in each country where BKNG operates. This method of forecasting inflation was chosen
Figure 57: Rental car days, estimated past prices ($); Sources: analyst estimates; Avis and Hertz
36 39 42 45 2014 2015 2016 2017 2018 350 375 400 425 450 2014 2015 2016 2017 2018
Figure 58: Airline tickets estimated past prices ($); Sources: analyst estimates, U.S: Bureau of Transportation Statistics 2.60% 2.70% 2.80% 2.90% 20 19 20 20 20 21 20 22 20 23 20 24 20 25 20 26
Figure 60: Forecasted global inflation weighted for BKNG's operations; Source: analyst estimates; IMF
111 112 113 114
2014 2015 2016 2017 2018
Figure 59: Room nights estimated past prices ($); Sources: analyst estimates
“BOOKING HOLDINGS” COMPANY REPORT
PAGE 22/32
over applying a global inflation rate forecast, given concerns that the latter would result in high rates due to the effect of hyper-inflation countries (such as Venezuela or countries in North-African or the Middle-East), where Booking's business is either non-existent or insignificant.
To the exception of the average fee charged, all forecasts (Advertising & Other revenues, room nights’, rental car days’ and airline tickets’ prices and quantities sold) were projected based on the projection of year-on-year growth rates rather than forecasting actual numbers.
Regression
Considering how sensitive BKNG’s value is to accommodation ADRs, we developed a model to test our results for average prices charged. This analysis was based on a regression of estimated past prices and reported quantities sold on total reported Gross bookings, following [Eq.2], as follows:
[Eq.4] Gross bookings = β1*Adjusted room nights + β2*Adjusted rental car days + β3*Adjusted airline tickets + α ,
where: (1) reported quantities sold were adjusted for price variations from the first period considered in the regression (the first quarter of 2013) to each quarter of the sample period; (2) βs are the output of the regression, interpreted as the prices of a room night, a rental car day and an airline ticket, respectively, in the first period of the regression; and (3) α represents 4 dummy variables, which capture the seasonal effect of the 4 quarters. After obtaining the regression results, we updated the βs to each quarter, based on each variable’s past quarterly price changes. We used quarterly values for the inputs with the purpose of increasing the size of the sample used.
Average quarterly prices for room nights, rental car days and airline tickets were estimated based on proxys, namely average global hotel daily rates, average prices charged by Hertz and Avis, and U.S. domestic average airfares, respectively. Although these proxys are not perfect matches for room nights, rental car days and airline tickets’ prices, we believe these proxys’ price variations are a close enough estimate of BKNG’s products’ price variation.
The only significant coefficient achieved was β1, the average price of a room night in the first quarter of 2013, at a price of $107.41 and a p-value of 7,4E-10. Updating this value to the third quarter of 2019, we achieved an average price of $108.12. Despite a wide confidence interval for this value, $88 to $126, the final price is remarkably close to the previously mentioned price, $ 108.37, supporting our room nights price estimation.
Figure 61: Regression coefficient β1; Source: analyst estimates
“BOOKING HOLDINGS” COMPANY REPORT
PAGE 23/32
Coefficients β2 and β3’s did not yield statistically significant results through the regression model, with p-values of 0.36 and 0.62, respectively. We believe the main reasons behind this might have been: 1) the reported numbers of rental car days and airline tickets sold were rounded to the millions, making it difficult for the model to capture small variations; and 2) a very small share of total Gross bookings is related to other products, such as travel packages, experiences or cruises, which we did not include in the regression.
Scenario analysis
We present this analysis following a top down approach, first discussing at the outer level average fee’s forecasts for merchant and agency Gross bookings as well as revenues for our advertising model. Next, we present our forecasts for the main drivers (the number of room nights, airline tickets and rental car days sold). Finally, we analyse the impact the different scenarios have on performance advertising, brand advertising and personnel costs. In our model, we assumed the products’ forecasted prices (excluding fees) remain the same for every scenario and assumed total prices (including fees) only vary through changes in average fees. Moreover, average fees charged for rental car days and airline tickets were not forecasted, remaining constant throughout the analysis given their low impact on our final valuation.
Scenario 1: Base Case Share Price: $2141
In our base case scenario, we forecasted average fee's growth to slow down over time, following the current trend, due to pressure from metasearch engines (such as Google Travel), which tend to increase price competition in the industry. The same applies for Advertising & Other revenues as we expect Google Flights will continue to adversely affect traffic to KAYAK and OpenTable.
We believe the Group will be able to sustain moderate growth of room nights sold, driven by strategic partnerships in Asia and expansion into the alternative accommodations market. Although this growth will most likely slow down in the long run with increasing competition in the market, particularly given Google Travel’s growing popularity. In 2020 we expect a slight increase in room nights growth (11.6%) due to two major events that will be occurring: the European Football cup, which will play out across the Group’s strongest market, Europe (and in different cities), and the Olympic Games in Tokyo. Regarding rental car days, we expect them to grow at a moderately constant pace, strongly correlated with room nights growth, driven by efforts related to the Connected Trip, which proved significant already in the first three quarters of 2019 following the integration of Rentalcars.com with Booking.com. We believe the number of airline tickets will
Figure 62: Scenario summary table; Source: analyst estimates
13% 14% 15% 20 16 20 17 20 18 20 19 E 20 20 F 20 21 F 20 22 F 20 23 F 20 24 F 20 25 F 20 26 F
Figure 63: Average room nights fee (% change); Source: analyst estimates
0% 10% 20% 30% 20 16 20 18 20 20 F 20 22 F 20 24 F 20 26 F
Room nights Rental car days
Figure 65: Room nights and Rental car days (% change); Source: analyst estimates 6.0% -8.0% -4.0% 0.0% 4.0% 20 15 20 16 20 17 20 18 20 19 E 20 20 F 20 21 F 20 22 F 20 23 F 20 24 F 20 25 F 20 26 F
Figure 66: AIrline tickets' prices (% change); Source: analyst estimates
0% 10% 20% 30% 20 16 20 17 20 18 20 19 E 20 20 F 20 21 F 20 22 F 20 23 F 20 24 F 20 25 F 20 26 F
Figure 64: Advertising & Other Revenues (% change); Source: analyst estimates
![Figure 9: Number of nights spent in tourist accommodations in Europe (billion); Source: Eurostat [32]](https://thumb-eu.123doks.com/thumbv2/123dok_br/15457751.1029789/8.892.32.232.740.1055/figure-number-tourist-accommodations-europe-billion-source-eurostat.webp)