Article
Printed in Brazil - ©2016 Sociedade Brasileira de Química0103 - 5053 $6.00+0.00
*e-mail: [email protected], [email protected]
Estimating the Time-Dependent Performance of Nanocatalysts in Fuel Cells Based
on a Cost-Normalization Approach
Cinthia R. Zanata,a,b Pablo S. Fernández,c Alexandre B. Santos,d Gabriel C. da Silva,e
Giuseppe A. Camarab and Cauê A. Martins*,a
aFaculdade de Ciências Exatas e Tecnologia, Universidade Federal da Grande Dourados, UFGD,
79804-970 Dourados-MS, Brazil
bInstituto de Química, Universidade Federal de Mato Grosso do Sul, CP 549,
79070-900 Campo Grande-MS, Brazil
cInstituto de Química, Universidade Estadual de Campinas, Cidade Universitária Zeferino Vaz,
Barão Geraldo, 13083-970 Campinas-SP, Brazil
dDepartamento de Engenharia de Produção, Universidade Federal de São Carlos, UFSCar,
13565-905 São Carlos-SP, Brazil
eInstituto de Química de São Carlos, Universidade de São Paulo, IQSC-USP,
CP 780, São Carlos-SP, Brazil
Researchers have developed new catalysts for fuel cells (FC), whose performances are compared after applying different normalization procedures. However, there is not a standard procedure. The current produced from CO electrooxidation was compared for Pt4Ru5Sn1/C and homemade Pt/C nanoparticles (NPs) normalized by different methods and the use of different methods renders different interpretations. Since the whole field aims to maximize the cost-effectiveness, a complementary method to normalize currents and power in terms of the total cost of the nanocatalyst, the Catalyst-based Cost method (CbC), was proposed. CbC considers the cost of all metals employed to build the catalyst, not only those ones with available surfaces. By applying a simple smoothing method on the prices in a time series, we were able to forecast the prices and consequently the power density of a FC. CbC provides tools for industrials forecast the designing of nanomaterials with improved efficiency and low cost.
Keywords: fuel cell, catalyst, normalization of current and power, cost of metal, forecasting activity
Introduction
The continuous growth of the energy demand opened a wide field of research for energy converters, among which fuel cells have been exhaustively studied. Fuel cells can produce energy with low environmental impact since they generate power by the oxidation of a fuel at the anode and reduction of O2 at the cathode. Fuel cells can be fed by H2
or small alcohols, as methanol and ethanol. The catalysts, both anodes and cathodes, are mainly based on Pt, which is historically an expensive material.1 This is the main reason
why many efforts have been made to replace Pt (at least partially) in catalysts used in fuel cells.
When a new nanoparticle catalyst is produced, the normalization of the electrochemical current generated by its use is imperative in electrocatalysis, since this procedure allows distinct surfaces to be directly compared for a given reaction in terms of their intrinsic electroactivities. In this context, different normalization methods generate multiple interpretations about the activity of a catalyst. This lack of consensus hinders the comparison of different materials in terms of their electrochemical performances and generates impasses that prevent a faster development of the research area.
and PtRuSn/C) the ECSA is sometimes estimated by the charge involved in the H desorption region.2-5 For Pd-based
catalysts, the ECSA is usually calculated by the charge involved in the reduction of a PdO monolayer.6-8 The main
concern about using the ECSA for multi-metallic catalysts calculated by these methods lies on the fact that the metal lattice parameter suffers intense modifications when an additional element is inserted into its structure.9,10 In this
context, the estimation of ECSA by stripping of CO rises as an alternative method for multi-metallic catalysts.11-13
However, such approach also present difficulties related to the determination of the charge involved in the electrooxidation. For instance, depending on the metal nature, CO can adsorb on different ways onto a surface,14,15
which can embed errors in estimating the surface area if pure metals are compared with multi-metallic catalysts. Another regular method is normalizing the current by the mass of the main metal (normally Pt) in multi-metallic catalysts.16-18 This approach attempts to focus on the
reduction of the cost, assuming that such material shows better performance even when using lower contents of Pt. However, this procedure is misleading when expensive metals (as Rh or Au) are used to replace Pt, because it disregards the cost of these materials.
As a general rule among of a plenty of options, researchers choose a particular method to highlight the characteristic they intend to emphasize. Very often, a candidate to catalyst is ruled out after initial studies based on these biased criteria. Because of this uncritical stance, many times additional studies performed after the seminal one reach controversial conclusions, since the same initial material is now highlighted due to its high performance, even using similar experimental setup. Such discrepancies probably result in misjudgment caused by the way researchers show and analyze the data.
In this sense, we used the CO electrooxidation reaction (COEOR) to compare the electrochemical performances of multi-metallic catalysts by using different methods of current normalization. Our results reveal a series of inconsistences concerning the interpretation of electrocatalytic activity of the materials investigated, depending on the method adopted for the normalization of currents. Furthermore, the aim of the whole field is the development of low cost materials with high electrochemical activity and stability, as shows the recurrent appeal for using less expensive materials.4,13,19-24 In this context, we propose an alternative
method to normalize electrochemical currents and power densities based on the cost of the catalysts. This method is versatile since the results can be easily modified considering the price of the catalyst in the past, present and even in the near future.
Experimental
Synthesis of carbon supported metallic nanoparticles
Metallic nanoparticles (NPs) were synthesized by the chemical reduction method induced by ethylene glycol using polyvinylpyrrolidone (PVP) as capping agent.25 This
simple method of synthesis combines reproducibility and quickness, yielding highly dispersed NPs over different kinds of carbons with narrow size distribution.25-27 We synthetized
PtRuSn/C and Pt/C. The chemical composition of each catalyst was, respectively, (i) PtRuSn/C of atomic ratio 4:5:1 with 20% of metals load; and (ii) Pt/C with 40% of metal load (m/m). We used the following protocol of synthesis for all catalysts: aqueous dispersions containing adequate amounts of the metallic precursors (i.e., H2PtCl6, RuCl3.xH2O and
SnCl2.H2O), carbon and PVP were mixed to a solution
containing ethylene glycol/water 3:1 (v/v) and heated at 150 °C for 2 h. The PVP/metal(s) molar ratio was set to 0.3. The dispersions obtained (containing the NPs) were washed with water and centrifuged at 4500 rpm for 1 h. This process was repeated five times. The remaining dispersions were dried at 60 °C for 24 h. The chemical composition of PtRuSn/C catalyst was determined by using a scanning electron microscope (SEM) JEOL (model JSM6380-LV) equipped with an energy-dispersive X-ray spectroscopy (EDS) detector. All experiments were made in triplicate.
Half-cell electrochemical experiments
Dispersions containing the nanoparticles (inks) were used as working electrodes by mixing 1 mg of the respective powder of metallic nanoparticles dispersed on carbon with 2 mL of 2-propanol and 50 µL of Nafion® 5% (v/v), followed by sonication for 30 min. An aliquot of 50 µL of each dispersion was deposited on a gold disk (0.79 cm2 of
geometric area) kept at 50 ± 2 °C, followed by the addition of 50 µL of a diluted Nafion® solution (1 mL of Nafion® 5%:20 mL of 2-propanol).
All electrochemical experiments were carried out in a conventional three-electrode cell. The electrolytes were prepared with deionized water (18.2 MΩ cm) and HClO4
(Merck). We used a Pt plate as counter electrode. The reference electrode was a reversible hydrogen electrode (RHE). Electrochemical data is presented in the RHE scale. All electrochemical runs were performed at 25 °C under oxygen-free conditions.
Fuel cell experiments
prepared by a combined filtration/painting procedure,28
using carbon supported Pt catalysts (20% metal/C by E-TEK), with the same metal loading of Pt4Ru5Sn1/C
catalysts. To prepare the catalyst layer (Pt/C or Pt4Ru5Sn1/C),
a homogeneous dispersion of Nafion and NPs in 2-propanol was quantitatively deposited on the faces of the composite diffusion layer by painting procedure. Next, samples were cured at 80 °C for 1 h. The metal loading was 0.4 mg of metal cm-2, and the Nafion loading
was 1.1 mg cm-2 for all electrodes. Membrane-electrode
assemblies (MEAs) were made following a previous work.29
Namely, anode and cathode were hot pressed onto the Nafion 115 membrane at 125 °C under a pressure of 50 MPa for 2 min. Experiments were carried out in single cells of 5 cm2 of active geometric area at operation temperature of
70 oC. MEAs were kept wet using humidification bottles
at 85 and 75 °C, respectively. We used flows of 100 and 150 mL min-1 for pure H
2 and H2/100 ppm CO, respectively.
The performances of the electrodes were evaluated from polarization curves. The curves in presence of 100 ppm CO were obtained keeping the cell at 0.7 V in pure H2 for 2 h,
followed by 2 h at 0.8 V in H2/100 ppm CO to reach a steady
state. Two identical MEAs for each catalyst were tested to evaluate the repeatability of the experiments. Besides, the performance of the electrodes was evaluated from two consecutive cell polarization measurements, showing no changes among them.
Results and Discussion
The influence of the method of current normalization for multi-metallic nanoparticles
Whenever a new, multi-metallic catalyst is synthesized, it is almost consensual that its performance must be compared to a commercial or homemade Pt/C catalyst which serves as a standard.17,18,23,24 Considering that
CO-tolerant catalysts allow the use of low-cost H2 obtained
from hydrocarbons reforming (H2 containing traces of
CO), we choose CO electrooxidation reaction (COEOR) to investigate the influence of the method to normalize electrochemical current on the interpretation of the results. In this regard, we compare the CO-tolerance on PtRuSn/C and Pt/C NPs by performing COEOR in acid media. EDS data reveal an atomic composition of 4:5:1 for Pt:Ru:Sn (see Table S1 in the Supplementary Information section), thus we labeled it as Pt4Ru5Sn1/C. The metal loads for Pt/C
and Pt4Ru5Sn1/C are 40 and 20% (m/m), respectively.
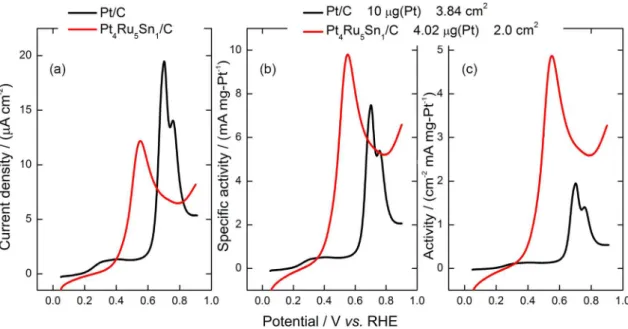
As a way to evaluate the activity of Pt4Ru5Sn1/C towards
COEOR, we used three methods to normalize the currents: (i) the ECSA based on the charge (210 µC cm-2) involved in
the desorption of hydrogen from Pt surface;30 (ii) the mass
of Pt, also named as specific activity or mass activity25-27
and (iii) a combination of area and Pt-mass. Results are depicted in Figures 1a, 1b and 1c, respectively. In this context, two important features to measure and compare the electrocatalysis of different materials are the onset potential and the current density. Figures 1a-c show that regardless the normalization procedure the COEOR onset potential on Pt4Ru5Sn1/C is ca. 0.3 V lower than on Pt/C,
which merely confirms the well-known CO-tolerance of the multi-metallic catalyst. This result is unequivocal and is in line with previous reports.24,28-31
Now, comparing the current densities, the scenario is more complex and different methods provide conflicting results. By using the ECSA, the current density produced on Pt/C is higher than that on Pt4Ru5Sn1/C (Figure 1a). In
other words, this result shows that Pt/C is able to produce more current than Pt4Ru5Sn1/C per site occupied by CO
molecules. The interpretation is opposite when using the Pt-mass to normalize currents. As shows Figure 1b, the specific activity (in terms of mg-Pt-1) is higher for COEOR
on Pt4Ru5Sn1/C than on Pt/C. In other words, this result
shows that Pt4Ru5Sn1/C is able to produce more current
than Pt/C per atom of Pt in each catalyst (even considering those atoms in the NPs bulk that do not interact directly with the electrochemical environment). This result is frequently found in literature and such inconsistences lead to confusing (and even misleading) interpretations regarding the catalytic activity of a specific material. In our case, the mass of Pt is obviously lower on Pt4Ru5Sn1/C.
Therefore, the high activity of Pt4Ru5Sn1/C could be a
mathematical artifact that will always generate a “gain in catalytic activity” as long as the metal mixed with Pt does not lead to a decrease of current that counterbalance the effect caused by the lower Pt loads used in the multi-metallic materials. Figure 1c shows a combination of ECSA and mass of Pt to normalize currents which leads to a huge COEOR current density on Pt4Ru5Sn1/C. This
method induces an erroneous idea that Pt4Ru5Sn1/C is
massively more active than Pt/C.
The Catalyst-based Cost for current normalization (CbC)
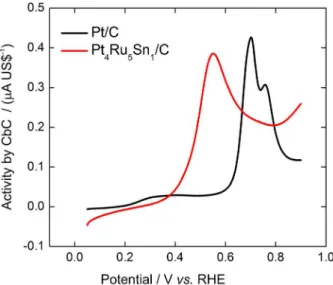
The development of a new material with technological interest must consider the efficiency of the device and the cost of its components. In this process, the continuous monitoring of production costs (in order to keep them as low as possible) is a task that can generate a competitive advantage among the technology holders. Considering that the price and activity of a metal are the main reasons for its utilization, we suggest a new method to normalize electrochemical currents based on the total cost of the material, hereafter named Catalyst-based Cost method (CbC). In the CbC method the current is shown as a quotient between the current density and the total cost of those metals that constitute the catalyst. Figure 2 compares the electroactivity of Pt4Ru5Sn1/C and Pt/C in terms of CbC,
here named activity by CbC. To estimate the cost of metals, we used an average of the monthly price per gram of metal during one year (2014) taken from the stock exchange, as shown in Figure S1.
By using CbC, we can clearly deduce that the use of Pt4Ru5Sn1/C is more advantageous than Pt/C along of that
period on time (2014). Pt4Ru5Sn1/C shows higher activity
than Pt/C due to its lower total cost, this fact added to the low onset potential make this material a promising CO-tolerant catalyst. In other words, it is possible to generate more electrochemical current by using Pt4Ru5Sn1/C than using
Pt/C for the same price, although we are not considering the intrinsically particularities about the stability of each catalyst at this point. Here, we should note that EDS is a semi-quantitative technique, thus the composition of
the multi-metallic material is not exact. Anyway, even considering a composition uncertainty of 10% does not compromise the interpretation assumed here.
The cost of the material is directly proportional to its mass; hence CbC is similar to the Pt-mass normalization (Figure 1b), but not the same. There is a slight difference in terms of current density at ca. 0.7 V, where the multi-metallic catalyst displays better performance whether the mass of material is considered (comparing Figure 1b with Figure 2). The obvious disadvantage of the Pt-mass method lies on the fact that its application could easily generate a mathematical artifact (whether applied inadvertently, as shown previously) while CbC considers the cost of the whole material, not only the Pt-cost. Additionally, CbC considers the cost of all metals, including those completely and partially covered (by a capping agent or residues of synthesis, for instance). The cost of the catalyst should not be taken from an estimated mass calculated from the surface area; otherwise, one would exclude the cost of inactive particles. The CbC is a reliable method, which reflects the financial advantage of using the metallic composition of interest at that period on time and certainly is a powerful tool when allied to other methods.
Equations 1-3 summarize the most used methods for current normalization, where j is the normalized current, i is the non-normalized current and mPt the mass of platinum. At
this point is important to note that there are other methods currently used.32
(1)
Figure 1. Stripping of CO on Pt/C and Pt4Ru5Sn1/C performed in 0.1 mol L-1 HClO4 at 0.005 V s-1. Current normalized by (a) the electrochemically active
(2)
(3)
The difficulty in choosing the best method and the right stage of the experimental procedure to determine the ECSA makes hard to compare j of a new catalyst with the literature. Additionally, the myriad of permutations including the mass of Pt to calculate j complicates the use of methods containing mPt in the equation. The CbC
method allows any researcher to introduce the annual price average of a material and to analyze how the activity (in terms of A per US$) changes for the desired period, as shows equation 4. ∑$M is the sum of prices of all metals that
constitute the catalyst (considering the mass experimentally used) and $M is a function of time, $M(t). Furthermore, the
current density (or current) can be normalized quarterly, monthly or even daily.
(4)
Although the mass of a metal remains constant, its cost varies with time. CbC is time dependent, which is not a disadvantage because the low prices of specifics catalysts claimed in several studies are obviously time dependent. The question that emerges is: “How to analyze the price fluctuation over time?” To answer this query, we need to follow a stock exchange. The fluctuation of current normalized by CbC during the time represents the efficiency
of a catalyst considering its cost along the years. Using this new approach, any researcher is able to find the activity by CbC whether the mass of the used metal and the price in a period of time are provided. As an illustration of the feasibility of the method, we used CbC to estimate the activities of Pt/C and Pt4Ru5Sn1/C in 1993, 2003 and 2011
(Figure S2). For those years, the multi-metallic catalyst is more active than Pt/C. Moreover, the growing in the annual average price of metals along the years results in a decrease of activity of both catalysts. However, the performance decrease is faster for Pt/C than for Pt4Ru5Sn1/C due to
the relative low prices of Ru and Sn in the multi-metallic catalyst (Figure S2). Also, researchers might include ECSA at the denominator of equation 4 whether the physical-chemical magnitude (A cm-2) is required.
The cost of power: a new way to look at fuel cells measurements
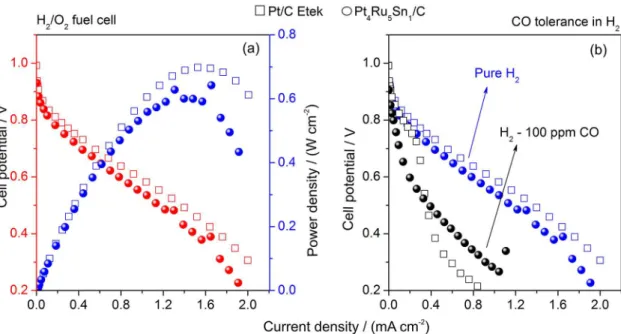
In order to apply CbC in a more realistic scenario, we investigated the power density of a H2/O2 fuel cell
using Pt4Ru5Sn1/C and Pt/C (E-TEK) as anodes. For
both configurations Pt/C (E-TEK) was used as cathode. Concerning the power density and the CO-tolerance, the multi-metallic catalyst showed results in agreement with the literature.33 All polarization curves show the
classical regions; activation, ohmic drop and mass-transport polarization (Figure 3a). Both electrodes present significant activation and ohmic decay, mostly due to the well-known kinetic limitation of the oxygen reduction reaction. Figure 3b shows that the activation and ohmic decay are even higher for Pt/C in the presence of CO, while Pt4Ru5Sn1/C presents higher current densities at
potentials higher than 0.4 V, which evidences the improved CO-tolerance of the multi-metallic catalyst.33,34 The
commercial catalyst presents better performance than the synthesized one for pure H2 electrooxidation, characterized
by the higher current density and consequently, higher power density in the whole potential range.
Applying CbC to normalize the power of the single cells using Pt/C and multi-metallic catalysts, we are directly considering the price of the catalyst needed to generate power. Here, we point out that there are more variables (as the proton exchange membrane) which contribute to the price of fuel cells. However, (i) the major contribution to the price comes from noble metals and (ii) all the other constituent parts are common to all configurations. Figure 4 shows the power density of the same single cell normalized by CbC. Here the power curves of Figure 3a were normalized by the annual average cost of metals (W US$-1). We show the power density in
Figure 2. Stripping of CO on Pt/C and Pt4Ru5Sn1/C performed in
0.1 mol L-1 HClO
4 at 0.005 V s-1. Current normalized by the
terms of CbC since 1986 for Pt/C (Figure 4a) whereas the absence of Ru in stock exchange,35 at least under our
concern, limited the oldest power density of Pt4Ru5Sn1/C
to 1992 (Figure 4b).
Pt4Ru5Sn1/C generate higher power per US$ than Pt/C
for the whole range of current densities. This color map surface allows us to investigate how the cost of power fluctuates over the years, which is important information from the technological point of view. Using CbC, industrials can compare market viability of producing a multi-metallic nanomaterial. Although the power density (W cm-2) is
slightly higher for Pt/C than for Pt4Ru5Sn1/C (Figure 3a),
the intrinsic price of power pushes up the activity of the multi-metallic catalyst (Figure 4).
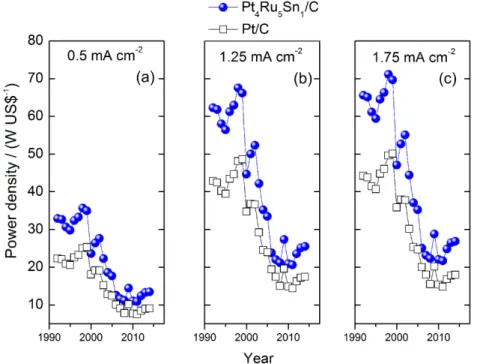
Figure 5 shows the power density in terms of CbC over the years at three current densities. The low price of Ru and the extremely low price of Sn make the power density of Pt4Ru5Sn1/C higher over the years. However, in some
periods the high cost of metals makes the power density of Pt/C nearer to the multi-metallic NPs. The increase of the price of Pt and Ru between 2005 and 2008 makes the power densities of both catalysts closer, especially at 0.5 mA cm-2 (Figure 5a). Through the 90’s, the prices of Ru
and Sn were too low and the power density of the ternary
Figure 3. Cell potential and power density versus current densities for acid single cells operating at 25 °C for Pt/C E-ETEK and Pt4Ru5Sn1/C electrodes
in the absence (a) and presence (b) of CO.
Figure 4. Fuel cell power density (W US$-1) versus current densities over the years, (a) from 1986 to 2016 for Pt/C electrode, *the catalyst-based cost of
catalyst was 1.5 times higher than Pt/C in 1997, at 1.25 and 1.75 mA cm-2 (Figures 5b and 5c).
This discussion shows us that the relevance of these results is relative and depends on multiple factors, most of them usually far from the fuel cells researchers’ scope. In this context, it is desirable that works intending to contribute in the designing of catalysts with improved performance for fuel cell technology, present the data in a friendly manner, providing the tools to easily compare different materials performances along the years. The complexity involved in the formation of a commodity price relies on a plethora of factors that a company itself cannot directly affect, such as global supply and demand, political contingencies and so on, but the company might predict. The commodity price must not be ignored in applied science, since the literature always claims that decrease of price (for a material or process) is justification to develop a scientific project and publish those data.
One reasonable alternative to predict future prices is applying time series techniques as proposed in this paper. Here, those prices collected in stock exchanges were firstly deflated using consumer price indexes (CPI) in order to correct the inflation in the period and bring all prices to their current values. However, it is important to mention that this kind of procedure works only with past information, which means that any future abrupt movement in the industry will not be captured (but the calculation might be easily corrected whenever necessary).
Additionally to the investigation of previous years, it is possible to forecast the price of metals and consequently,
predict the future price of power produced by a specific nanomaterial. To forecast the price of metals until October 2016, we used an exponential smoothing method known as Holt-Winters forecasting system, initially proposed by Charles C. Holt36 and Peter R. Winters37 on the
prices of metals along the years, obtained from a stock exchange for Pt,1 Ru35 and Sn.38 A linear programming
technique was used in order to minimize the exponential smoothing parameters (α-level, β-trend, γ-seasonality) and consequently the mean square error of each time series. Given the behavior of the prices in the time series, Holt-Winters multiplicative seasonal method was applied for a cycle of 12 months (period of prediction). By looking at mean square errors (Table 1), and considering numerous uncertainties that may affect the formation of a price, the model seems quite accurate, where the highest error (for Ru) is ca. 9.5%. For additional information about formulation and other exponential smoothing forecasting systems, we suggest consulting the work of Everett S. Gardner Jr.39 Curves of the real and simulated
Figure 5. Fuel cell power density (W US$-1) from 1992 to 2014 at (a) 0.5; (b) 1.25; (c) 1.75 mA cm-2.
Table 1. Holt-Winters multiplicative seasonality model applied on a time series for platinum, ruthenium and tin; parameters analysis and mean square error (SD)
Metal Platinum Ruthenium Tin
Parameter Alpha 0.990 0.990 0.990
Beta 0.010 0.494 0.010
Gamma 0.166 0.707 0.559
prices are superposed, which confirmed the accuracy of the method, as shows Figure S1.
The power density in terms of CbC shows that until the end of 2016, Pt4Ru5Sn1/C NPs will produce lower price
power than Pt/C, considering a stable market, as shows the forecast activity in Figure 4 (considering the annual average prices of metals). Economists and market engineers should work together with chemists in an attempt to improve this approach to predict the activity of nanomaterials in a more distant future.
The actual methods used to normalize electrochemical currents and powers are important and should be used more carefully, highlighting the method and the reason of the choice. Our approach narrows the industrial gap, turning closer fundamental and applied science. Although, studies concerning the fluctuation of price in metal commodities stock exchange are needed, CbC is an additional reliable method to (i) normalize electrochemical currents and to (ii) normalize powers of single fuel cells in a more applied investigation. Our approach has a clear advantage of allowing the prediction of the cost of power in terms of the global cost of all metals, which could be extended to the cost of a single fuel cell, considering that one knows how the prices of all components fluctuate, including membranes and small parts.
Conclusions
We showed that different methods of electrochemical current normalization might provide mismatched information. Using classic widespread methods, as active surface area, Pt-mass and a combination of both, we found that controversial interpretation can be made when comparing the activity of a multi-metallic catalyst with a standard one (Pt4Ru5Sn1/C vs. homemade Pt/C).
Since the development of a new material to be used in energy converters aims reducing costs and maximizing the efficiency, we proposed a new method to normalize electrochemical current and power in terms of the total cost of the catalyst, named Catalyst-based Cost method (CbC). The advantage of CbC method is considering the price of all metals used, not only the materials with available active sites. When using the electrochemically active surface area, those metals not available for reaction are not taken into account, although they contribute to the global cost of the catalyst.
The CbC method was used to estimate the activity of Pt4Ru5Sn1/C and homemade Pt/C along the years
by using the price of the nanocatalysts calculated from the price per gram of each metal obtained from a stock exchange. An analysis of the power density in terms of
Watt per US$ of H2/O2 single cells showed that an anode
made of Pt4Ru5Sn1/C is more advantageous than Pt/C since
1992 until nowadays. Moreover, some fluctuations of price allowed the power density of the fuel cell built with Pt/C to be closer to that using Pt4Ru5Sn1/C in particular periods.
By applying a simple smoothing method on the prices along the years we were able to forecast the price of the metals one year in the future. Consequently, our method provides the possibility of forecasting the price of power in terms of catalyst cost, which is important from the technological point of view. Industrials can decide from which material the anode of a fuel cell should be made for the next year. Our results showed that the multi-metallic catalyst is still a good choice for the next twelve months. Furthermore, CbC method could be used for any interfacial process involving metallic nanoparticles to forecast the efficiency of the process in terms of price.
Supplementary Information
Supplementary information is available free of charge at http://jbcs.sbq.org.br as a PDF file.
Acknowledgments
The authors acknowledge financial assistance from CNPq (grant No. 454516/2014-2), FUNDECT (grant No. 026/2015), CAPES and FINEP.
References
1. Quotes of Platinum, available at http://www.kitco.com, accessed in March 2016.
2. Lin, C.-L.; Wang, C.-C.; Appl. Energy 2016, 164, 1043.
3. Lin, R.; Cao, C.; Zhang, H.; Huang, H.; Ma, J.; Int. J. Hydrogen Energy2012, 17, 4648.
4. Liang, Q.; Zhang, L.; Cai, M.; Li, Y.; Jiang, K.; Zhang, X.; Shen, P. K.; Electrochim. Acta2013, 111, 275.
5. Zhang, Y.; Ma, C.; Zhu, Y.; Si, R.; Cai, Y.; Wang, J. X.; Adzic, R. R.; Catal. Today2013, 202, 50.
6. Hsu, C.; Huang, C.; Hao, Y.; Liu, F.; Electrochem. Commun.
2012, 23, 133.
7. Yang, Y.; Wang, W.; Liu, Y.; Wang, F.; Chai, D.; Lei, Z.;
Electrochim. Acta 2015, 154, 1.
8. Singh, R. N.; Awasthi, R.; Catal. Sci. Technol. 2011, 1, 778. 9. Antolini, E.; J. Power Sources 2007, 170, 1.
10. Geng, D.; Lu, G.; J. Phys. Chem. C 2007, 111, 11897. 11. Wei, Y. C.; Liu, C. W.; Kang, W. D.; Lai, C. M.; Tsai, L. D.;
Wang, K. W.; J. Electroanal. Chem. 2011, 660, 64.
13. Chen, H.; Huang, Y.; Tang, D.; Zhang, T.; Wang, Y.; Electrochim. Acta 2015, 158, 18.
14. Permyakova, A. A.; Han, B.; Jensen, J. O.; Bjerrum, N. J.; Shao-Horn, Y.; J. Phys. Chem. C2015, 119, 8023.
15. Rodriguez, P.; Garcia-Araeza, N.; Koper, M. T. M.; Phys. Chem. Chem. Phys. 2010, 12, 9373.
16. Cui, Z.; Kulesza, P. J.; Li, C. M.; Xing, W.; Jiang, S. P.; Int. J. Hydrogen Energy2011, 36, 8508.
17. Thepkaew, J.; Therdthianwong, S.; Therdthianwong, A.; Kucernak, A.; Wongyao, N.; Int. J. Hydrogen Energy 2013, 38,
9454.
18. Wu, G.; Swaidan, R.; Cui, G.; J. Power Sources2007, 172, 180.
19. Trongchuankij, W.; Pruksathorn, K.; Hunsom, M.; Appl. Energy 2011, 88, 974.
20. Shen, S.; Zhao, T.; J. Mater. Chem. A2013, 1, 906.
21. He, F.; Yang, J.; Li, R.; Liu, B. H.; Li, Z. P.; J. Power Sources 2015, 274, 48.
22. Pinto, L. M. C.; Juárez, M. F.; Ângelo, A. C. D.; Schmickler, W.; Electrochim. Acta 2014, 116, 39.
23. Ahmed, M. S.; Jeon, S.; ACS Catal. 2014, 4, 1830.
24. Purgato, F. L. S.; Olivi, P.; Léger, J. M.; de Andrade, A. R.; Tremiliosi-Filho, G.; Gonzalez, E. R.; Lamy, C.; Kokoh, K. B.; J. Electroanal. Chem. 2009, 628, 81.
25. Lomocso, T. L.; Baranova, E. A.; Electrochim. Acta2011, 56,
8551.
26. Li, M.; Cullen, D. A.; Sasaki, K.; Marinkovic, N. S.; More, K.; Adzic, R. R.; J. Am. Chem. Soc. 2013, 135, 132.
27. Purgato, F. L. S.; Pronier, S.; Olivi, P.; de Andrade, A. R.; Léger, J. M.; Tremiliosi-Filho, G.; Kokoh, K. B.; J. Power Sources 2012, 198, 95.
28. Ribeiro, J.; dos Anjos, D. M.; Kokoh, K. B.; Coutanceau, C.; Léger, J.-M.; Olivi, P.; de Andrade, A. R.; Tremiliosi-Filho, G.;
Electrochim. Acta2007, 52, 6997.
29. Loukrakpam, R.; Yuan, Q.; Petkov, V.; Gan, L.; Rudi, S.; Yang, R.; Huang, Y.; Brankovic, S. R.; Strasser, P.; Phys. Chem. Chem. Phys.2014, 16, 18866.
30. Kozlowska, H. A.; Comprehensive Treatise of Electrochemistry, Vol. 9; Yeager, E. B.; Bockris, J. O.’M.; Conway, B. E.; Sarangapani, S., eds.; Plenum Press: New York, 1981, pp. 2. 31. Bligaard, T.; Nørskov, J. K.; Electrochim. Acta2007, 52, 5512.
32. Barbosa, A. F. B.; Oliveira, V. L.; van Drunen, J.; Tremiliosi-Filho, G.; J. Electroanal. Chem.2015, 746, 31.
33. Kim, H. J.; Choi, S. M.; Green, S.; Tompsett, G. A.; Lee, S. H.; Huber, G. W.; Kim, W. B.; Appl. Catal., B2011, 101, 366.
34. Ehteshami, S. M. M.; Chan, S. H.; Electrochim. Acta2013, 93, 334.
35. http://www.platinum.matthey.com, accessed in March 2016. 36. Holt, C. C. In Forecasting Seasonals and Trends by
Exponentially Weighted Moving Averages; ONR Memorandum, Carnegie Institute of Technology: Pittsburgh, PA, 1957. 37. Winters, P. R.; Manage. Sci. 1960, 6, 324.
38. http://www.worldbank.org/prospects, accessed in March 2016. 39. Gardner Jr., E. S.; Int. J. Forecast. 2006, 22, 637.
Submitted: January 19, 2016
Published online: March 22, 2016