Sandra Maria Ferreira Alves
PhD Thesis
Clinical indicators for quality improvement: the case of
femur fracture in Portugal
Dissertação submetida à Faculdade de Engenharia da Universidade do Porto para
obtenção do grau de Doutor em Engenharia Biomédica
Faculdade de Engenharia
Universidade do Porto
This thesis was supervised by:
Professora Doutora Maria de Fátima de Pina
FMUP – Faculdade de Medicina, Universidade do Porto;
INEB – Instituto de Engenharia Biomédica, Universidade do Porto; ISPUP – Instituto de Saúde Pública, Universidade do Porto;
and
Professor Doutor Bruno de Sousa
FPCE – Faculdade de Psicologia e Ciências da Educação, Universidade de Coimbra;
CDMT – Centro de Malária e Doenças Tropicais, Instituto de Higiene e Medicina Tropical, Universidade Nova de Lisboa
The host institution of this thesis was:
INEB – Instituto de Engenharia Biomédica Universidade do Porto, Portugal
The research described in this thesis was financially supported by:
FEDER funds through the Programa Operacional Factores de Competitividade –
COMPETE and by Portuguese funds through FCT – Fundação para a Ciência e a
Tecnologia within the framework of the project PEst-C/SAU/LA0002/2011 and by
v
ACKNOWLEDGEMENTS
To God.
To my family.
To my supervisor and friend Fátima, for the incentive, example and for caring.
To my co-supervisor Bruno. And to all that contributed to this work and taught me their “art”.
Sorry for messing your Christmas!
To the members of the Project, thank you all for your collaboration. A special thanks to Theo. To the Geoepidemiology group . Thank you guys!!! Ours is a special group. I’m proud to be in it! To all in INEB, a place of friendship were Science rules. A special thanks to Dulce!
To all my co-workers at ESTSP/IPP but specially to good friends, that will continue through life!
To the people of Biblioteca da Faculdade de Medicina, da Universidade de Coimbra, fundamental
help that goes beyond professional conduct, it is friendship.
To my grandparents, so important in my life!
To my parents, an example of strength and courage, the living proof that even starting off with
nothing we can end up with a lot. What we have is a lot, conquer by conquer! That is the life
example that I hope to pass on to the next generation.
To my husband, that took care of me, of us, during these passing clouds. Reminding me that the
path is the journey. Together we can make dreams come true.
To my lovely daughter. You are a special girl. Patience has its limits, right? Now we can play
together for several days.
vii
ABSTRACT
Hip fracture is the most common reason for admission to an acute orthopaedic ward, the majority can be related to osteoporosis and are more frequent above the age of 50 years, in women. Higher mortality and morbidity rates are the major consequences of hip fractures, higher amongst men. With the aging of the population the number of hip fractures tend to increase stretching the available resources.
The objectives of this study are: evaluate the trends of hip fracture incidence in Portugal and identify possible determinants, obtaining a quality measurement before the event and a risk adjustment for the treatment of hip fractures, as well as a characterization of the National Health Service (NHS) in terms of the treatment for this pathology, assessing the quality improvement after the fracture.
Data from the National Hospital Discharge Database was used. Mandatory for all Portuguese public hospitals since 1997, it compiles clinical and demographic information on all discharges. Hospitalizations from 1st January 2000 to 31st December 2008, caused by hip fractures (low energy, patients over 49 years of age) were selected and used as data in all the partial studies. National Authority of Medicines and Health Products (INFARMED) provided the data regarding the osteoporotic medication sales. Population data used to calculate incidence rates was obtained in the Statistics Portugal (INE). Generalized Additive (GAM) and Generalized Linear Models (GLM) were used in the assessment of hip incidence trend. Age-Period-Cohort Models and GAM were used to assess the period and cohort effect. A multilevel Bayesian model was used to obtain a risk adjustment, provide a comparison between providers and obtain a temporal trend on the probability of dying during hospitalization for hip fracture treatment.
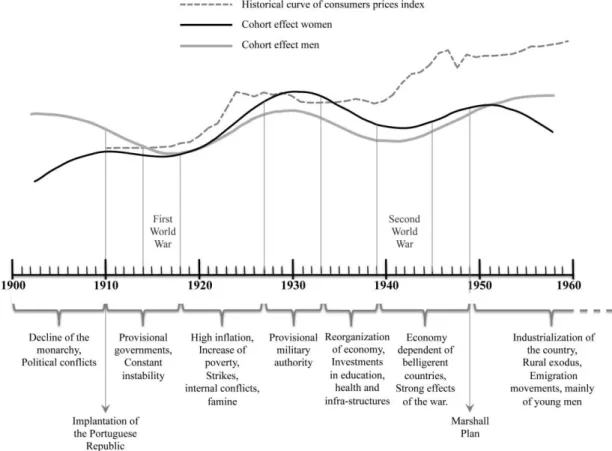
During the study period were selected 77,083 hospital admissions (77.4% women) caused by low energy, in patients over 49 years-age, mean age (standard deviation (SD)) at admission was 81.0 (SD 8.5) years old versus 78.0 (SD 10.1) (p-value < 0.0001) for women and men respectively. A turning point in 2003 was identified in the trend of hip fracture incidence in women. This abrupt decrease is compatible with the pattern of bisphosphonates sales. A cohort effect was identified both for men and women, the pattern highlighted changes in risk of hip fracture, on important points in the history of Portugal, statistical significant around 1930.
The probability of dying during a hospitalization to treat hip fractures was associated with individual characteristics’, women presented lower probability compared to men, even after adjustment for age, severity, treatment, time to surgery, length of stay, transfers (yes/no), hospital and area characteristics. No hospital effect was identified, hospitals that treat more than 50 hip fractures per year, have the same overall effect on the probability of dying.
Abstract
viii
The overall probability during the period did not presented changes. However some hospitals presented improvement.
This study provided an extensive analysis on the treatment of hip fractures, during a period of 9 years. The results are innovative and highlight possibilities of improvement as well as valuable information to health authorities.
ix
RESUMO
As fracturas do fémur proximal são a causa mais comum de admissão nos serviços de ortopedia, a sua maioria está relacionada com a osteoporose e são mais frequentes acima da idade de 50 anos, nas mulheres. As elevadas taxas de mortalidade e morbilidade são a maior consequência das fracturas do fémur proximal, apresentando-se mais altas entre os homens. Com o envelhecimento da população o número de fracturas tende a aumentar, acarretando uma elevada utilização dos recursos existentes.
Os objectivos este estudo são: a avaliação da tendência das taxas de incidência de fracturas do fémur proximal em Portugal e a identificação de possíveis determinantes da tendência, obtendo uma medida de qualidade antes da fractura. A obtenção de um ajuste de risco para o tratamento das fracturas, assim como uma caracterização do Serviço Nacional de Saúde (SNS), avaliando a qualidade do tratamento após a fractura.
Os dados da Base de Dados Nacional de Grupos de Diagnóstico Homogéneo relativos a altas hospitalares, contendo informação clínica e demográfica foram usados. As hospitalizações de 1 de janeiro de 2000 a 31 de dezembro de 2008, causadas por fracturas do fémur proximal (baixa energia e pacientes com idade superior a 49 anos) foram selecionadas e usadas nos estudos parciais. Os dados relativos à venda de medicamentos anti-osteoporóticos foram fornecidos pelo INFARMED - Autoridade Nacional do Medicamento e Produtos de Saúde. O Instituto Nacional de Estatística –INE foi a fonte para os dados populacionais que serviram para o cálculo das taxas de incidência. Modelos Aditivos e Lineares Generalizados (GAM e GLM) foram usados para avaliação das tendências da incidência de fracturas. Modelos Idade-Período-Coorte e GAM foram usados para a avaliação da existência de efeitos período e coorte. Um modelo Bayesiano hierárquico foi usado para obter o ajuste de risco, comparar entre hospitais e obter a tendência temporal da probabilidade de morrer durante a hospitalização para tratamento da fractura do fémur proximal.
Durante o período em estudo foram seleccionadas 77,083 admissões hospitalares (77.4% mulheres) com diagnóstico de fractura do fémur proximal, causada por baixa-energia e em doentes com mais de 49 anos de idade, idade média na admissão (desvio padrão DP) foi 81.0 (DP 8.5) versus 78.0 anos (DP 10.1) (valor-p <0.0001) para mulheres e homens respectivamente.
Uma alteração brusca foi identificada na tendência das fracturas nas mulheres, no ano de 2003 compatível com o padrão de vendas de bisfosfonatos. Foi identificado um efeito coorte que reflecte alterações de risco nos principais momentos históricos da história de Portugal,
Resumo
x
A probabilidade de morrer durante a hospitalização para tratamento da fractura do fémur, proximal está associada com as características individuais dos indivíduos, sendo que as mulheres mesmo depois do ajuste apresentam um valor mais baixo quando comparado com o dos homens. Não foi identificado nenhum efeito do hospital, hospitais que tratam mais de 50 fracturas por ano, têm um efeito semelhante na probabilidade de morrer. A tendência temporal da probabilidade de morrer no hospital, não sofreu alterações durante o período de estudo. No entanto, alguns hospitais mostraram melhorias.
Este é um estudo exaustivo do tratamento de fracturas do fémur proximal, durante um período de 9 anos. Os resultados são inovadores, assinalam possibilidades de melhoria e apresentam informações importantes para as autoridades de saúde.
xi
Contents
CHAPTER I ... 1
Introduction ... 1
CHAPTER II ...11
Clinical Indicators for quality improvement – the case of hip fractures ... 11
CHAPTER III ...25
Osteoporotic hip fractures: bisphosphonates sales and observed turning point in trend. A population- based retrospective study ... 25
CHAPTER IV ...47
Age-period-cohort effects in the incidence of hip fractures: political and economic events are coincident with changes in risk ... 47
CHAPTER V ...73
The unaccounted role of macro economic variables: meta-regression to explain in-hospital fatality rates following hip fractures... 73
CHAPTER VI ...91
In-hospital fatality following a hip fracture improving opportunities: where should the focus be? ... 91
CHAPTER VII ... 115
CHAPTER I
3
Motivation
The fractures that occur in the proximal part of the femur are also designated hip fractures and can be further classified according to their location; figure 1 is illustrative of the different classification of hip fractures [1]. The majority of hip fractures occur in individuals with fifty or more years-old, mainly due to the reduction of bone mineral density that may lead to osteoporosis [2]. Better conditions of life and healthcare led to an increase of life expectancy in European countries [3], which consequently leads to a higher number of population at risk of sustaining a hip fracture. According to the Statistics Portugal-INE (Instituto Nacional de Estatística), the Portuguese population over the age of 64 suffered an increase of 18.69% from 2001 to 2011 [4].
Figure 1: Classification of hip fractures. Reproduced from Parker and Johansen, 2006 [1]
Hip fracture is the most common reason for admission to an acute orthopaedic ward [1] and with the aging of the population the number of hip fractures tend to increase stretching the available resources[5, 6]. In addition, osteoporotic hip fractures present high mortality and morbidity rates [2, 7]. In a period of three years (2000 – 2002) it were treated in hospitals of the National Health System (NHS) 36, 846 cases representing a cost of about 185 hundred thousand Euros. From these patients about 5.6% died while in the hospital [8]. The morbidity and mortality
Chapter I
4
rates after discharge are not easy to assess because the majority of patients recover at home and in Portugal it is not possible to have a database linkage between health databases. However a cohort study conducted in one of the major hospitals in Portugal, during one year, reported at one year follow-up a mortality rate of 23 and 37 per 100 patients in women and men, respectively and that 30% of the patients were in bed confinement [9]. There are studies that report that 80% of women aged 75 years and older preferred death over the loss of independence after the fracture [10].
The interest in quality of health care has been increasing in most health care systems around the world. However, there are countries that still do not assess the quality of care delivered to their citizens [11].
Quality of care can be defined as “the degree to which health services for individuals and populations increase the likelihood of desire health outcomes and are consistent with current professional knowledge” [12] cited by [11]. One way to assess quality of care is through the use of indicators, that can be defined as “measurements tools, screens, or flags that are used as guides to monitor, evaluate, and improve the quality of patient care, clinical support services and organizational function that affect patient outcome” [13] cited by [11]. Clinical indicators can be related to several steps in health care process; therefore there can be structure, process and outcome indicators [11, 14]. Structure indicators are related to the attributes of the material resources and organizational structure. Process indicators are related to the actions in giving and receiving care and finally outcome indicators are related to the description of the effects of care [11, 14]. The outcome of care results from a variety of factors that are not necessarily linked to the quality of care received (e.g. severity of the patient). It is therefore important to adjust the indicators for possible confounders to obtain a fair result.
Clinical indicators should measure areas that contribute with high mortality and morbidity, with high costs in care and that have potential for improvement [15, 16]. Hip fracture is a clinical area that presents all those characteristics.
This study aimed to assess preventive treatment as well as the actual treatment received after a hip fracture.
Preventive treatment, by definition can incorporate a number of different actions that aim to promote and maintain health and prevent disease and disability [17]. Fall prevention, which would be one of the most effective preventive actions [18] is difficult to assess in Portugal, nationwide, because there is not a global strategy or a systematic approach to this preventive measure. Pharmacological treatment is also considered a vehicle to prevent fractures in the elderly, with highest clinical and cost effective results when targeted at those who are at higher risk [18]. These preventive actions would reflect on hip fracture incidence and Portugal would have a measure of preventive treatment for hip fracture.
However, the trend of hip fracture rate can be driven by other factors not directly related to the specific treatment of hip fractures. General health status of the population, life and nutritional
5 conditions, changes in body mass index [18], could serve as confounders to assess the underlying quality of treatment, therefore it is necessary to address the problem from several perspectives to have a better understanding of the indicator.
After the occurrence of the hip fracture, there is established evidence that surgical treatment is better than conservative [19]. Patients with hip fracture are always hospitalized for treatment, even if the treatment received in the hospital will be conservative, which maybe the result of a balance decision of either providers or the patient or family. As mentioned previously the non-existence of database linkage between different health databases in Portugal is a limitation to the outcome measures that can be assessed. In-hospital fatality is available and has been used as outcome measures for hip fracture treatment. The interpretation of the care provided to hip fracture is based on the three-way approach to quality proposed by Donabedian [20, 21], where quality of care should be evaluated using structure, process and outcome indicators, stringed because “good structure increases the likelihood of good process, and good process increases the likelihood of a good outcome” Donabedian (1988). In this perspective better outcomes are a result of both patient characteristics but also procedures and resources associated to providers.
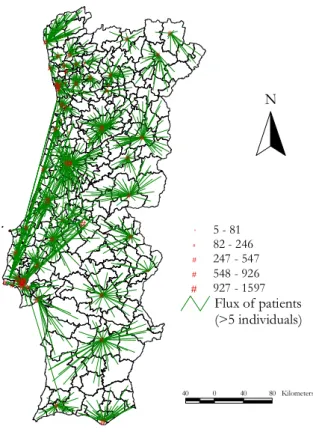
In a previous study, conducted between 2000 and 2002 [8], there were 92 different hospitals with discharges related to the treatment of hip fractures, in figure 2 their location is displayed with a circle proportional to the number of cases treated (it were excluded hospitals with less than 5 cases). In this figure is also displayed the flux of patients from place of residence to the hospitals.
Chapter I 6 # # # # ## # # # # # # # # # # # # # # # # # # ### # # # # # # # # # # # # # # # # # # # # # # # # ## # # # # # # # # # # # # # # # # # # # # # # # # # # # # # # N 40 0 40 80 Kilometers # 5 - 81 # 82 - 246 # 247 - 547 # 548 - 926 # 927 - 1597 Flux of patients (>5 individuals)
Figure 2: Map of flux of patients with hip fracture: place of residence to hospital of admission, period 2000-2002. Reproduced from Alves, 2005 [8]
Hospitals will differ not only in the amount of patients treated, which can be a measure of their expertise, but also in the resources and actual procedures. Therefore in order to have a feasible indicator for the treatment of hip fracture in Portugal it is important to consider these variations.
7
Objectives
The main objectives of this work are: evaluate the trends of hip fracture incidence in Portugal and identify possible determinants, obtaining a quality measurement before the event) and a risk adjustment for the treatment of hip fractures, as well as a characterization of the National Health Service (NHS) in terms of the treatment for this pathology, assessing the quality improvement after the fracture.
The following research questions need to be attended: What is the time trend of hip fracture incidence? What are possible determinants for such trend?
Interventions? Cohort effect?
What are the determinants of in-hospital fatality (outcome indicator)? Economic?
Structure (human and material resources available)? Patient’s medical status?
Procedures?
Are there differences in the quality of hip fracture treatment in Portuguese hospitals? If the hospitals had the same economical, structural, complexity of patients and preformed the same procedures what would be their fatality experience for patients with hip fractures related hospitalizations?
Are there time trends of in-hospital fatality following a hip fracture?
The strategy will be to divide the focus of the study in two parts. The first part will address the determinants of incidence as a way to achieve the understanding of treatment before the fracture event. The second part will address the determinants of an unfavorable outcome: in-hospital fatality as a way to achieve the understanding of treatment after the fracture event.
Chapter I
8
Thesis Synopsis
The work presented in this thesis is organized in the following chapters:
Chapter II, state of art, provides a definition of clinical indicators, the importance of risk adjustment and a general overview of the existent indicators for the treatment of hip fractures in several countries. Chapters III to IV present the four scientific articles produced in the context of this thesis.
Chapter III and IV contain the research conducted to address the questions related to the treatment before the fracture event (preventive treatment). First it was conducted a temporal study of hip fracture incidence in Portugal, by sex and age group that revealed an abrupt turning point compatible with pharmacological interventions existent in Portugal. The evolution of medication related to osteoporosis was assess during the same period and the number of bisphosphonates packages sold seem to be plausible explanation for the turning point observed in age standardized incidence rates in women. Chapter III describes this study.
Chapter IV describes the work conducted in order to separate the effect of age, period and cohort in the trend of hip fracture incidence. The study revealed that in fact the year of diagnose had a non-linear effect on hip fracture incidence rates, for women, with a turning point, regardless of age and cohort effect. And identified a cohort effect that presented alterations in all the major moments of the History of Portugal, suggesting a long-term effect on population health of the political and economic actions suffered in the life-time of the patient.
The work developed in order to understand the quality of treatment after the fractures is described in Chapter V and VI. First, and through a systematic review, some macro-economic variables were explored has determinants for in-hospital fatality rates, as described in Chapter V.
In Chapter VI, it is described the adjustment performed as well as the characterization of the SNS regarding the outcome following a hip fracture. The probability of dying while hospitalized, for the treatment of a hip fracture, was manly associated with individual characteristics’. No hospital effect was identified, however some hospitals presented some improvement.
Finally, chapter VII provides a general discussion and conclusions from the work develop in this thesis, and some perspectives for further research work.
9
References
[1] Parker M, Johansen A. Hip fracture. BMJ 2006;333: 27-30.
[2] Jordan KM, Cooper C. Epidemiology of osteoporosis. Best Pract Res Clin Rheumatol 2002;16: 795-806.
[3] Eurostat. Life expectancy at age 65, by gender. In; 2012.
[4] INE. Instituto Nacional de Estatística [National Institute of Statistics]. In; 2012.
[5] Melton LJ, 3rd, Johnell O, Lau E, Mautalen CA, Seeman E. Osteoporosis and the global competition for health care resources. J Bone Miner Res 2004;19: 1055-8.
[6] Sirois MJ, Cote M, Pelet S. The burden of hospitalized hip fractures: patterns of admissions in a level I trauma center over 20 years. J Trauma 2009;66: 1402-10.
[7] Melton LJ, 3rd. Adverse outcomes of osteoporotic fractures in the general population. J Bone Miner Res 2003;18: 1139-41.
[8] Alves SM. Epidemiological descriptive study of osteoporosis in Portugal, using geographical Information System. In: Faculty of Engineering. Porto: University of Porto; 2005. [9] Campos S. Longitudinal study of the incidence of proximal femur fractures in São João Hospital: one year follow-up. In: Faculty of Engineering. Porto: University of Porto; 2011.
[10] O'Neill TW, Roy DK. The epidemiology and scale of the problem. Hosp Med 2003;64: 517-20.
[11] Mainz J. Defining and classifying clinical indicators for quality improvement. Int J Qual Health Care 2003;15: 523-30.
[12] Medicare: A Strategy for Quality Assurance. Washington, DC: National Academy Press; 1990.
[13] Canadian Council on Health Service Accreditaion. A guide to the development and use of performance indicators. Ottawa: Canadian Council on Health Service Accreditaion; 1996.
[14] Brook RH, McGlynn EA, Shekelle PG. Defining and measuring quality of care: a perspective from US researchers. Int J Qual Health Care 2000;12: 281-95.
[15] McGlynn EA, Asch SM. Developing a clinical performance measure. Am J Prev Med 1998;14: 14-21.
[16] Rubin HR, Pronovost P, Diette GB. From a process of care to a measure: the development and testing of a quality indicator. Int J Qual Health Care 2001;13: 489-96.
[17] A Dictionary of Epidemiology Fourth Edition ed. Oxford: Oxford University Press; 2001. [18] Woolf AD, √Ökesson K. Preventing fractures in elderly people. BMJ 2003;327: 89-95. [19] Beaupre LA, Jones CA, Saunders LD, Johnston DW, Buckingham J, Majumdar SR. Best practices for elderly hip fracture patients. A systematic overview of the evidence. J Gen Intern Med 2005;20: 1019-25.
Chapter I
10
[21] Donabedian A. Evaluating the quality of medical care. The Milbank Quarterly 2005;84: 691-729.
CHAPTER II
Clinical Indicators for quality improvement – the case of hip
fractures
Chapter II
13
Clinical Indicators for quality improvement – the case of hip
fractures
Introduction
The economic difficulties that our society is facing raise the discussion of quality of care. In health, more than any other field, it is vital to achieve high results, meet high standards, reach the greatest effectiveness and nowadays, more than ever, with the lower costs. In order to assure that the results are met, the assessment measures should be effective. Clinical indicators work as tools to flag situations that potentially need intervention.
Hip fractures implications can be measured at individual or societal level. The effect on a patient can go from loss of previous functional status to a more dramatic outcome of death. However, there are also burdens to society, a surgery to treat a hip fracture is a costly procedure, followed by a rehabilitation that may require specialized help or permanent assistance. Good practices are desirable, the protocols should be followed however the routine producers should be consistently measured and object of systematic analysis, as they may lead to improvement on desirable outcomes and effectiveness of treatment.
Clinical indicators. What are they? And why use them?
Medical care was considered, for a long time, a simple process between the physician and the patient. The treatment process did not seem influenced by external factors, depending only upon biological and psychological variables [1]. With the generalization of health care and the exponential rise of information available the concept of health, itself, suffered alterations and gain a wider amplitude, as is currently viewed as "a state of complete physical, social and mental well-being, and not merely the absence of disease or infirmity", World Health Organization 1946[2]. Therefore, it is recognized that the state of health is influenced not only by health related factors, such as genetic (intrinsic) or promotional aspects (extrinsic), but also by external elements such as economic or social factors [2]. Hence, the process began to be understood as multidimensional, comprising all stakeholders: practitioners, patients and community.
The new paradigm of health and the flow of information led, inevitably, to question the variations in clinical practice [1] and how to measure it. Since the medical care is now considered multidimensional [3, 4], so should be the assessment, and this is the basic idea behind the system-based framework of structure, process and outcome, first proposed by Donabedian [3, 5] for quality of care assessment. This three-way approach sets the entire process of health care divided into parts
Chapter II
14
stringed because “good structure increases the likelihood of good process, and good process increases the likelihood of a good outcome” Donabedian (1988).
The measurement is accomplished through the use of clinical indicators “measurements tools, screens, or flags that are used as guides to monitor, evaluate, and improve the quality of patient care, clinical support services and organizational function that affect patient outcome” [6] cited by [4] that give tangible reflections of health care. Structure indicators are related to the attributes of the material resources and organizational structure. Process indicators are related to the actions in giving and receiving care and finally outcome indicators are related to the description of the effects of care [4, 7].
Clinical relevant indicators are the ones that apply to an health issue that contributes significantly to morbidity or mortality, is associated with high utilization rates or present high treatment costs [8]. Ideally, the health issue should have potential for improvement, however any act of care can have quality assessed, and with the cost constrains it is important to do so, to assure the necessary structural means.
In order to implement indicators, it is necessary very specific criteria and it is important to understand every action under the three aspects of quality of care. A thorough detail provides a better chance to achieve a feasible indicator that truly translates care. Indicators measuring structure quality represent organisational factors where care takes place [3] and can be classified in physical and staff characteristics [9]. The facilities, equipment, economic resources and the organisational structures underlying all these are grouped under the physical characteristics; number and qualification of personnel are under the staff characteristics, however the organisational aspects of these fall into the first group [9]. These aspects do not assure the quality of care but provide an opportunity to receive it.
The real actions of giving and receiving health are represented by process indicators [3] that similar to structure can also be divided into two groups clinical and inter-personal care. In the first category are actions related to the biomedical aspects of healthcare, more technical actions: like activities involved both with diagnosis and treatment, including the information retrieved by clinical history and that obtained by examinations as well as the appropriateness of therapeutic procedures based on such information. In the second category are the aspects related with interactions between patients and care givers [9]. Having these marked differences, indicators from the two categories must have different scientific areas in the background; the knowledge behind the indicators regarding clinical aspects must derive from health sciences, whereas the indicators regarding interpersonal aspects should derive from social/ behavioural sciences [3].
To better obtain a process indicator it is compulsory to look at the strength of the scientific evidence and the cost-effectiveness of the indicator process [8], there are many indicators that
Chapter II
15 follow evidence based guidelines [10]. Scientific evidence may be assessed through published literature or directly through organizations that have that mission, like the Cochrane Collaboration. This organization sets to provide the best evidence for health care [11], trough the preparation, update and promotion of reviews that will help healthcare providers to set guidelines, policy makers to promote indicators, and patients to be a part of the decisions.
Some areas of interest may produce more precise indicators than others, number of hospital beds (structure indicator) is a direct measure in contrast to scales of patient satisfaction (process indicator) [12], however both are important and none should be disregarded.
Finally, outcome measures, which are related to the effect on population and patients health status and can be also divided into two categories: health status and user evaluation [9]. Recovery, restoration of functional status or survival can be considered health status related; Improvement of patients knowledge, changes in patients behaviour or patients satisfactions can be considered a wider class of health status [3] falling into user evaluation category. Whilst it is possible to report the indicators considering a positive approach, the majority of studies published in the literature use the negative side of these standards as measures [13] such as mortality, or fatality rates. Reason for this choice may be related to the objectivity of the measure “death of patient” comparing to others like “satisfaction of patient”. It is easier and less subject to errors to assess the death rather than the restoration of physical status.
The multidimensional core of health and health care should lead stakeholders to the use of several indicators, for all three dimensions. However, these do not invalidate the discussion to set a hierarchy between dimensions. The most sensitive one regards process versus outcome indicators.
Outcome indicator is the ultimate health indicator as it is a reflection of all steps in care [3], including those that are harder to measure, such as technical expertise [14], this however may also be pointed as a negative aspect as it may blind parts that need immediate interventions. Another positive aspect of using outcome measures is the availability of data, at least for the calculation of simple rates. Summing to the negative aspects are the possible lag time between outcomes and interventions, as it may take some years following treatment to develop the outcome [9] as well as the dependency upon other factors such as patient characteristics [10]. Moreover, differences in outcome measures can also be a reflection of differences in measurement, it is therefore important to clearly define cases, outcome and risk factors [14], or even chance, as it may be influenced by number of cases and frequency with which the outcome occurs.
A number of outcome indicators are based on rates, only valid for comparison if based upon a relatively large denominator, overcoming the “Problem of Small Numbers”. This problem is described as the random fluctuation that occurs on rates, by the variation of the numerator in a few cases when the denominator is not sufficient large. This problem may occur when calculating some
Chapter II
16
indicators in small hospitals and aggregation of hospitals or time aggregation may not be a cleaver solutions, because it crashes the possibility of identification of good and bad practices [15]. A solution may be the use of several indicators at a time, namely the use of some that does not take the form of a rate, for instance, Length of Stay (LOS).
Process indicators on the other hand are only valid if they predict the outcome [9, 10], but can instantly be produced following the care, and therefore preventive measures upon bad actions can be immediately taken, instead of waiting for an outcome to be produced. Another positive aspect when using process indicators is the fact that variations in the indicator are more dependent upon differences in care and are easier to interpret [14]. In many cases these indicators are related to actions such as “nutritional status assessed” rather than “hospital specific mortality rate”.
Accounting for all these positive and negative aspects and proposed solutions, ideally it is best to include in any assessment system indicators from the three dimensions, as they are complementary and maybe easier to get a correct interpretation of the findings [3].
The use of indicators provides a chance to understand quality in health care, at several levels. Their use is important to use as aim to translate and produce knowledge [14], namely:
Improve the quality of care of a health care facility; Identify poor performers to protect public safety;
Provide consumer information to facilitate choice of health care provider; Inform policymakers at a regional or national level.
In order to meet their goals, indicators should be thoroughly analysed and all possible bias controlled. The first string in the chain: structure is less subject to external influence of other variables; however both process and outcome indicators are disturbed by a variety of variables that have nothing to do with the quality of care received. The severity of the patients treated is one aspect that may affect the final measure and may not lead to linear conclusions, of better care leading to better measure in the indicator; a unit may be performing worse than a similar just because the patients treated there had a more complicated situation, and not because the quality of care was worse. This fact may lead to erroneous conclusions, as the final measure may be biased. The adjustment of the indicators plays, therefore, an important role in the final achievement of fair and reliable measures.
Chapter II
17
The importance of risk adjustment
The use of indicators to compare efficiency and costs across providers or to compare internally the patient outcome to motivate quality improvement within a provider is to be done carefully. Situations where a better position regarding the result of an indicator represent a better care are not straightforward, since indicators are influenced by other aspects aside from quality of care. Some indicators are more subject to the influence of external factors than other; namely outcome indicators are more sensitive than process indicators to other covariates [16], so the following description is centred on outcome indicators. Outcome measures may be considered a function of quality of care and other covariates, as proposed by Iezzoni, 2003 [17],
Outcomes = f (intrinsic patients related risk factors, treatment effectiveness, quality of care, random chance)
The purpose of risk adjustment is to remove sources of variation leaving residual differences to reflect the quality of care [18]. Risk adjustments can be performed considering different kinds of risk: clinical outcomes, resources used or patient centred outcomes. The first accounts for outcomes such as death or physical status, the second for costs or length of stay and finally the third account for satisfaction or expectations[19] .
There are some risk-adjustment methods already in use [18, 19] that differ firstly on the risk accounted for, some are focused in costs, others in clinical outcomes, others offer multiple versions for different outcomes [19]. A risk adjustor may predict one outcome but fail to predict another, it is therefore important to choose an adjustor design for the outcome [18, 19].
Risk adjustment may require additional data [8] than the one necessary to calculate the indicator, because the risk of an outcome is, as mentioned before, affected by several patient characteristics, including: demographic characteristics (age, sex, race and ethnicity), clinical factors (such as principal diagnosis and its severity, co-morbid illnesses), socioeconomic factors (such as cultural beliefs and behaviours, economic resources), health related behaviours and activities (such as tobacco use, alcohol consumptions) and attitudes and perceptions (overall health status and quality of life, preferences and expectations for health care services) [18, 20]. Adjusting for all characteristics is considered neither possible nor necessary [19]. The nature of data to be included in the adjustor, whether administrative, clinical or surveys, have a deep influence on the design, e.g, if a large dataset is available than indicators can be empirically developed in opposition to others that are solely based upon clinical judgment [19].
As mentioned, adjusting for all variables is impossible and unnecessary, the choice of what characteristics should be used to adjust is dependent of the outcome, however there are a few that
Chapter II
18
are almost universal. Age is a common variable in the adjustment, since it has almost always an effect, even after adjusting for other variables usually highly correlated like presence of chronic diseases[20]. Age may cause providers to question some forms of treatment and lead to differences in care. Sex is also usually considered in the adjustment, because some studies have reported gender differences namely on cardiovascular interventions: a higher mortality among women but fewer invasive interventions or therapeutic procedures.
Other variables may be a part of the adjustment model namely variables that predict acute clinical stability, translation of immediate risk of death [20]. APACHE – Acute Physiology and Chronic Health Evaluation and its variations is one, among other systems that produces a score to predict outcome of critical illness or injury [21], uses a small number of variables like: arterial oxygenation and respiratory rate.
Principal diagnose as well as the extent and severity of the co-morbidities, defined as the diseases that coexist to the condition of study [21], are important risk adjustors, patients with other coexistent diseases are at higher risk of a negative outcome. Instead of using every disease separately in the adjustment it can be used one of the many co-morbidity index [22], such as Charlson Index [23], that produces a scorethat reflects the likelihood of mortality and accounts for conditions like dementia, diabetes and myocardial infarction.
Building a risk-adjustment method from the scratch is demanding and very consuming, both time and financially, so the recommendation is to use one of the already developed and validated, as is or change it to fit the goals. The constrains of using a method that does not fit the purposes of the project completely, such as an extra caution in the results interpretation, are compensated with timely results [24]. In both cases it is necessary to combine clinical judgment (using published literature or with the help of experts) with the empirical modelling [24]; involving clinicians in the development brings clinical credibility to the statistical methods.
Clinical indicators in hip fracture treatment
In order to fulfil their objectives clinical indicators should measure areas that contribute with high mortality and morbidity, with heavy costs in care and that have potential for improvement [8, 16]; Hip fracture is a clinical area that presents all these characteristics for that reason many indicator projects have specific indicators for hip fractures.
Individual outcomes may be assessed in many ways for orthopaedic interventions on the hip, both generic, such as quality-of-life measures (SF-36 score, SF-12, EuroQol questionnaire,...), as well as hip-specific such as Harris hip scores ( a score ranging a possible of 100, indicating the best possible outcome and assessing pain, function any other areas) or the Oxford hip score (measuring
Chapter II
19 pain and functional and ranging from 12 to 60 points, a higher score translating a greater disability) [25]. These measures may be helpful in the achievement of the standards defined to the indicators.
In Portugal, the entity responsible to regulate Health (ERS – Entidade Reguladora da Saúde) built a system that aims to assess, objectively and consistently, the quality of care. This project, named SINAS [26] (Sistema Nacional de Avaliação em Saúde, National System of Health Assessment) is developed in cooperation with Siemens and the Joint Commission International (JCI- whose focus is on improving the safety of patient care [27]), as the indicators were developed by JCI. For orthopaedic area SINAS establishes 7 indicators:
Prophylactic antibiotic administration within one hour prior to surgery to patients submitted to total hip arthroplasty (THA) or total knee arthroplasty (TKA);
Selection of prophylactic antibiotic recommended for specific surgical procedure for THA or TKA;
Discontinued prophylactic antibiotics within 24 hours after surgery end time for THA or TKA patients;
Recommended venous thromboembolism prophylaxis for THA or TKA patients; THA or TKA patients who received appropriated venous thromboembolism
prophylaxis within 24 hours prior to anesthesia start time to 24 hours after anesthesia end time;
In-hospital mortality for patients surgical treated for hip fracture; Revisions to THA or TKA within 30 days after surgery.
This project aims to produce more and better information on the quality of the health system, a continual improvement of health care and empower patients [26], and applies risk adjustment methods.
Internationally, several agencies have been developing indicators for quality improvement, many of which related to hip fracture treatment. Examples of these are: Hip fracture fatality rate by the AHRQ – Agency for Healthcare Research and quality, United States of America, and is defined as the proportion of deaths of all discharged, age >= 18 years with a principal diagnosis code for fracture [28]. This indicator is categorized as an Inpatient Quality Indicator and reflects quality inside hospitals. The agency advices risk adjustments and provides both co-variables and the coefficients to implement the adjustment [29];
The International Quality Indicator Project that establishes its mission in assisting health care organizations in identifying opportunities for improvement in health care [30] and presents indicators for surgical site infections, antibiotic prophylaxis prior procedure, perioperative mortality, unscheduled returns to the operating room, thromboprophylaxis for surgery in hip arthroplasty.
Chapter II
20
In Denmark the Danish National Indicator Project that aims to “secure mutual grounding and methods for documentation and development of quality in the Danish health care system for the benefit of the patients”[31] has developed and validated a complete set of indicators for hip fractures. Six process indicators:
Proportion of patients who receive systematic pain assessment at rest and during mobilization using a pain scale;
Proportion of patients who are mobilized within 24 hours of the operation; Proportion of patients whose basis mobility is assessed prior to discharge;
Proportion of patients where a rehabilitation plan is produced including ADL (Activities of Daily Life) functional level prior to the fracture and an ADL functional level prior to the discharge;
Proportion of patients where decision has been made regarding medical treatment to prevent future osteoporotic fractures;
Proportion of patients where decision has been made regarding future fall prevention;
For these indicators the limits in standard of care are above 80% for all and above 90% for the majority. Another seven are available for outcome measurements, for the mortality indicator the project advises an adjustment.
Proportion of patients who survived at 30 days after admission (standard >= 90%); Proportion of patients with an osteosynthesised undislocated medial fracture who are
reoperated within 2 years (standard <= 15%);
Proportion of patients with an osteosynthesised dislocated medial fracture who are reoperated within 2 years (standard <= 30%);
Proportion of patients with an osteosynthesised subtrochanteric or trochanteric fracture who are reoperated within 2 years (standard <= 5%);
Proportion of patients with a hemi- or total alloplasty who are reoperated within 2 years (standard <= 10%);
Proportion of patients who are reoperated due to deep wound infection within 2 years (standard <=2%).
The Canadian Institute for Health Information developed three indicators related to accessibility to surgery and a model to adjust for risk. The indicators differ in the time period between admission and surgery [32]:
Proportion of patients age 65 and older with surgery within 48 hours of admission to hospital;
Chapter II
21 Proportion of patients age 65 and older with surgery on the day of admission or the
next day;
Proportion of patients age 65 and older with surgery on the day of admission, the next day or the day after;
The literature on hip fracture risk and management is used to develop and adjust indicators regarding delay of surgery, nutrition, delirium, patient characteristics, the intervention of interdisciplinary teams or hospital volume [33-39]. As quality is multidimensional any assessment should considered the various aspects involved in the treatment of hip fractures.
Conclusion
The use of indicators has proven to be effective in other areas, in health care the evidence is relatively scarce, perhaps due to considerable variation in the methods used [40]. On a systematic review [40] conducted in Medline and the Cochrane library, for papers published from January 1994 to January 2008, with the search expression of “quality indi*” followed by ”hospital care” or “quality improvement” only 21 were included and only one mention the hip/knee as the clinical area to measure [41]. However, hospital measurement needs to be assessed and clinical indicators are the most viable tools for that.
The importance of the indicators concerning hip fractures in hospital performance was recognised, in 2003, when the World Health Organization, launch a project PATH – Performance Assessment Tool for Quality Improvement in Hospitals [42], that developed a set of indicators where 3 concern hip fracture (mortality; readmission, length of stay) [43].
Chapter II
22
References
[1] Caper P. Defining Quality in Medical Care. Health Affairs 1988;7: 49-60. [2] WHO. In; 1946.
[3] Donabedian A. The quality of care How can it be assessed? JAMA 1988;260: 1743- 1748.
[4] Mainz J. Defining and classifying clinical indicators for quality improvement. International Journal for Quality in Health Care 2003;15: 523-530.
[5] Donabedian A. Evaluating the quality of medical care. The Milbank Quarterly 2005;84: 691-729.
[6] A guide to the development and use of performance indicators. Ottawa: Canadian Council on Health Services Accreditation; 1996.
[7] Brook RH, Mcglynn EA, Shekelle PG. Defining and measuring quality of care: a perspective from US researchers. International Journal for Quality in Health Care 2000;12: 281-295.
[8] McGlynn EA, Asch SM. Developing a Clinical Performance Measure American Journal of Preventive Medicine 1998;14: 14-21.
[9] Campbell SM, Roland MO, Buetow SA. Defining quality of care. Social Science & Medicine 2000;51: 1611-1625.
[10] Brook RH, McGlynn EA, Cleary PD. Quality of Health Care Part 2: Measuring Quality of Care. The New England Journal of Medicine 1996;335: 966-970.
[11] McBride T, Panrucker S, Clothier J. Hip fractures: public perceptions. Ann R Coll Surg Engl 2010.
[12] Peursem KAV, Pratt MJ, Lawrence SR. Health management performance A review of measures and indicators. Accounting, Auditing & Accountability Journal 1995;8: 34-70.
[13] Risk adjustment for measuring health care outcomes. Third Edition ed. Chicago: Health Administration Press; 2003.
[14] Mant J. Process versus outcome indicators in the assessment of quality of health care. International Journal for Quality in Health Care 2001;13: 475-480.
[15] Lied TR. Small Hospitals and performance measurement: implications and strategies. International Journal of Health Care Quality Assurance 2001;14: 168-173.
[16] Rubin HR, Pronovost P, Diette GB. From a process of care to a measure: the development and testing of a quality indicator. International Journal for Quality in Health Care 2001;13: 489-496.
Chapter II
23 [17] Iezzoni LI. Reasons for Risk Adjustment. In: Iezzoni LI, editor. Risk Adjustement for measuring health care outcomes. Third ed. Chicago: Health Aministration Press; 2003.
[18] Iezzoni LI. The Risks of Risk Adjustment The Journal of the American Medical Association 1997;278: 1600- 1607.
[19] Iezzoni LI. Getting started and defining terms. In: Iezzoni LI, editor. Risk Adjustment for measuring health care outcomes. Chicago: Health Administrator Press; 2003.
[20] Iezzoni LI. Range of risk factors. In: Iezoni LI, editor. Risk Adjustment for measuring health care outcomes. Chicago: Health Administration Press; 2003.
[21] A dictionary of epidemiology Fourth ed. New York: Oxford university Press; 2001. [22] D'Hoore W, Sicotte C, Tilquin C. Risk Adjustment in Outcome Assessemnt: the Charlson Comorbidity Index. Methods of Information in Medicine 1993;32: 382-387.
[23] Charlson ME, Pompei P, Ales KL, Mackenzie CR. A new method of classifying prognostic comorbidity in longitudinal studies: development and validation. Journal of Chronic Diseases 1987;40: 373-383.
[24] Daley J, Iezzoni LI, Shwatrz M. Conceptual and practical issues in developing risk-adjustment methods. In: Iezzoni LI, editor. Risk Adjustment for measuring health care outcomes. Chicago: Health Administration Press; 2003.
[25] Ashby E, Grocott MPW, Haddad FS. Outcome measure for orthopeadic interventions on the hip. The Journal of Bone & Joint Surgery (Br) 2008;90: 545-549.
[26] ERS. SINAS - Sistema Nacional de Avaliação em Saúde. In. [27] JCI. Joint Commission International. In.
[28] AHRQ. Guide to Inpatient Quality Indicators: Quality of care in Hospitals - Volume, Mortality and Utilization. version 3.1 ed: AHRQ; 2007.
[29] AHRQ. Risk Adjustment Coefficients for the IQI. Version 4.2 ed; 2010. [30] IQIP. International Quality Indicator Project. In.
[31] NIP. The Danish National Indicator Project In.
[32] CIHI. Health Indicators: Definitions, Data Sources and Rationale: CIHI; 2011. [33] Simunovic N, Deveraux PJ, Sprague S, Guyatt GH, Schemitsch E, DeBeer J, Bhandari M. Effect of early surgery after hip fracture on mortality and complications: systematic review and meta-analysis. Canadian Medical Association Journal 2010;182: 1609-1615.
[34] Eneroth M, Olsson UB, Thorngren KG. Nutritional supplementation decreases hip fracture-related complications. Clin Orthop Relat Res 2006;451: 212-7.
[35] Heikkinen T, Willig R, Hanninen A, Koskinen K, Mannismaki P, Alavaikko A, von und zu Fraunberg M, Jalovaara P. Hip fractures in Finland--a comparison of patient characteristics and outcomes in six hospitals. Scand J Surg 2004;93: 234-40.
Chapter II
24
[36] Shervin N, Rubash HE, Katz JN. Orthopaedic procedure volume and patient outcomes: a systematic literature review. Clin Orthop Relat Res 2007;457: 35-41.
[37] Furlaneto ME, Garcez-Leme LE. Impact of delirium on mortality and cognitive and functional performance among elderly people with femoral fractures. Clinics (Sao Paulo) 2007;62: 545-52.
[38] Chong CP, Savige JA, Lim WK. Medical problems in hip fracture patients. Arch Orthop Trauma Surg 2010;130: 1355-61.
[39] Escobar L, Escobar R, Cordero-Ampuero J. Previous medical problems in 326 consecutive hip fracture patients. Hip Int 2006;16: 57-61.
[40] DeVos M, Graafmans W, Meijboom B, Voort PVd, Westert G. Using quality indicators to improve hospital care: a revirew of the literature. International Journal for Quality in Health Care 2009;21: 119-129.
[41] Grossbart SR. What's the return? Assessing the effect of "pay-for-performance" initiatives on the quality of care delivery. Medical Care Research and Review 2006;63: 29 S-48S.
[42] Veillard J, Champagne F, Klazinga N, Kazandjian V, Arah OA, Guisset A-L. A performance assessement framework for hospitals: the WHO regional office for Europe PATH project. International Journal for Quality in Health Care 2005;17: 487-496.
[43] WHO. PATH Performance Assessement Tool for Quality Improvement in Hospitals. In: WHO, editor. Copenhagen; 2007.
CHAPTER III
Osteoporotic hip fractures: bisphosphonates sales and observed
turning point in trend.
A population- based retrospective study
27
Osteoporotic hip fractures: bisphosphonates sales and observed
turning point in trend.
A population- based retrospective study
Authors: Sandra Maria Alves, Theodoros Economou, Carla Oliveira, Ana Isabel Ribeiro, Nuno Neves, Enrique Goméz-Barrena, Maria de Fátima de Pina
Abstract
The aim is to examine the temporal trends of hip fracture incidence in Portugal by sex and age groups, and explore the relation with anti-osteoporotic medication.
From the National Hospital Discharge Database, we selected from 1st January 2000 to 31st December 2008, 77,083 hospital admissions (77.4% women) caused by osteoporotic hip fractures (low energy, patients over 49 years-age), with diagnosis codes 820.x of ICD 9-CM. The 2001 Portuguese population was used as standard to calculate direct age-standardized incidence rates (ASIR) (100,000 inhabitants). Generalized additive and linear models were used to evaluate and quantify temporal trends of age specific rates (AR), by sex.
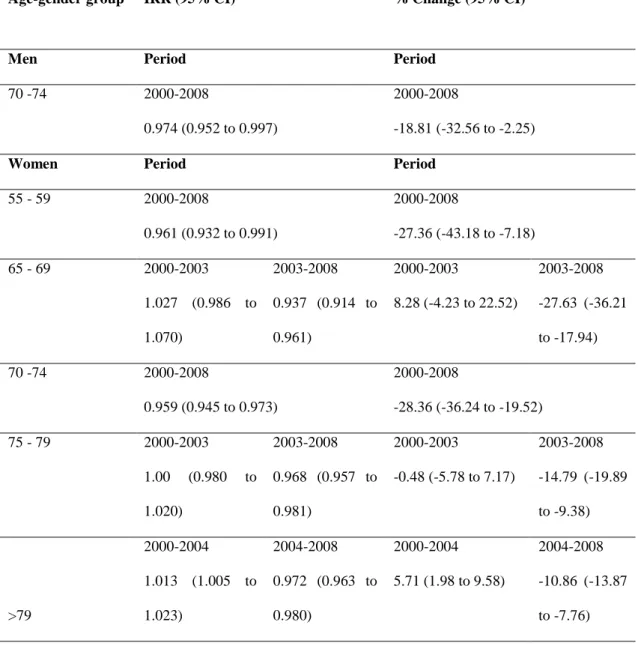
We identified 2003 as a turning point in the trend of ASIR of hip fractures in women. After 2003, the ASIR in women decreased on average by 10.3 cases/100,000 inhabitants, 95% CI (-15.7 to -4.8), per 100,000 anti-osteoporotic medication packages sold. For women aged 65-69 and 75-79 we identified the same turning point. However, for women aged over 80, the year 2004 marked a change in the trend, from an increase to a decrease. Among the population aged 70-74 a linear decrease of incidence rate (95% CI) was observed in both sexes, higher for women: -28.0% (-36.2 to -19.5) change vs -18.8%, (-32.6 to -2.3)..
The abrupt turning point in the trend of ASIR of hip fractures in women is compatible with an intervention, such as a medication. The trends were different according to gender and age group, but compatible with the pattern of bisphosphonates sales.
Keywords
Chapter III
28
Introduction
Identifying and understanding trends of hip fracture incidence is important, not only as a way for planning future medical resources and treating patients but also in planning effective preventive measures [1]. Costs related to hip fractures are not only restricted to hospitalization but also to the long recovery time and assistance that these patients require [2, 3]. Public health interventions can be taken using knowledge gathered from epidemiologic studies using secondary data. These studies can provide valuable information with the use of reliable data on a national basis [4, 5].
The bone quality impairment is associated to aging and elevates the risk of osteoporotic fractures, particularly in post-menopausal women. Furthermore, an excessive pathologic decrease in bone strength can be prevented either by the use of medicaments or by changing activity and nutritional behaviour [6]. Osteoporotic hip fractures are more common among women over the age of 49 years and grows exponentially with aging. With the increase of life expectancy the range of population at risk is considerable, enhancing the need to analyze trends by age groups. In 2008, life expectancy at age 65 in the European Union (27 member states) was 17.2 and 20.7 years for males and females respectively [7]. In Portugal, the same indicator with data from 2009-2011 was 16.9 and 20.2 respectively (last available data) [7, 8]. Moreover, the elderly form the fastest growing age group in most western countries thus aggravating the burden of osteoporosis.
In Portugal there are no national studies addressing the trend of hip fractures. However, internationally several studies have been conducted reporting trends of age-standardized incidence rates of hip fractures [1]. Nevertheless the results are not consensual: increasing, decreasing and stable trends have been reported, which may reflect different stages in the epidemic curve. The results regarding the shape of the trends as well an existing pattern in men have also differ. Studies in Finland [9] and Australia [10, 11] have reported rates of hip fractures compatible with a non-linear trend. However in Finland the decrease pattern was observed in both genders, whereas in Australia only women presented a decreasing pattern. Rates presenting linear decreases have been reported by studies in Belgium [12], Denmark [13], Canada [14], United States [15] for both genders and Spain just for women[16]. Unique causes are impossible to assess, nevertheless studies have pointed out different plausible reasons, according to their results, namely medication for osteoporosis [10, 11, 16] or other interventions [13, 14].
It is important to explore time trends of age-standardized incidence rates of hip fractures although they may hide different underlying trends by age groups thus leading to incorrect conclusions. And since hip fractures affect a wide range of ages, these studies may help uncover unequal patterns and meaningful associations with the preventive procedures undertaken by different countries.
29 The aim of this work is to examine the temporal trends of hip fracture incidence in Portugal by sex and age group, and explore its relation with anti-osteoporotic medication.
Materials and Methods
Study Area
The study area was Continental Portugal with a population of 10,135,309 inhabitants in 2008. In 2000 there were 3,298,922 inhabitants aged 50 years or over, increasing by 11.9% in 2008 (n= 3,691,104) [8], in contrast with a decrease of -0,6% in the population aged under 50 in the same period.
Data
Population data was the annual official estimates, per sex and 5-year age groups, except for 2001, which was a census year.
We used data from the National Hospital Discharge Register (NHDR). The use of this administrative database is mandatory since 1997 in all Portuguese public hospitals, and compiles information on all discharges such as gender, age, admission and discharge date; first cause of admission (and up to 19 secondary causes) coded according to the International Classification of Diseases, version 9, Clinical Modification (ICD9-CM); main diagnosis (and up to 19 secondary diagnoses), also coded according to the ICD9-CM; clinical interventions (up to 20); surgical interventions; hospital providing the care; outcome (deceased, discharge to home, discharge to another hospital); length of stay (LOS) and patient’s place of residence.
In Portugal, access to the national health-care system is free and universal and due to the high costs involved, hip fractures are primarily treated in public hospitals. Therefore hip fractures are highly documented and the NHDR records the total number of admissions with a diagnosis of hip fracture nationwide.
The quality of the NHDR is accessed regularly by both internal (hospitals) and external (ACSS – Central Administration of the National System) auditors [17].
We selected all discharges from 1st January 2000 to 31st December 2008 of individuals aged 50 years or over, with a diagnosis of hip fracture (codes ICD9-CM 820.x) caused by a low or moderate trauma. We excluded cases of bone cancer, readmissions for orthopedic after-care or complications in surgical and medical care (codes ICD9-CM: 170.x, 171.x, V54.x, 996.4), the exclusion expression was applied to all 20 fields containing diagnosis, and represented 0.8% of the cases. To account for misclassification on the diagnosis field other actions were taken, namely revisions were excluded based on procedures codes (81.53 Revision of hip replacement, not
Chapter III
30
otherwise specified) representing a total of 0.08% of the cases. In addition we also excluded cases with length of stay inferior to 5 days, that did not went to a surgery and that were transferred to another hospital, because the first hospitalization could be just to stabilize the patient, these represent 1.1% of the cases.
In Portugal it is not possible to have databases linkage between NHDR and prescriptions so the data on medication was only available for the entire population, and therefore it was not possible to access sales desegregated by sex and age groups, or have the number of patients treated. Data was provided by the National Authority of Medicines and Health Products (INFARMED). We analyzed, on a national level, the number of anti-osteoporotic medication packages sold from 2000 to 2008 through prescriptions made in the National Health System (NHS). We used the total number of anti-osteoporotic medication for the entire population to explain the trend of hip fractures in women, based on our preliminary results that showed no increasing or decreasing trends in ASIR for men. The stable incidence rates of hip fractures among men is compatible with
the low prescription of anti-osteoporotic medication for men identified in other countries [12] and information contained in Portuguese national guidelines [18, 19] which focus the prevention of osteoporosis in women. The medications analyzed were those indicated as agents that can act on the inhibition of bone loss or promote directly bone formation [20, 21] with a high evidence level of reducing the risk of a hip fracture: bisphosphonates, calcitonin, hormonal replacement therapy (HRT), Strontium ranelate and Selective Estrogen Receptor Modulators (Reloxifene) as well as vitamin D (recommended to be prescribed in association with the medications mentioned [19]).
We used the Portuguese population from the 2001 census, available from Statistics Portugal (Instituto Nacional de Estatística – INE) as the standard for calculating the direct age-standardized incidence rates (ASIR) per 100,000 inhabitants by gender.
We calculated age-specific rates (AR) by gender, using population counts in the census year of 2001 and official estimates for all the other years. Five-year age groups were used from 50 to 84 years of age and a wider group comprising all patients older than 84.
In addition, we calculated the 95% Confidence Intervals (95% CI) for each rate according to the methods described in Morris and Gardner (2000) [22].
Statistical Analysis
We used Generalized Additive Models (GAMs) to investigate changes in the trends of incidence rates. These models are flexible as they incorporate a non-parametric component that is implemented using spline functions (smoothers) and can reveal possible non-linearities in the effect of the predictors [23]; for this study we were interested in the possible non-linear effect of time in the incidence rates. The GAMs were used in an exploratory manner [24] to identify visually the
![Figure 1: Classification of hip fractures. Reproduced from Parker and Johansen, 2006 [1]](https://thumb-eu.123doks.com/thumbv2/123dok_br/15184565.1016218/15.892.271.688.438.922/figure-classification-hip-fractures-reproduced-parker-johansen.webp)