http://dx.doi.org/10.1590/0100-2945-027/14
THE PEAR TREE RESPONSE TO PHOSPHORUS
AND POTASSIUM FERTILIZATION
1GUSTAVO BRUNETTO2, GILBERTO NAVA3, VÍTOR GABRIEL AMBROSINI4, JUCINEI JOSÉ COMIN5, JOÃO KAMINSKI2
ABSTRACT – The aim of this study was to evaluate the response to phosphorus (P) and potassium (K) fertilization and to establish the critical levels of P and K in the soil and in the plant tissue in pear trees. Two experiments were conducted in São Joaquim (SC), Brazil. In experiment 1, the plants received annually the application of increasing rates of phosphate fertilizer (0, 40, 80, 120 and 160 kg P2O5 ha-1), while in experiment 2, increasing rates of potassium fertilizer (0, 40, 80, 120 and 160 kg K2O ha-1) were applied annually. In the two experiments, soil was collected annually from the 0-10, 10-20 and 0-20 cm layers, and the available P (experiment 1) and exchangeable K (experiment 2) content was analyzed. Whole leaves were collected annually, which were subjected to analysis of total P (experiment 1) and total K (experiment 2) content. The number and weight of the fruits per plant and fruit yield were evaluated. Application of P on the soil planted with pear trees increased the nutrient content in the soil and, in most crop seasons, in the whole leaf, but it did not affect the yield components and fruit yield. The application of K on the soil with pear trees increased the nutrient content in the soil and, in most of the crop seasons, in the whole leaf, but the potassium content in the whole leaf decreased in the crop season with greater fruit yield. The yield components and fruit yield were not affected by K fertilization.
Index terms: Pyrus communis L., sufficiency level, phosphate fertilization, potassium fertilization, yield.
RESPOSTA DA PEREIRA À APLICAÇÃO DE FÓSFORO E POTÁSSIO
RESUMO - O trabalho objetivou avaliar a resposta à adubação com fósforo (P) e potássio (K) e estabelecer o nível crítico no solo e no tecido de P e K em pereira. Dois experimentos foram conduzidos em São Joaquim (SC). No experimento 1 as plantas receberam anualmente a aplicação de doses crescentes de fertilizante fosfatado (0; 40; 80; 120 e 160 kg de P2O5 ha-1), enquanto no experimento 2 foram aplicadas anualmente doses crescentes de fertilizante potássico (0; 40; 80; 120 e 160 kg de K2O ha-1). Nos dois experimentos foi coletado anualmente solo nas camadas de 0-10; 10-20 e 0-20 cm, onde foi analisado o teor de P disponível (experimento 1) e K trocável (experimento 2). Anualmente foram coletadas folhas completas que foram submetidas à análise do teor total de P (experimento 1) e K (experimento 2). Avaliaram-se o número e a massa dos frutos por planta e a produção de frutos. A aplicação de P no solo cultivado com pereira incrementou o teor do nutriente no solo e, na maioria das safras, na folha completa. Porém, o incremento do teor de P disponível no solo e na folha não foi acompanhado de aumentos nos componentes de produção e na produção de frutos, impossibilitando o estabelecimento do nível crítico de P no solo e no tecido. A aplicação de K no solo aumentou o teor do nutriente no solo e, na maioria das safras, na folha completa da pereira, mas o teor de K na folha completa diminuiu na safra com maior produção de frutos. O incremento de K trocável no solo e na folha não foi acompanhado de aumentos nos componentes de produção e na produção de frutos, não permitindo o estabelecimento do nível crítico de K no solo e no tecido.
Termos de indexação: Pyrus communis L., nível de suficiência, adubação fosfatada, adubação potássica, produção.
1(Trabalho 027-14). Received on:16-01-2014. Accepted for publication on: 24-03-2015.
2 Agronomist, Doctor in Soil Science, Prof. of the Rural Sciences Dep. and of the Graduate Studies Program in Soil Science of the
Universidade Federal de Santa Maria .Santa Maria-RS, Brazil. Fellowship Holder in Research Productivity from the CNPq, Emails: [email protected], [email protected]
3Agronomist, Doctor in Soil Science and Plant Nutrition, Researcher of the Empresa de Pesquisa Agropecuária e Extensão Rural de
Santa Catarina S.A. (EPAGRI). São Joaquim, SC-Brasil, E-mail: nava@ epagri.sc.gov.br
4Agronomist, Master’s degree student in the Graduate Studies Program in Agroecosystems of the Universidade Federal de Santa Catarina
(UFSC) .Florianópolis-SC, Brazil. E-mail: [email protected]
5 Agronomist, Doctor, Professor of the Rural Engineering Department and of the Graduate Studies Program in Agroecosystems of
INTRODUCTION
Definition of the need for fertilization and the nutrient rate in pear (Pyrus communis L.) tree in the states of Rio Grande do Sul (RS) and Santa Catarina (SC), Brazil, is based on combined analysis of nutrient contents in the whole leaves and in the soil, and also on the age of the plants, plant growth, planting and training system, previous fertilizations, on the yield, crop treatments and symptoms of nutritional disorders (CQFS-RS/SC, 2004). Nevertheless, for the nutrient contents in the soil and in the plant tissue, the critical contents used for establishment of classes of interpretation are the same as those of annual plants. This occurs because information is scarce regarding the response of the pear tree to the addition of nutrients even in soils with low availability. Thus, the critical levels of phosphorus (P) and potassium (K) in the soil and in the plant tissue for the crop are still an open question,
which justifies carrying out medium and/or long-term
experiments in traditional fruit producing regions, such as the Planalto Serrano of Santa Catarina.
Soils in the South of Brazil, like those of the Planalto Serrano of SC, in general are acidic, have low available P content and the small quantity of exchangeable K (KAMINSKI et al., 2007). This may cause low pear yield, and for that reason, phosphate and potassium fertilization is recommended as a safety measure to ensure greater yields (NAVA et al., 2008; NAVA; DECHEN, 2009; SOUZA et al., 2013).
The application of P sources in the soil promotes phosphate sorption in the functional groups of inorganic reactive particles of the soil, but as successive applications occur, the binding energy between the phosphate and the functional groups decreases, and there may also be P migration in the
soil profile (SCHMITT et al., 2013). In the same way,
but in a readier manner, K migration occurs, as long as the quantity added is greater than that used by the crops, because its adsorption to the functional groups of inorganic and organic reactive particles takes place with low binding energy, facilitating its migration
in the soil profile (KAMINSKI et al., 2007). With
the accumulation of available P and exchangeable K in soil surface layers and even in deeper layers, it is expected that part of these nutrients draws near the outside surface of the roots, especially through diffusion and, if taken up, contents of the nutrients will increase within the plant, and this may be diagnosed by the total content in the whole leaves (MELO et al., 2012; CURETTI et al., 2013). Therefore, an increase may be expected in the values of yield components, such as fruit weight, which may
be reflected in an increase in fruit yield per plant and
per area (NEILSEN et al., 2008; NAVA; DECHEN, 2009). The aim of this study was to evaluate the response to phosphorus (P) and potassium (K) fertilization and to establish the critical levels of P and K in the soil and in the plant tissue in pear trees.
MATERIALS AND METHODS
Two experiments were conducted in a commercial pear (Pyrus communis L.) orchard in the municipality of São Joaquim, in the Planalto Serrano region of SC, Brazil (28° 17’ 38” S, 49° 55’ 54” W, and mean altitude of 1,353 m). Climate in the region
is classified, according to Köppen, as Cfb with mild
summers and cold winters. Mean temperature is 13°C and mean annual rainfall is 1,360 to 1,600 mm a year, and there may be 20 to 29 frosts throughout
the year. The soil was classified as Humic Cambisol
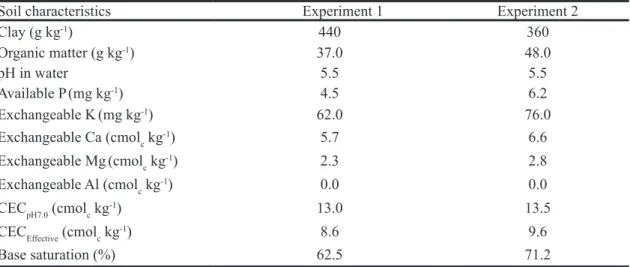
(Soil Survey Staff, 1999), with A horizon from 0-30 cm and incipient B horizon from 60-80 cm, derived from acidic extrusive rock. Soil in the 0-20 cm layer before setting up the experiments exhibited the characteristics described in Table 1.
The pear cultivar was ‘Rocha’, grafted onto the rootstock Pyrus caleriana, with a density of 1,250 plants ha-1 (4 m between rows x 2 m between plants). A central leader plant training system was used and winter pruning was performed annually
seeking to eliminate branches with few fructification
structures, as well as to avoid crossing of branches between neighboring plants. The orchard of the two experiments was established in 2004 in an area previously used as native pasture. Before the transplanting of seedlings, limestone was applied to raise pH in water up to 6.0.
necessary, were carried out following the technical recommendations for the crop.
In February 2011, 2012 and 2013, which coincided with fruit maturation and proximity to harvest, soil was collected from the 0-10, 10-20 and 0-20 cm layers in the plant row using a soil auger, and the samples were set aside. In the period from January 15th to February 15th of each year, 20 whole leaves were collected in the middle third of the branches from opposite sides of each plant and set aside. The soil samples were dried in a forced air laboratory oven at 45oC until constant weight, ground, passed through a sieve with a 2 mm screen and analyzed for available P (experiment 1) and exchangeable K (experiment 2), both extracted by the Mehlich 1 method. The leaves were dried, ground and prepared for analysis of P content (experiment 1) and of K content (experiment 2) (MELO et al., 2012).
In March 2011, 2012 and 2013, in the two experiments, the number of fruits per plant was counted, which were later collected and weighed. The results obtained were subjected to analysis of
variance and, when the effects were significant, polynomial regression equations were fitted (P<0.05).
Relative yield (ry) was calculated using the equation ry=(ty/my)*100, where ty is the treatment yield and my is the maximum yield of the three crop seasons. The results of the ry were related to the available P content (experiment 1) and exchangeable K content (experiment 2) in the soil, and related to the total P and K contents in the whole leaves so as to obtain
the sufficiency level in reference to an ry of 90%. Mathematical adjustment among the variables was carried out using the Mitscherlich model ŷ=a(1-bx), where ŷ represents the ry, a and b are coefficients from the adjusted model and x is the nutrient content in the soil or in the whole leaf.
RESULTS AND DISCUSSION
Experiment 1
Greater available P content was observed in the 0-10 cm layer, in comparison with the 10-20 cm layer, especially in the second (2011/2012) and third (2012/2013) crop season and at the higher rates of phosphate fertilizer, such as 80, 120 and 160 kg P2O5 ha-1 (Table 3). Accumulation of available P in the uppermost soil layer, especially at greater application rates, occurred because the phosphate fertilizer was applied on the soil surface over the years, without incorporation, to avoid mechanical damage to the roots, which may reduce nutrient uptake capacity (GRANATSTEIN; SÁNCHEZ, 2009). In addition, accumulation of P on the soil
surface may be attributed to its high energy in binding to the surface of the mineral fraction of the soil. Adsorption occurs mainly through the ligand exchange mechanism, through giving up OH- or H
2O and taking in the phosphate ion (H2PO4- or HPO
4
-2) and, depending on the soil pH value, this may
happen in the functional groups of the oxides and of kaolinite. The interaction between the oxygen of the phosphate and the cation of the functional group, especially the aluminol of the clay minerals, and the Fe-OH and Al-OH groups of the oxide surface, leads to the occurrence of binding with different degrees of energy (BARROW et al., 1998). However, over the years, continued applications of P on the soil surface may cause occupation of the adsorption sites, leading to a decrease in their adsorption energy, which may increase desorption and, consequently, migration
in the profile of soils planted to fruit-bearing plants
(SCHMITT et al., 2013), increasing content of the nutrient in deeper layers, as observed in the 10-20 cm layer, where there was an increase in available P with the increase in the rate of phosphate fertilizer in all the crop seasons.
the orchard. In addition, it is fitting to mention that
in the 2010/2011 and 2011/2012 crop seasons, where fruit yield in all treatments was lower comparing to the 2012/2013 crop season, the total P content in the whole leaf was greater, which shows that a smaller quantity of the nutrient was redistributed to the fruit and, consequently, probably remained accumulated in annual or perennial plant organs, increasing reserves of the nutrient, a common phenomenon in fruit-bearing plants (ZAMBROSI et al., 2012).
The application of increasing doses of the phosphate fertilizer in the plant row in the three crop seasons, which led to an increase in the available P content in the three soil layers, did not affect the number of fruits per plant, the weight of the fruit, nor fruit yield (Table 3). However, increase in the fruit yield components was expected, which could be
reflected in yield in the plants under the application
of phosphate fertilizer, because the available P content in the 0-20 cm soil layer before application of the fertilizer was interpreted as low (Table 2) (Texture class 2 = 60 to 41% clay, with available P content from 3.1 to 6.0). The lack of response of the pear trees to application of the phosphate fertilizer
may have occurred especially because the finest
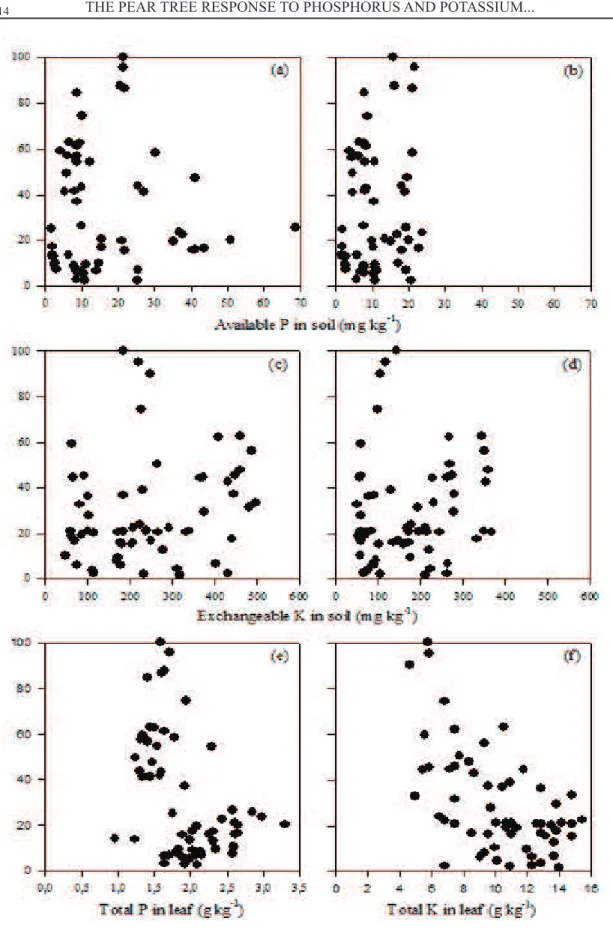
and youngest plant roots, responsible for uptake of water and nutrients in the entire orchard, may have taken up P in layers deeper than the layers sampled and also in the unfertilized region (MAYER et al., 2007). In addition, the lack of climatic adaptation of the European pear trees in the South of Brazil, e.g., the Rocha cultivar used in the present study, poor pollination of flowers and variations of P reserves between plants, when the experiment was established, were probably other limiting factors in expression of maximum yield. Because fruit yield was not affected by the increase in the phosphate fertilizer rate, it was not possible to establish the critical level of the nutrient between the relative yield of fruit obtained in the three crop seasons and the P content in the 0-10 cm layer (Figure 1a) and 0-20 cm layer (Figure 1b), which is the layer used for diagnosis of the available P content in the soil for fruit-bearing plants in the states of RS and SC, nor between the relative yield of fruit with the total P content in the whole leaves (Figure 1e). The lack of establishment of the critical level between relative yield of fruit and the available P content in the soil may be explained in part by the soil collection having been made in the plant row, which coincides with the projection of the tree canopy, where fertilizer was applied and probably where most of the roots are located. However, part of the roots, which may also take up available P not derived from the fertilizer,
are present between the plant rows, where the soil was not sampled.
Experiment 2
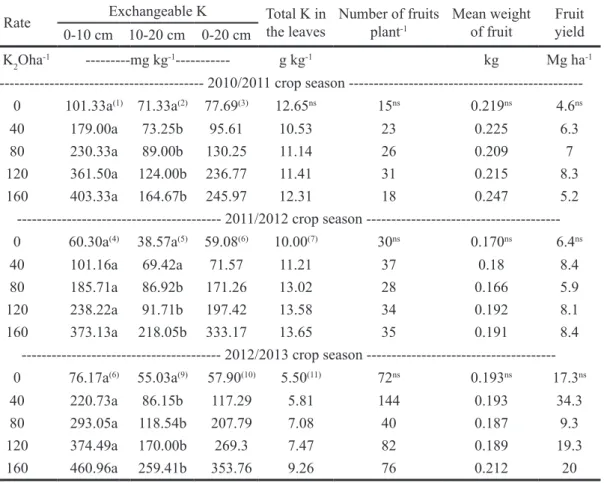
The exchangeable K content in the 0-10 cm layer in the soil, especially in the soil under the application of different rates of potassium fertilizer and in all the crop seasons, was greater than the content observed in the 10-20 cm layer (Table 4). This may be attributed to the application of the fertilizer on the soil surface, without turnover, and to the adsorption of part of the K in the functional groups of organic and inorganic particles (DUARTE et al., 2013). However, part of the K content of the fertilizer migrated in depth, especially at the greater rates of fertilizer applied, for example, 120 and 160 kg K2O ha-1 in the 2010/2011 crop season, and practically at all the different rates of the fertilizer applied in the other crop seasons, 2011/2012 and 2012/2013.
The application of increasing rates of K fertilizer increased the exchangeable K content in the 0-10, 10-20 and 0-20 cm layers (Table 4). In the 2011/2012 and 2012/2013 crop seasons, an increase was observed in the total K content in the whole leaves of the pear trees subjected to the application of increasing rates of potassium fertilizer. In the 2010/2011 crop season, the total K content in the leaves of the pear trees in most of the treatments was interpreted as below normal (8.00-11.9 g kg-1) (BOTELHO et al., 2010), which was repeated in the 2011/2012 crop season in the whole leaves of the plants grown in the soil without application of the potassium fertilizer and with the application of 40 kg K2O ha-1. However, in this same crop season, the total K content in the whole leaves of the pear trees under the application of the other treatments was interpreted as normal (12.0-15.0 g kg-1) (BOTELHO et al., 2010). In contrast, in the 2012/2013 crop season, the total K content in the whole leaves of both plants without and with the addition of most of the different rates of
potassium fertilizers was interpreted as insufficient (<8.0 g kg-1) (BOTELHO et al., 2010). The lower total K content in the leaves in this crop season may have occurred especially because it was seen in the plants of most of the treatments that yield was greater than that observed in the 2010/2011 and 2011/2012 crop seasons, which is in agreement with the yield data obtained in the plants under the application of phosphate fertilizer (Table 2). The greater yield obtained in this crop season may be associated with the greater temperatures that occurred in the period from August to September 2012 (Table 1), favoring
Therefore, since K has high mobility within the plants, part of the K residing in the leaves may have been redistributed to the fruit, as is normally observed in some fruit-bearing plants (ZAMBROSI et al., 2012). If redistribution of K has also occurred from other plant organs to the fruit, this may represent a reduction in internal reserves of the nutrient in the plant (NAVA; DECHEN, 2009) and also may negatively affect fruit yield in ensuing years. In addition, based on the results of K analysis in the whole leaf, especially in the 2012/2013 crop season, an estimate of the need for application, or even of the K application rate only by the total content of this nutrient in the leaf, is not adequate because, in some cases where the nutrient was interpreted
as insufficient (Table 4), especially because of the
greater yield of fruit, the K content in the soil was interpreted as very high (>120 mg of K in soil with CECpH 7.0 from 5 to 15 cmolc kg-1).
The application of potassium did not affect the number of fruits per plant, weight of the fruit nor yield (Table 4), in agreement with the data obtained with the application of different rates of phosphate fertilizers (Table 3). This may have occurred in part because the exchangeable K content in the soil at the beginning of the experiment was interpreted as high (61 to 120 mg of K, in soil with CECpH 7.0 from 5 to 15 cmolc kg-1) and, for that reason, the natural contents in the soil may have supplied demand of the plant for the nutrient. However, already in the third crop season,
for example, under the treatment without addition of potassium fertilizer, reduction in the exchangeable K content in the soil was noticed, possibly because
higher plants are efficient in uptake of the nutrient,
especially with the decrease in the K concentration in the soil solution and, for that reason, a strong chemical gradient is created in the direction of the rhizosphere (GOMMERS et al., 2005). Thus, if the soil in the present study does not have high contents of non-exchangeable K forms, due to the high ability of the plants in uptake of K and to export K when there are high yields (KAMINSKI et al., 2007), it is probable that in the near future the response of the pear tree to the addition of the nutrient or even of the different rate applied will be observed. Establishing the relationship between the relative yield of fruit obtained in the three evaluated crop seasons and the exchangeable K content in the 0-10 cm layer (Figure 1c) and 0-20 cm layer (Figure 1d) did not allow to establish the critical level of the nutrient. This may have occurred because, throughout the crop seasons, the exchangeable K contents in the soil were similar among the treatments and, in most of them, interpreted as high or very high, which may actually have increased (as in the 2010/2011 and 2011/2012 crop seasons) the total K content in the leaves, which also were similar among the treatments, making impossible the establishment of the critical level of the nutrient in the tissue (Figure 1f).
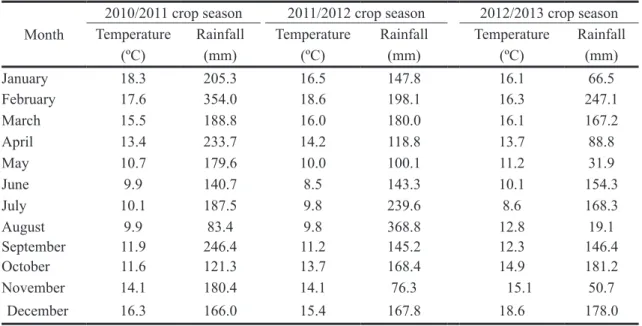
TABLE 1- Average temperature and rainfall in 2010/2011, 2011/2012 and 2012/2013 crop seasons.
Month
2010/2011 crop season 2011/2012 crop season 2012/2013 crop season
Temperature Rainfall Temperature Rainfall Temperature Rainfall
(ºC) (mm) (ºC) (mm) (ºC) (mm)
January 18.3 205.3 16.5 147.8 16.1 66.5
February 17.6 354.0 18.6 198.1 16.3 247.1
March 15.5 188.8 16.0 180.0 16.1 167.2
April 13.4 233.7 14.2 118.8 13.7 88.8
May 10.7 179.6 10.0 100.1 11.2 31.9
June 9.9 140.7 8.5 143.3 10.1 154.3
July 10.1 187.5 9.8 239.6 8.6 168.3
August 9.9 83.4 9.8 368.8 12.8 19.1
September 11.9 246.4 11.2 145.2 12.3 146.4
October 11.6 121.3 13.7 168.4 14.9 181.2
November 14.1 180.4 14.1 76.3 15.1 50.7
TABLE 2- Physical and chemical characteristics of the soil of the experiments 1 and 2.
Soil characteristics Experiment 1 Experiment 2
Clay (g kg-1) 440 360
Organic matter (g kg-1) 37.0 48.0
pH in water 5.5 5.5
Available P(mg kg-1) 4.5 6.2
Exchangeable K(mg kg-1) 62.0 76.0
Exchangeable Ca (cmolc kg-1) 5.7 6.6
Exchangeable Mg(cmolc kg-1) 2.3 2.8
Exchangeable Al (cmolc kg-1) 0.0 0.0
CECpH7.0 (cmolc kg-1) 13.0 13.5
CECEffective (cmolc kg-1) 8.6 9.6
Base saturation (%) 62.5 71.2
TABLE 3- Available P content in the soil, total P content in the leaves, number of fruits per plant, mean weight of fruit and yield in pear trees subjected to the application of different rates of phosphate fertilizer.
Rate
Available P
Total P in leaves
Number of fruits
plant-1 Mean weight of fruit Fruit yield 0-10 cm 10-20 cm 0-20 cm
kg P2O5
ha-1 ---mg kg
-1--- g kg-1 kg Mg ha-1
--- 2010/2011 crop season
---0 8.35a(1) 6.61a(2) 7.01(3) 1.59ns 20ns 0.207ns 5.1ns
40 9.07a 7.45a 7.88 1.88 27 0.209 7.2
80 10.80a 10.62a 10.72 2.02 33 0.212 8.0
120 10.90a 11.25a 11.05 2.00 7 0.209 1.8
160 21.86a 13.43b 18.91 2.08 9 0.223 2.6
--- 2011/2012 crop season
---0 2.01a(4) 1.91a(5) 1.93(6) 1.76(7) 23ns 0.182ns 5.2ns
40 2.74a 2.64a 2.69 2.47 13 0.181 3.0
80 15.58a 3.65b 10.45 2.55 26 0.195 6.3
120 37.84a 5.80b 18.54 2.45 27 0.182 6.1
160 51.03a 11.87b 20.25 2.86 27 0.174 5.9
--- 2012/2013 crop season
---0 5.47a(8) 2.85a(9) 4.77(10) 1.34(11) 68ns 0.185ns 15.6ns
40 8.32a 3.87b 6.38 1.40 74 0.197 18.0
80 8.65a 4.42b 8.11 1.55 74 0.195 18.3
120 21.42a 6.63b 18.75 1.64 125 0.18 28.0
160 31.09a 9.17b 19.56 1.48 63 0.182 14.4
(1) y = 9.1176 – 0.0625x + 0.0008x2 (R2 = 0.73**); (2) y = 6.381 + 0.0436x (R2 = 0.76**); (3) y = 7.3599 – 0.0145x + 0.0005x2 (R2 = 0.90**); (4) y = 0.1201 + 0.0874x + 0.0015x2 (R2 = 0.91**); (5) y = 2.2454 – 0.0267x + 0.0005x2 (R2 = 0.84**); (6) y = 0.2734 + 0.1312x (R2 =
0.88**); (7) y = 1.8704 + 0.0109x – 0.00003x2 (R2 = 0.53**); (8) y = 5.8504 – 0.0255x + 0.0012x2 (R2 = 0.90**); (9) y = 2.9807 + 0.0049x
+ 0.0002x2 (R2 = 0.89**); (10) y = 4.1713 + 0.0526x + 0.0003x2 (R2 = 0.85**); (11) y = 1.3194 + 0.0051x – 0.00002x2 (R2 = 0.42*); ns = not
TABLE 4- Exchangeable potassium in the soil, total K content in the leaves, number of fruits per plant, mean weight of fruit and yield in pear trees subjected to the application of different rates of potassium fertilizer.
Rate Exchangeable K Total K in
the leaves
Number of fruits plant-1
Mean weight of fruit
Fruit yield
0-10 cm 10-20 cm 0-20 cm
kg K2Oha-1 ---mg kg-1--- g kg-1 kg Mg ha-1
--- 2010/2011 crop season
---0 101.33a(1) 71.33a(2) 77.69(3) 12.65ns 15ns 0.219ns 4.6ns
40 179.00a 73.25b 95.61 10.53 23 0.225 6.3
80 230.33a 89.00b 130.25 11.14 26 0.209 7
120 361.50a 124.00b 236.77 11.41 31 0.215 8.3
160 403.33a 164.67b 245.97 12.31 18 0.247 5.2
-- 2011/2012 crop season
---0 60.30a(4) 38.57a(5) 59.08(6) 10.00(7) 30ns 0.170ns 6.4ns
40 101.16a 69.42a 71.57 11.21 37 0.18 8.4
80 185.71a 86.92b 171.26 13.02 28 0.166 5.9
120 238.22a 91.71b 197.42 13.58 34 0.192 8.1
160 373.13a 218.05b 333.17 13.65 35 0.191 8.4
-- 2012/2013 crop season
---0 76.17a(6) 55.03a(9) 57.90(10) 5.50(11) 72ns 0.193ns 17.3ns
40 220.73a 86.15b 117.29 5.81 144 0.193 34.3
80 293.05a 118.54b 207.79 7.08 40 0.187 9.3
120 374.49a 170.00b 269.3 7.47 82 0.189 19.3
160 460.96a 259.41b 353.76 9.26 76 0.212 20
(1) y = 97.7995 + 1.9663x (R2 = 0.85**); (2) y = 70.7874 – 0.00975x + 0.0043x2 (R2 = 0.86**); (3) y = 69.4927 + 0.8054x + 0.0024x2 (R2 =
0.87**); (4) y = 61.4524 + 0.7922x + 0.007x2 (R2 = 0.95**); (5) y = 50.1491 – 0.3202x – 0.008x2 (R2 = 0.84**); (6) y = 56.4026 + 0.4495x
+ 0.0077x2 (R2 = 0.94**); (7) y = 9.852 + 0.0494x – 0.0002x2 (R2 = 0.53*); (8) y = 85.1193 + 3.0731x – 0.0048x2 (R2 = 0.81**); (9) y =
CONCLUSIONS
Application of phosphorus on the soil plan-ted with pear trees increased the nutrient content in the soil and, in most crop seasons, in the whole leaf, but did not affect the yield components and fruit yield.
2. The application of potassium on the soil of pear trees increased the nutrient content in the soil and, in most crop seasons, in the whole leaf, but the potassium content in the whole leaf decreased in the crop season with greater fruit yield. The potas-sium fertilizer did not affect the yield components and fruit yield.
ACKNOWLEDgEMENTS
The first author thanks the CNPq for
research grants.
REFERENCES
BARROW, N.J.; BOLLAND, M.D.A.; ALLEN, D.G. Effect of addition of superphosphate on sorption of phosphate. Australian Journal of Soil Research, Collingwood, v. 36, p.359-372, 1998.
BOTELHO, R.V.; MÜLLER, M.M.L.; BASSO, C.; SUZUKI, A. Estado nutricional de diferentes cultivares de pereira nas condições edafoclimáticas de Guarapuava-PR. Revista Brasileira de Fruticultura, Jaboticabal, v. 32, n. 3, p. 884-891, 2010.
CQFS - Comissão de Química e Fertilidade do Solo - RS/SC. Manual de adubação e calagem para os estados do Rio grande do Sul e de Santa Catarina. 10. ed. Porto Alegre: SBCS - Núcleo Regional Sul/ UFRGS, 2004. 400 p.
CURETTI, M.; SÁNCHEZ, E.; TAGLIAVINI, M.; GIOACCHINI, P. Foliar-applied urea at bloom improves early fruit growth and nitrogen status of spur leaves in pear trees, cv. Williams Bon Chretien. Scientia Horticulturae, Amsterdam, v. 150, p. 16-21, 2013.
DUARTE, I.N.; PEREIRA, H.S.; KORNDÖRFER, G.H. Lixiviação de potássio proveniente do termopotássio. Pesquisa Agropecuária Tropical, Goiânia, v. 43, n. 2, p. 195-200, 2013.
GOMMERS, A.; THIRY, Y.; DELVAUX, B. Rhizospheric mobilization and plant uptake of
radiocesium from weathered soils: I. Influence of
potassium depletion. Journal of Environmental Quality, Madison, v. 34, p. 2167-2173, 2005.
GRANATSTEIN, D.; SANCHEZ, E. Research
knowledge and needs for orchard floor management
in organic tree fruit systems. International Journal of Fruit Science, New York, v. 9, p. 257-281, 2009.
KAMINSKI, J.; BRUNETTO, G.; MOTERLE, D.; RHEIHEIMER, D. S. Depleção de formas de potássio do solo afetada por cultivos sucessivos. Revista Brasileira de Ciência do Solo, Viçosa, MG, v. 31, p. 1003-1010, 2007.
LUZ, R.A.; RUFATO, A.R.; FILHO, J.L.M.; MUNIZ, J.N. Floração e polinização. In: RUFATO, L.; KRETZSCHMAR, A. A.; BOGO, A. (Org.). A cultura da pereira. Florinanópolis: UDESC Editora, 2012. p.38-53. (Série Fruticultura, 1).
MAYER, N.A.; PEREIRA, F.M.; BARBOSA, J.C.; KOBA, V.Y. Distribuição do sistema radicular do pessegueiro ‘Okinawa’ propagado por sementes e por estacas herbáceas. Revista Brasileira de Fruticultura, Jaboticabal, v. 29, n. 3, p. 699-704, 2007.
MELO, G.W.B.; BRUNETTO, G.; BASSO, A.; HEINZEN, J. Resposta das videiras a diferentes modos de distribuição de composto orgânico no solo. Revista Brasileira de Fruticultura, Jaboticabal, v. 34, n. 2, p. 493-503, 2012.
NAVA, G.; DECHEN, A.R. long-term annual fertilization with nitrogen and potassium affect yield and mineral composition of ‘Fuji’ apple. Scientia Agricola, Piracicaba, v. 66, p. 377-385, 2009.120
NAVA, G.; DECHEN, A.R.; NACHTIGALL, G.R. Nitrogen and potassium fertilization affect apple fruit quality in southern Brazil. Communications in Soil Science and Plant Analysis, New York, v. 39, n. 1-2, p. 96-107, 2008.
NETO, C.B.; CARRANCA, C.; CLEMENTE, J.; VARENNES, A. Assessing the nitrogen nutritional status of young non-bearing ‘Rocha’ pear trees grown in a Mediterranean region by using a chlorophyll meter. Journal of Plant Nutrition, New York, v. 34, p. 627-639, 2011.
SCHMITT, D.E.; COMIN, J.J.; GATIBONI, L.C.; TIECHER, T.; LORENSINI, F.; MELO, G.W.B.; GIROTTO, E.; GUARDINI, R.; HEINZEN, J.; BRUNETTO, G. Phosphorus fractions in sandy soils of vineyards in Southern Brazil. Revista Brasileira de Ciência do Solo, Viçosa, MG, v. 37, p. 472-481, 2013.
SOIL SURVEY STAFF. Soil taxonomy. 2nd ed. Washington: United States Department of Agriculture, 1999.
SOUZA, F.; ARGENTA, L.C.; NAVA, G.; ERNANI, P.R.; AMARANTE, C.V.T. Qualidade de maçãs ‘Fuji’ influenciada pela adubação nitrogenada e potássica em dois tipos de solo. Revista Brasileira de Fruticultura, Jaboticabal, v. 35, n. 1, p. 305-315, 2013.