THIS REPORT WAS PREPARED EXCLUSIVELY FOR ACADEMIC PURPOSES BY [INSER STUDENT’S NAME], A MASTERS IN FINANCE STUDENT OF THE NOVA SCHOOL OF BUSINESS AND ECONOMICS.THE REPORT WAS SUPERVISED BY A NOVA SBE FACULTY MEMBER, ACTING IN
A MERE ACADEMIC CAPACITY, WHO REVIEWED THE VALUATION METHODOLOGY AND THE FINANCIAL MODEL.
(P D D )
M
ASTERS IN
F
INANCE
S
UZANO
P
APEL E
C
ELULOSE
C
OMPANY
R
EPORT
P
ULP
&
P
APER
26
M
AY2017
S
TUDENT
:
F
RANCISCO
O
LIVEIRA
[email protected]
Recommendation: HOLD
Price Target FY17: 15.3 R$
Price (as of 26-May-17) 15.26 R$
Reuters: SUZB5.SA, Bloomberg: SUZB5:BZ
52-week range (€) 9.5 – 15.5 Market Cap (R$m) 16,863 Outstanding Shares (m) 1,107,738,677 Free float 42% Source: Bloomberg Source: Bloomberg (Values in $R millions) 2015 2016 2017F Revenues 10,224 9,882 10,439 EBITDA 4,489 2,721 3,866 EBITDA margin 44% 28% 37% NOPLAT 3,069 965 1,741 ROIC 14.8% 4.3% 8.1 EV/EBITDA 7.4 6.6 7.3 Dividend Yield 2.13 2.47 2.9% EPS 0.24 1.38 1.48 DPS 0.06 0.33 0.45
D/E - book values 1.36 1.02 0.77 Book value per share 8.3 9.2 10.8 Source: Suzano, analyst estimates
Money that grows on trees
▪ We initiate coverage of Suzano Papel e Celulose with a hold recommendation based on a FY2017 Price
Target of R$15.3 per share, in line with the current price, plus a dividend yield of 2.9% in FY2017. Our price target was achieved through an APV model.
▪ The macroeconomic scenario looks supportive of Suzano’s business in the near term as international pulp
prices continue to increase and political instability should prevent appreciations in the Brazilian currency.
▪ We expect that management’s focus on cost
reduction programs and small but highly accretive investments in segments such as tissue paper and fluff pulp
should increase Return on Invested Capital from the 8.4% average of the last 3 years to 12.1% in 2021
▪ Suzano is deleveraging fast after years of aggressive expansion. We believe Net Debt/Ebitda has
peaked in 2016 at 3.8x and we expect 2017 and 2018’s
figures to be 2.47x and 2.32x, respectively.
▪ We think that the recent stock appreciation has brought SUZB5 stock close to its fair value.
Company description
Suzano Papel e Celulose is a Brazilian vertically integrated producer of eucalyptus pulp and paper. The company has become a global player in the pulp, paper and forest industry with a combined pulp and paper capacity of around 4.7mn tons, being the 3rd largest producer of hardwood pulp in the world and
an important regional producer of various types of paper, fluff pulp, lignin and tissue. The company owns eucalyptus forests in 8 brazilian states with a total area of around 1.2mn hectares. Suzano, along with other Brazilian companies benefit from having one of the best cost structures in pulp production worldwide, due to unique climate and soil conditions. Suzano, in particular, has a cash cost of around 570R$ per ton of pulp, lower than its direct competitors.
SUZANO PAPEL E CELULOSE COMPANY REPORT
Table of Contents
Investment case ... 3
Company overview ... 4
The Pulp & Paper industry ... 9
Macroeconomic Environment ...13
Value drivers and key assumptions ...17
Financials ...19
Valuation ...21
Scenario Analysis and Risks ...23
Multiples ...24
SUZANO PAPEL E CELULOSE COMPANY REPORT
Investment case
Suzano is now reaping the benefits of an aggressive investment cycle started in the early 2000s. Since 2003, the company more than doubled its production capacity from 1200k tons of pulp and paper to around 5000k tons expected in 2017. This expansion came at the cost of a great increase in Capex and leverage: net debt has increased from 0.7x EBITDA in 2003 to 3.8x EBITDA in 2016. The company has entered in recent years in a new cycle of deleveraging and focus on operational improvements such as increases in eucalyptus productivity, reduction of logistics costs, reduction of the average distance from plantations to mill, improvement of paper margins by selling directly to its end costumer (instead of depending on intermediaries), among others. With all these measures in mind, we forecast that pulp costs should continue to decrease at a nominal CAGR of 1.2% until 2021, our last forecast year.
Furthermore, the company is making efforts to diversify its revenues from its pulp sales, namely with the start-up of tissue production by the end of this year, fluff pulp and lignin. This strategy should lead to a gradual reduction in net debt to EBITDA of around 1x by the end of our forecast period. In our view, this reduction in leverage is very beneficial to Suzano as it will eventually lead to an upgrade of its credit rating to investment grade (currently it is one level below) and thus reduce its cost of financing and make it cheaper for the company to take advantage of future opportunities that may arise.
Valuation summary
We value Suzano through an Adjusted present value model with a forecast period of 5 years, from 2017 – 2021, using an Unlevered Cost of Capital of 9.93% and a cost of debt of 9.04%. Our growth rate in perpetuity for the company is 1.73%. We estimate a FY2017 price target of 15.3$R and a dividend yield of 2.9%. For more information, please refer to the “Valuation” section of this report.
Harvesting the benefits of its investing cycle…
…and diversifying the asset base…
…with a focus in value creation…
SUZANO PAPEL E CELULOSE COMPANY REPORT
Company overview
Suzano is the largest Brazilian paper company and the world’s fourth-largest market pulp producer. The company operates three integrated pulp and paper facilities, including Mucuri in the State of Bahia, Limeira and Suzano in the State of São Paulo, one market pulp facility, Imperatriz, in the State of Maranhão and one paper facility, Rio Verde, in the State of São Paulo. The company has 1.3 mn tons of paper capacity, including 1.1 mn tons of coated and uncoated printing and writing capacity and 200k tons of paperboard capacity. Additionally, the company has 2.3mn tons of market pulp capacity. Suzano’s land assets totalled more than 1.2 million hectares, bigger than countries such as Lebanon or Jamaica.
Company description
Suzano was founded as a typography located in the town of Suzano, São Paulo in 1929 by Leon Feffer, a Ukrainian immigrant that arrived in Brazil in 1920 with 18 years. The company started to produce its own paper in 1939 and has grown to be an integrated pulp and paper company. At the time, the raw material used for paper production was pine wood which had to be imported and was thus subject to interruptions of supply and periods of scarcity. In order to overcome this problem, Leon Feffer and his son Max Feffer conducted research in partnership with the University of Florida, with several forest species as well as other cultures such as sisal and sugarcane bagasse, in search of a new source of raw material for paper production in Brazil. Eucalyptus presented the best results and large areas of eucalyptus were then planted. In 1957, the company produced the first paper with a 30% eucalyptus pulp content and, by 1960, Suzano was the first company in the world to produce paper 100% made from eucalyptus pulp. This started a transformation in the pulp & paper industry worldwide and Brazil changed from net importer to net exporter of Pulp & Paper. In 1973 Suzano made its first pulp export to Europe. In the years since, eucalyptus pulp exports gained much importance to the company and now represent 55% of its revenues.
Mills Average Distance from Forest Paper capacity (k ton/year)
Pulp capacity (k ton/year)
Imperatriz (MA) 150 km - 1,500
Mucuri (BA) 73 km 250 1,540
Suzano (SP) 212 km 560 40
Limeira (SP) 212 km 380 340
Source: Suzano Figure 1 Suzano's pulp and paper mills
SUZANO PAPEL E CELULOSE COMPANY REPORT
Forest business unit
Eucalyptus forests are the heart of Suzano’s business and its major source of competitive advantage over international competitors. Having been a pioneer in eucalyptus cultivation, Suzano developed a great expertise in forestry. Nowadays, the company owns more than 1.2mn hectares of land throughout Brazil (of which 522k are of eucalyptus plantations) and controls all the process from the production of seedlings to harvest and transportation to the mill. Suzano’s forestry unit includes the research and development of highly productive eucalyptus trees through its subsidiary Futuragene, acquired in 2010. In 2015, Suzano was the first company to get the approval for commercial use of a genetically modified eucalyptus with an increased productivity of around 20% more than the conventional eucalyptus clone.
Pulp and Paper business unit
Integrated pulp and paper - Suzano is the largest Brazilian producer of
paper with an installed capacity of 1.3 million tons. The paper production of Suzano is integrated, i.e. the units comprise a pulp and a paper mill in the same site. The company produces two main types of paper: coated and uncoated woodfree paper. This type of paper mainly consists of chemical pulp fibres. While coated paper is primarily used in the production of higher-quality products, promotional products (including flyers, catalogues, displays and signs) and certain editorial segment products such as magazines and books, uncoated paper is used in the domestic and export notebook segment and newsprint, mailing, office and retail segments. The paper business provides stability to Suzano’s revenues as it is oriented to the domestic and South American markets and enjoys from the benefits of having an established brand and market share, specially in the Brazilian market. The two main segments of Suzano’s paper unit are:
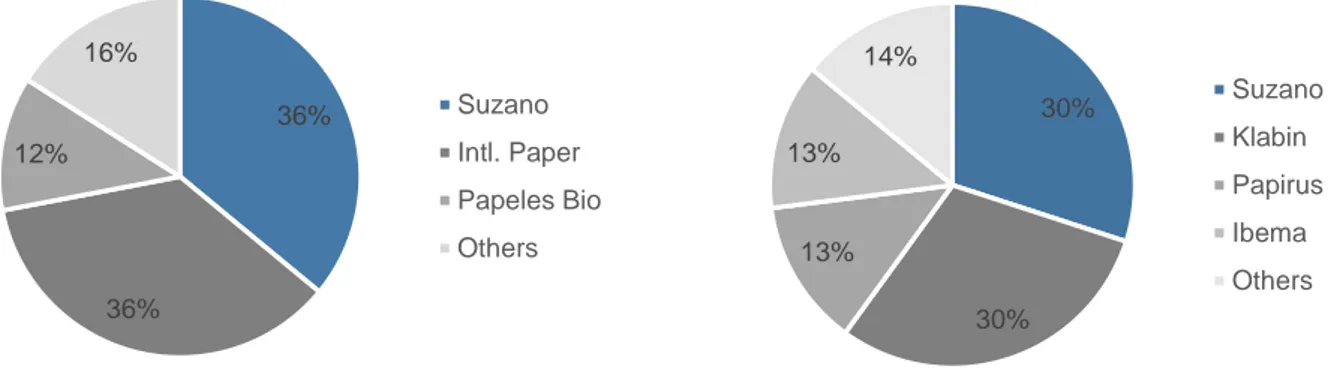
-Paperboard, which is mainly used in manufacturing packaging products for the pharmaceutical, cosmetic, tobacco, toys, clothing, food and beverage and cleaning industries and also used in the editorial segment. Suzano has an annual capacity of 200ktons of paperboard and has a market share of around 30% of the Brazilian market, around the same share of its closest competitor, Klabin.
-Printing & Writing, used in the office, education, editorial and other sectors. Together with International Paper, Suzano dominates the Brazilian market of printing and writing paper, with a market share of around 36% each.
Suzano's Forestry Assets
Total Area 1202k ha
Planted Area 522k ha
Preserved/Other 310k ha
Third parties 380k ha
Source: Company reports
Figure 2 Suzano’s best-selling printing and writing paper
SUZANO PAPEL E CELULOSE COMPANY REPORT
Market Hardwood Pulp - Suzano entered the Pulp segment in the 1990s
through Bahia Sul, and since then has been increasing pulp production capacity and its forest base. Nowadays, more than 60% of Suzano’s revenues come from its market pulp business. Suzano operates a pure market eucalyptus pulp plant in the state of Maranhão – the Imperatriz unit – and two integrated pulp plants located in Bahia and São Paulo. Around 89% the company’s market pulp production is destined to the export market mainly to the European and Chinese markets. Suzano is the third largest hardwood pulp producer, behind Fibria and Asia Pulp & Paper(APP).
Other segments
Tissue - In addition to its core businesses, one of the pillars of Suzano’s
management strategy in the last years has been to create businesses that diversify its revenues and add value to its pulp production. In 2015 Suzano’s management announced the company’s start-up of tissue production in 2017. The tissue market in Brazil comprises around 1.2Mt of capacity and grows at a more accelerated pace than other paper products and therefore provides Suzano a new market with interesting potential. The total capacity of tissue will be 120k tons per year and production will be exclusively in its Imperatriz mill, in north eastern Brazil – where Suzano expects tissue will have the highest growth rate in Brazil. Out of this number, Suzano aims to deliver 60kt of jumbo rolls (to be transformed by third parties) and 60kt of finished products targeted primarily to the regional market of north and northeastern Brazil, benefitting from the proximity to customers. This project also enables Suzano to extract fiscal benefits from tax credits. Full capacity should be reached in 2021. Total tissue capacity in Brazil is around 1.2Mt and grows at around 60kt/yr.
Figure 4 Bleached Hardwood pulp capacity - 2017E 8.15 4.2 3.4 3.2 2.8 2.1 1.7 1.5 1.2 1.2 Fibria *APP Suzano CMPC April UPM Eldorado Arauco Stora Enzo Cenibra 30% 30% 13% 13% 14% Suzano Klabin Papirus Ibema Others 36% 36% 12% 16% Suzano Intl. Paper Papeles Bio Others
Figure 3 Brazilian printing & writing (left) and cardboard market sshares
Source: Iternational Paper; Klabin
SUZANO PAPEL E CELULOSE COMPANY REPORT
Source: Company reports; Factset
Fluff Pulp - Suzano developed a proprietary fluff pulp made exclusively
from eucalyptus, named Ecafluff. Fluff pulp is used as the raw material for the production of absorbents of personal care products such as diapers, feminine hygiene products, air-laid absorbent toweling, as such or with superabsorbents and/or synthetic fibers. More than 80% of these specialty pulps are used in baby diapers. Suzano was the first company worldwide to produce this type of pulp from eucalyptus and currently the production takes place at the company's Suzano Unit in Sao Paulo where in early 2016 the company invested R$30 million in a project to enable an existing paper machine at the mill to have the flexibility to produce both eucalyptus fluff pulp and coated/uncoated wood-free paper. The upgraded machine has the capacity to produce 100k tons per year of Eucafluff. Tests made by Suzano show Eucafluff's potential to replace 70% of fibres in feminine hygiene and 30% in diapers. As for performance, one of the advantages of the new fibre is its lower energy consumption during processing and defibering, Suzano reports. At the 1Q Earnings presentation this year, the CEO reported a good early acceptance of Eucafluff by international costumers and reinstated that this project was going to be “a success”.
Lignin – another complementary product, lignin is a polymeric compound
found in the wood, which is separated from the cellulose in the pulping operation and is subsequently concentrated and burnt for energy production. Lignin can also be used as a raw material to produce several value-added products such as adhesives, binders, phenols, etc. In 2015. Suzano announced an annual production capacity of 20,000 tons by 2017.
We note that these small projects require minimal capex and have the potential to provide high returns.
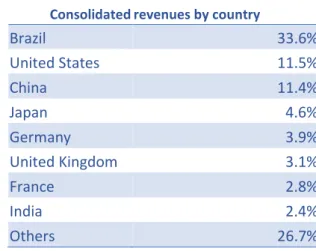
Consolidated revenues by country
Brazil
33.6%
United States
11.5%
China
11.4%
Japan
4.6%
Germany
3.9%
United Kingdom
3.1%
France
2.8%
India
2.4%
Others
26.7%
Figure 5 Company’s revenues by segment and by country
38%
62%
SUZANO PAPEL E CELULOSE COMPANY REPORT
Growth over the years
The production capacity of the company has increased to 4.7 million tons of pulp and paper per year in 2016 from 1.2 million in 2003. In this period, Suzano’s pulp capacity has increased at a compound annual growth rate (CAGR) of 28.6%, while paper capacity at 8.9%. Since 2007, Suzano has completed two large scale projects: the largest single pulp production line in the world in Imperatriz, Maranhão and an increase of 1 million tons per year of capacity to the Mucuri unit in Bahia. To fund these capital expenditures, the company used cash from its operations and debt financing (loans, bonds, BNDES and export financing). In December 2010, Suzano also acquired from Fibria the remaining 50% stake in the paper producer Conpacel for R$1.45 billion and KSR (paper distribution) for R$50 million. Suzano’s expansion strategy for last five years has been focused on the pulp business as the company has seen a bigger competitive advantage in its pulp business than in paper.
Shareholder structure and governance
Suzano has three different classes of shares, with class A preferred share class, SUZB5, being the only share class that is publicly traded. Common shares are not publicly traded and hold voting power in general meetings. Class A preferred shares are entitled to a dividend at least 10% higher than common shares and have priority for capital reimbursement in the case of company liquidation, but have no voting rights. Lastly, a Class B of preferred shares exists and holds the same 10% bonus in dividend payments plus a 6% minimum dividend yield over the face value of capital attributed to this type of
Figure 6 Suzano’s pulp and paper capacity (ktons per year) vs Net Debt ($R millions)
SUZANO PAPEL E CELULOSE COMPANY REPORT 2% 42% 56% Treasury Free Float Controling Group
Source: Company reports Figure 7 Shareholder structure
shares. Class B shares are not very significant as they represent only 0.0025% of the company’s capital, 98.5% of which are held by the treasury. The national bank for economic development has a stake of 7% and the remainder of the company’s equity is publicly traded on the BOVESPA and NYSE. The descendants of the founder, Leon Feffer own a majority 56% stake in the company through Suzano Holding SA. Although the Feffer family holds the majority of the capital, Suzano has a professional and independent administration led by Walter Shalka. Family members also have an active role in the company’s management namely through the board of directors, presided by David Feffer and through the Management Committee, also coordinated by David Feffer.
For valuation purposes we assumed that all share classes have the same value for the following reasons: we think that the mandatory 10% higher dividend for class A shares makes up for the voting power that common shares enjoy; we acknowledge that Class B shares could have a higher intrinsic value because of the minimum dividend but we think that they have no significance in final target price because of their low percentage in Suzano’s capital.
The Pulp & Paper Industry
From packaging products and printing paper, to personal hygiene items, we use pulp-based products throughout our everyday routine. The global pulp industry is divided into different categories, including products made from recycled or virgin fibres, pulp manufactured chemically or mechanically, and produced by softwood or hardwood fibres. In this section, we review these main segments within the global pulp market and the role that Brazilian producers, and Suzano in particular, have in this industry.
Suzano Papel e Celulose, S.A. Common Shares 371.1m shares -Suzano holding 98.2% -Feffer Family: 0.0% -Controlling & Mgt.: 0.0% -Treasury Stock: 1.8% -BNDESPAR: 0.0% -Float: 0.0% Preffered stock Class A: 734.6m shares -Suzano holding: 0.4% -Feffer Family: 24.3% -Controlling & Mgt.: 10.7% -Treasury Stock: 1.2% -BNDESPAR: 10.3% -Float: 53.0% Preffered stock Class B: 17.7k shares -Suzano holding 0.9% -Feffer Family: 0.0% -Controlling & Mgt.: 0.1% -Treasury Stock: 98.5% -BNDESPAR: 0.0% -Float: 0.5%
SUZANO PAPEL E CELULOSE COMPANY REPORT
Recycled Fiber versus Virgin Fiber
The global pulp industry is roughly divided into two main sectors: recycled fiber and virgin fiber, the type that Suzano produces. Virgin fibers are mainly made from harvested trees, with the most common being eucalyptus and pine. Recycled fibers are made mostly from recovered post-consumer fibers and represent a majority of global production and consumption, with its importance growing significantly over the past decade. For example, in 2015, the pulp & paper intelligence company RISI showed that around 57% of global fiber production was made from recycled papers. This compares with 50% in 2005, and 40% in 1995. Virgin fibers, while growing in recent years, have declined as a percentage of the total mix. In 2015, virgin pulp represented 40% of the mix, which compares to 46% in 2005 and 54% in 1995. This may look negative for virgin fiber producers such as Suzano but, in fact, Suzano and other Brazilian manufacturers such as Fibria and Klabin have fared quite well and even gained market share due to their superior cost structure.
Chemical Pulp versus Mechanical Pulp
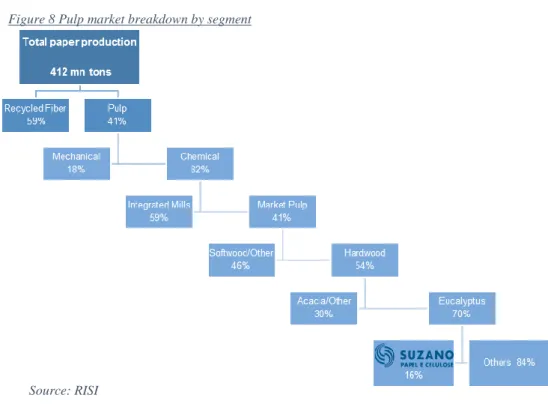
There are two main manufacturing processes used by pulp producers: chemical and mechanical. Chemical pulp represents 82% of all virgin fiber pulp (139mn tons), with the mechanical process representing the remainder. Chemical pulp (also called kraft pulp) is produced by cooking wood chips in a chemical solution, which separates the cellulose fibers and removes lignin. The lignin 5.3 3.9 3.9 3.8 3.5 3.4 2.8 2.6 2.3 2 Fibria Arauco CMPC APP UPM Suzano April Stora Enzo Georgia Pacific Ilim
Figure 8 Pulp market breakdown by segment
Source: RISI
Figure 9 Top 10 producers of Pulp (Hard and Softwood) values in ktons
SUZANO PAPEL E CELULOSE COMPANY REPORT
removed from the pulp forms a biomass which producers then use to produce steam and generate energy. As a result, the biomass created in the chemical pulping process results in these mills being energy self-sufficient (and in some cases, allows the pulp facility to sell excess energy to the grid). Mechanical pulp is produced by the exertion of force on the cellulose fibers. The mechanical process generally results in a higher fiber yield as the lignin is not separated from the fibers. While the mechanical pulping process is less expensive than the chemical pulping process, it also produces an inferior end-product. Contrary to the chemical pulp production process which is energy self-sufficient, mechanical pulp requires energy. While, virgin pulp has declined as a percentage of the total fiber mix, chemical pulp has increased in importance within virgin fiber. In 2015, chemical pulp represented around 85% of total virgin pulp production. This compares with 80% in 2005. During this period, bleached hardwood kraft pulp, the pulp manufactured by Suzano, increased meaningfully, from 53mn tons to 64mn tons. During the same period, mechanical pulp has declined to 28mn tons from 36mn tons.
Integrated Mill Pulp versus Market Pulp
Pulp produced by paper & packaging companies for their own internal use is called integrated pulp. Some paper manufacturers, such as Suzano have historically produced and consumed their own pulp in their integrated paper manufacturing facilities. Pulp produced for sale to third parties is called market pulp. For example, Fibria, the major competitor of Suzano in Brazil, is a pure-pulp manufacturer, whose end-product is sold to paper and packaging companies (ie, they are pure market pulp manufacturers). Historically, many of the integrated participants have consumed a majority of their own pulp in an integrated process. However, increases in pulp prices have incentivized Suzano and other producers to expand their pulp manufacturing capacity, ultimately making a portion of their total production “market pulp.” Suzano’s newest mill in Imperatriz was projected to be a pure market pulp facility with 1.5mn tons of capacity. Similarly, Fibria is expanding its Três Lagoas mill, which will increase capacity at the facility by 1.95mn tons, while Eldorado is analyzing expanding its Três Lagoas mill, which could potentially expand capacity by 2.3-2.5mn tons. Of the 139mn tons of chemical pulp manufactured, integrated mills represent 59% of consumption (82mn tons), while market pulp represents 41% of chemical pulp production (57mn tons).
SUZANO PAPEL E CELULOSE COMPANY REPORT
The two main types of wood pulp are softwood and hardwood. Softwood pulp includes wood species with long cellulose fibers, including pine, spruce or fir, and is mostly grown in temperate areas. These longer fiber pulps are best suited for products requiring strength and durability, including packaging products and certain printing papers. Hardwood pulp includes wood species of short cellulose fibers, such as eucalyptus, aspen, acacia or birch, and is mostly grown in tropical areas. These shorter fiber pulps are best used for paper products with high smoothness, opacity, and uniformity, such as tissue paper. Softwood pulp represents 46% of market pulp demand (24mn tons), while hardwood pulp represents 54% of market pulp demand (31mn tons). Eucalyptus trees are the main raw material for Brazilian manufacturers and have a favorable growth cycle compared with species from which softwood is derived. Fibria, Suzano, CMPC and UPM-Kymmene are the largest publicly traded market-pulp producers of hardwood pulp. International Paper, Metsa Group, Mercer International and Domtar are the largest on the softwood side. Due to its higher cost, softwood has decreased in importance in the total mix of virgin pulp.
Brazilian eucalyptus producers benefit from having excellent natural growth conditions because of soil and climate conditions and are among the fastest in the world, with an average growth cycle of six to seven years for Suzano and other Brazilian pulp producers. This compares with over 10 years in other countries in the Americas, and over 20 years for other hardwood species in countries in the Northern hemisphere. Having a faster growing forestry asset provides an important competitive advantage for Brazilian pulp manufacturers, given the importance of wood costs in the production process as around 50% of cash costs are related to wood. 0 5 10 15 20 25 30 35 40 45 50 600 700 800 900 1000 1100 Jan-1 0
Apr-10 Jul-10 Oct-10 Jan-1
1
Apr-11 Jul-11 Oct-11 Jan-1
2
Apr-12 Jul-12 Oct-12 Jan-1
3
Apr-13 Jul-13 Oct-13 Jan-1
4
Apr-14 Jul-14 Oct-14 Jan-1
5
Apr-15 Jul-15 Oct-15 Jan-1
6
Apr-16 Jul-16 Oct-16 Jan-1
7
Apr-17
FOEXBHKP Index FOEXNBSK Index
Figure 10 Hardwood productivity in selected countries – m3/ha/year
Source: Hawkins Wright
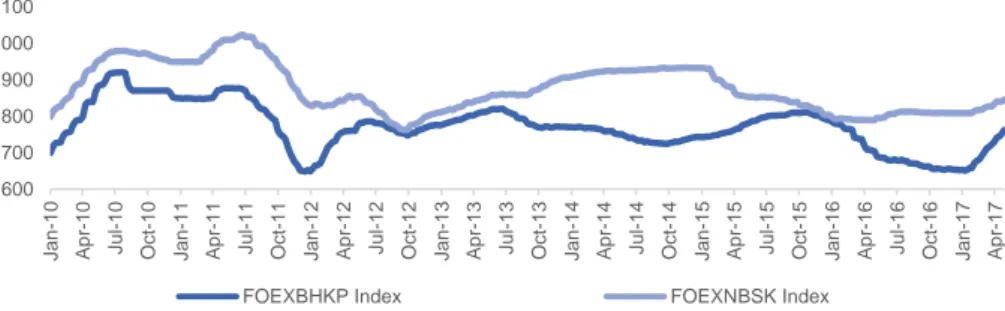
Figure 11 Hardwood (BHKP) vs Softwood (NBSK) prices – USD/ton
SUZANO PAPEL E CELULOSE COMPANY REPORT
Macroeconomic environment
As stated in the Company Overview section, Suzano’s paper business is more dependent on the domestic market and the pulp unit is much more an export driven business. In this section, we discuss the outlook for the economy of Brazil of which its paper business is oriented, as well as the outlook for the international market for hardwood pulp in the coming years
Brazilian domestic market for paper
Brazil has just gone through the worst recession in its recorded history. Since 2014, Brazil’s economy has shrunk by 8% in real terms and unemployment has risen to 13.7% as of March 2017. This deep recession was a result of a combination of two unfortunate factors: a bearish cycle in commodities (that represent around 42% of Brazilian exports) and high political instability brought by the worst political scandal in Brazilian history – Operation Car Wash - that culminated in president Dilma’s impeachment on 31st August 2016. As a consequence of the crisis, inflation and
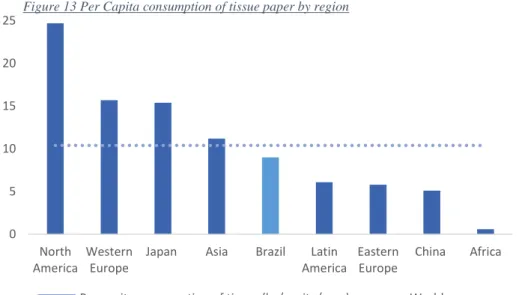
interest rates skyrocketed with the annual consumer price index growth rate reaching 10.7% in January 2016 and Selic, the benchmark rate for Brazil, staying at a record 14.3% for more than a year between 2015 and 2016. Recent data has pointed to a return to economic growth in 1Q2017, namely the economic activity index published by Central Bank of Brazil that showed an increase of 1.1% in the first quarter of 2017. The return to economic growth should also improve the paper market in the country. In fact, paper consumption has a high correlation with GDP per capita and therefore an improvement in the economy should, over time, help reduce the gap between Brazilian paper consumption per capita and that of more developed markets. Therefore, we see domestic economic recovery improving the Brazilian domestic paper market and Suzano’s revenues from this year forward, namely through its new tissue business.
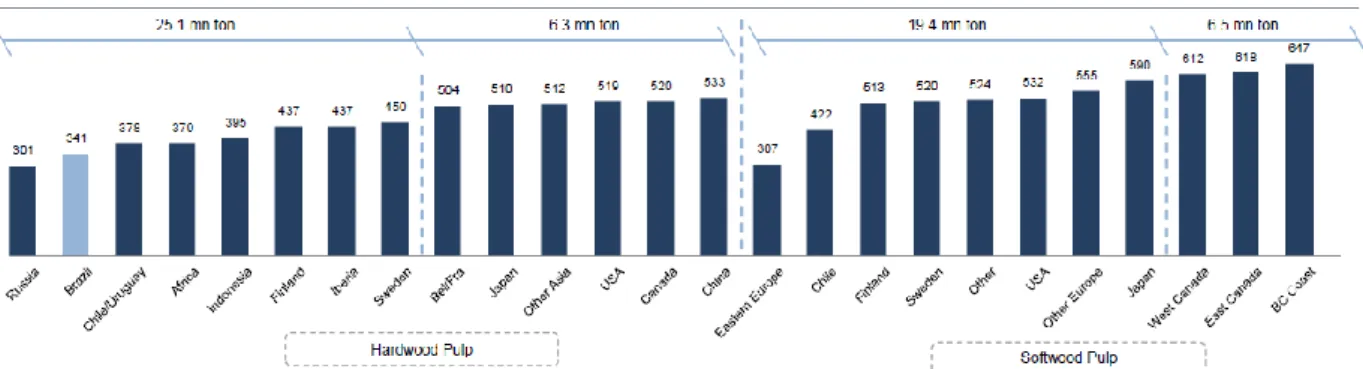
Figure 12 Comparison of pulp cash costs in selected countries
SUZANO PAPEL E CELULOSE COMPANY REPORT
The Pulp market
A key debate in the pulp industry has been about if the start-up of new projects will bring excess supply to the market and a structural decline in prices. In fact, a series of mill start-ups led prices to the lowest level since the financial crisis of 2008/2009. However, prices remained briefly in such levels and have quickly returned to more average levels since the start of 2017 (around 17% YTD). While we do not exclude a market transition to oversupply in the short term, our opinion is that, in the long term, Chinese paper production and consumption should remain strong, as China still consumes about 78kg/capita of paper versus 250kg in developed economies. We note that pulp is a commodity that benefits from China becoming a more consumption driven economy and that demand can continue strong even if the Chinese economy decelerates in the future. Another factor that may increase Chinese demand of pulp is fiber substitution as a significant portion of China’s domestic production of pulp consists of polluting, high cost capacities, which should continue to close in the next years.
Although less than other commodities, pulp prices are subject to some volatility and are determined by macro conditions and supply and demand balances. During 2008, prices declined with the global financial crisis, but then recovered in late 2009 due to higher demand from China and some supply restrictions such as closures of non-efficient mills, the 2010 earthquake in Chile and strikes in Finland and showed an increasing trend until early 2011, when prices were affected by the European debt crisis. Prices started to recover in January 2012 due to an increase in demand from China and remained stable until the beginning of 2016 when new capacity increases in Latin America (Klabin’s Puma project in Brazil and Montes del Plata in Uruguay),
400 500 600 700 800 900 1000 FOEXBHKP Index Average 2008-2016 0 5 10 15 20 25 North America Western Europe
Japan Asia Brazil Latin America
Eastern Europe
China Africa
Per capita consumption of tissue (kg/capita/year) World average
Figure 13 Per Capita consumption of tissue paper by region
Source: RISI
Source: Bloomberg
Figure 14Hardwood pulp price index - USD per ton
SUZANO PAPEL E CELULOSE COMPANY REPORT
brought more than 2.4 million tons of additional hardwood pulp capacity to the market after which the market entered in oversupply. Consequently, prices dropped to 650$/ton in Europe an 500$/ton in China. However, such low pulp prices did not last for long and, in the beginning of this year pulp prices started to recover rapidly with average port inventory days dropping to record low levels (33 days of supply as of May 2017). Capacity increases will continue in 2017 and 2018 namely:
-Asia Pulp & Paper OKI new mill The start-up of APP’s gigantic new mill in Sumatra,
Indonesia in the beginning of 2017 was one of the reasons for the bearish pulp market in 2016. The new mill has a capacity of around 2mn tons of pulp made from acacia wood. This mill has the advantage of being closer to China, the fastest growing market for hardwood pulp, and thus benefiting from lower transportation costs. However, in March this year APP confirmed the rumors of delays in this mill and announced to its clients that it would not supply hardwood pulp in 2017 due to quality concerns and all the pulp produced in the OKI mill would be for internal consumption.
-Fibria Horizonte II project The largest producer of hardwood pulp in the world has
made investments to increase its mill in Três Lagoas by 1.9 mn tons of capacity. At the first trimester earnings presentation in 2nd May, CEO announced that the project
is at 87% of physical completion and that it should be ready to start production in the first weeks of September.
-Klabin’s Puma project with a production capacity of 1.1mn tons, started in 2015,
will achieve full ramp-up this year, bringing 500 thousand tons of additional capacity of hardwood pulp. 600 650 700 750 800
850 Eldorado (BZ)New mill Suzano (BZ)
New mill +1.5 mn ton Montes Del Plata (UY) New mill +1.3 mn ton Klabin (BZ) New mill +600k ton Jari (BZ) Closure
-430 k ton Sappi (USA)
Conversion to DP -250 k ton SodraCell (NO) Closure -405 k ton Old Town (USA) Closure -200 k ton Olthers Closure -590 k ton Olthers Expected closures 2016 -580 k ton Fibria (BZ) New mill +1.95 mn ton APP (IS) New mill +2 mn ton Olthers Expected closures 2017 -980 k ton
Figure 15 – Recent capacity additions, closures and BHKP prices (US$/ton)
SUZANO PAPEL E CELULOSE COMPANY REPORT
-Suzano will also increase its capacity by 300 thousand tons in 2017 through
debottlenecking (the increase production capacity the existing plants by making modifications to the equipment configuration and workflow).
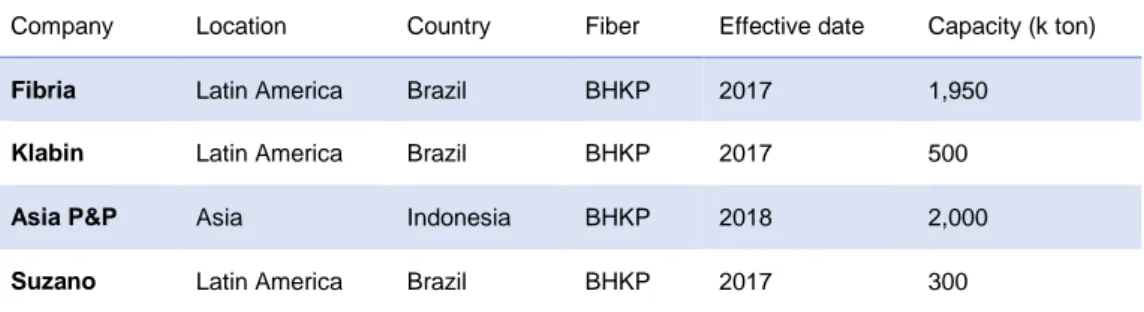
Figure 16 Hardwood pulp capacity increases 2017-2018
Although we recognize that the pulp capacity increases will likely create some oversupply in late 2017 and throughout 2018 and thus lower the prices in the short term, we maintain a balanced perspective for the medium and long term for the following reasons:
1. Emerging markets should continue to increase paper consumption and production, especially China. We believe that the technological substitution of
paper that have reduced paper demand in developed markets may be already present in China and other emerging markets. However, P&W and tissue paper demand has been growing consistently, indicating it has not yet reached normalized levels in this market. In our view, pulp demand will remain supported by the increase in urbanization rate and growing disposable income levels in China, implying changes in consumer habits and rising living standards and therefore increased use of disposable paper products. Although China’s economy seems to be slowing down, and China has been the world’s key source of commodities demand growth, this does not mean that every commodity should be affected negatively. The economic deceleration in China can be linked to a shift of its economy away from investment and toward consumption, with domestic demand gradually substituting manufacturing as the driver of growth. This growth model shift could change China’s commodities demand profile. We believe that commodities that are tied to consumption, such as pulp, could actually end up being benefited from this change in the Chinese economy.
Company Location Country Fiber Effective date Capacity (k ton)
Fibria Latin America Brazil BHKP 2017 1,950
Klabin Latin America Brazil BHKP 2017 500
Asia P&P Asia Indonesia BHKP 2018 2,000
Suzano Latin America Brazil BHKP 2017 300
Source 1Fibria institutional presentation
10% 30% 50% 70% 90% 1980 1984 1988 1992 1996 2000 2004 2008 2012 Brazil China Euro area
Source World Bank
Figure 17 Urban population in selected regions (% of total)
SUZANO PAPEL E CELULOSE COMPANY REPORT
2. As new low cost supply comes into the market, it is likely that inefficient capacity gradually close. This trend has occurred for some years and should
continue as a good part of the world market pulp capacity is very inefficient. Conversions of market pulp mills
3. There are no capacity increases announced for beyond 2018, although they
may occur if pulp prices continue showing strength even after the announced supply increases
With these points in mind, we expect continued strength of pulp prices until the 4Q2017 when we expect that Fibria’s new capacity to enter the market and gradually start pushing prices down in international markets. This downward trend should continue in 2018 with Asia Pulp & Paper’s entering with 2 million tons of pulp.
Value drivers and key assumptions
Suzano’s 4 main value drivers are: 1) international pulp and paper prices 2) the exchange rate of the Brazilian real 3) costs and 4) Brazilian paper demand. In this section we analyse each of these topics and present our forecasts.
1) Market price of hardwood pulp has a significant impact on Suzano’s
revenues as it represents 67% of revenues and 75% of production volume. In
our estimates, we assume a 700US$/ton on average for 2017, already reflecting the start-up of Fibria’s new mill in September. For 2018 we expect prices of pulp to fall throughout the year to an average of 640US$/ton after which a gradual recovery should take place with limited supply increases entering the market and a continued demand increase from emerging markets, reaching 660US$ per ton in 2021.
2) The second most important value driver for Suzano is the exchange rate of
the Brazilian Real as over 2/3 of the company’s revenues come from exports,
mainly to China, Europe and the US. A weaker BRL improves Suzano’s profitability and makes Brazilian companies more competitive against their foreign competitors. Suzano does takes some measures to protect its revenues from the volatility of the exchange rate, namely having the majority of its debt denominated in US$ and operating in the FX derivatives market, which smooths out some of the exchange rate variations, a fact that we reflect on our model. Having in mind that exchange rates are hard to predict, for our estimates of BRL/USD we opted to use for 2017 the most recent market expectations for the year average BRL/USD rate published weekly by the 32 34 36 38 40 0 100 200 300 400 500 600 700 800 900
Figure 18 Average Hardwood pulp port inventories - days of supply
Source: Bloomberg
Figure 17 Historical and forecasted average BHKP (average; USD per ton)
SUZANO PAPEL E CELULOSE COMPANY REPORT
Brazilian Central Bank Focus Report. For the evolution beyond 2017 we opted for the simple but nonetheless theoretically sound Purchasing Power Parity theory which states that the exchange rate between two currencies equals the ratio between its two purchasing powers. We therefore predict the evolution of the exchange rate between the US dollar and the Brazilian real based on the respective central banks inflation forecasts from 2018 to 2021. We recognize the shortcomings of this approach especially because the Brazilian real is sometimes referred by economists as a “commodity currency” along with currencies such as the Australian and Canadian dollar, the Norwegian krone or the Russian ruble. This term is a reference to the importance of commodities exports for these countries current account balances and therefore exchange rates. In the case of Brazil, international prices of iron ore, soy and petroleum are especially correlated with the currency’s value as increases in prices in these commodities generally translate in appreciation of the BRL, and vice-versa.
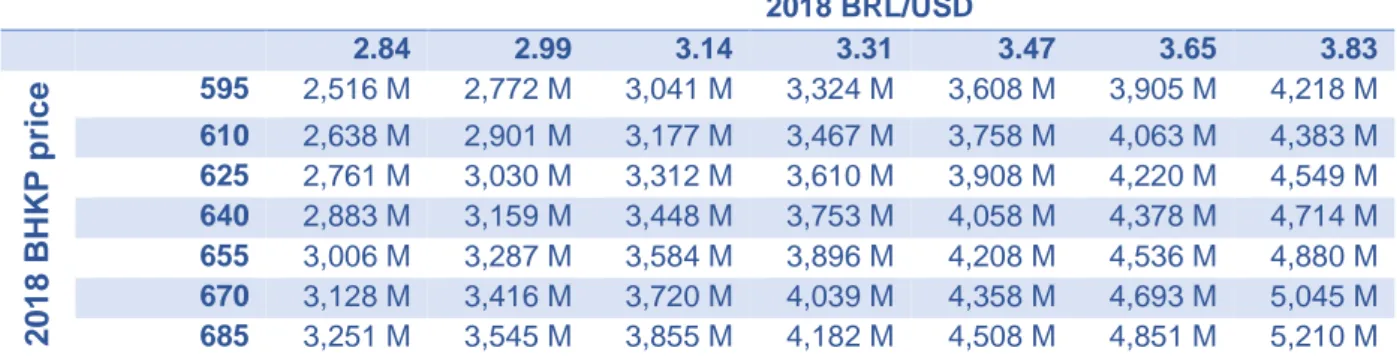
Figure 19 Sensitivity analysis of FY2018 EBITDA to changes in BRL/USD and market pulp prices (values in BRL)
3) Suzano’s focus on improving its cost structure is also an important factor in our valuation, especially in the pulp sector, where we expect a base case of a -5% yearly real reduction in total costs per ton, or a nominal compounded annual growth rate of -1.2%, after accounting for inflation. We assume total costs for pulp 1,155$R/ton in 2016 will fall to 1103$R/ton in 2021 as a result of Suzano’s cost reduction program. For the paper sector, we also expect cost reductions albeit lower than inflation from 2018 onwards: we assume a base case with a compounded nominal annual growth rate of 3% in paper costs, from 2086$R/ton in 2016 to 2338$R/ton in 2021.
2018 BRL/USD 2.84 2.99 3.14 3.31 3.47 3.65 3.83
20
18
B
H
K
P
pri
ce
595 2,516 M 2,772 M 3,041 M 3,324 M 3,608 M 3,905 M 4,218 M 610 2,638 M 2,901 M 3,177 M 3,467 M 3,758 M 4,063 M 4,383 M 625 2,761 M 3,030 M 3,312 M 3,610 M 3,908 M 4,220 M 4,549 M 640 2,883 M 3,159 M 3,448 M 3,753 M 4,058 M 4,378 M 4,714 M 655 3,006 M 3,287 M 3,584 M 3,896 M 4,208 M 4,536 M 4,880 M 670 3,128 M 3,416 M 3,720 M 4,039 M 4,358 M 4,693 M 5,045 M 685 3,251 M 3,545 M 3,855 M 4,182 M 4,508 M 4,851 M 5,210 MSource: Analyst Estimates
2.00 2.20 2.40 2.60 2.80 3.00 3.20 3.40 3.60 3.80
Figure 18 BRL/USD exchange rate; average of year
SUZANO PAPEL E CELULOSE COMPANY REPORT
Source: Suzano and analyst estimates
Financials
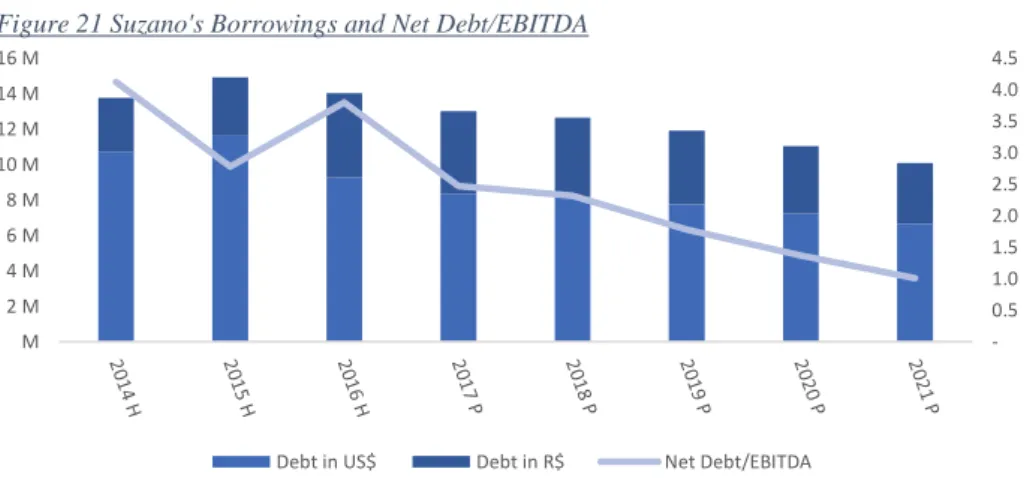
In order to finance its expansion program, Suzano has been increasing debt over the last years. The company has borrowings denominated both in local currency and in US dollars. By the end of 2016 Suzano’s total borrowings amounted to $R14,012 million, 78% of which was denominated in $US and the rest in $R. Suzano’s choice of having most of its debt in $US functions as a “natural hedge” against fluctuations of the Brazilian real. Firstly, because the majority of the company’s sales are negotiated and payed in $US, and therefore it becomes easier for the company’s financial department to match the company’s financing payments with its export revenues. Secondly, because the company records translation gains in its income statement which smooths the company’s earnings when there are variations in the exchange rate. The US$ debt consists mostly of long term bonds and also of “green bonds”, a type of tax-exempt bonds issued for the financing of “green” projects, i.e. business activities that are environmentally friendly.
The debt denominated in $R consists of bank loans and loans from BNDES (national bank for economic and social development). Capex will increase to $R1,800 million in 2017 (including $R700 million expansion CAPEX in the tissue project and debottlenecking of the Mucuri), after which we expect a sharp decrease in 2018 to $R1391 million, followed by gradual increases until it reaches $R1491 million in 2021. In terms of dividends, the company has a statutory minimum payout ratio of 25%. However, as we don’t assume any major projects for Suzano in the coming years, we expect that the company will opt to distribute a bigger percentage of its net income to shareholders in the next years, with the payout ratio gradually increasing from 25% in 2016 to 50% in 2021. Lastly, we assume that, with the remainder of the yearly cash flows, Suzano will use 80% to repay debt and keep 20% as profit reserves. With this capital distribution policy, Suzano’s net debt will
-0.5 1.0 1.5 2.0 2.5 3.0 3.5 4.0 4.5 M 2 M 4 M 6 M 8 M 10 M 12 M 14 M 16 M
Debt in US$ Debt in R$ Net Debt/EBITDA 0k 200k 400k 600k 800k 1,000k 1,200k 1,400k
Figure 20 Evolution of interest expense (values in BRL)
Source Company reports; analyst estimates
Figure 21 Suzano's Borrowings and Net Debt/EBITDA
SUZANO PAPEL E CELULOSE COMPANY REPORT
be reduced from $R11,305 mn in 2016 to $R6,405 mn in 2021 which in book value of net debt/equity means a decrease from 102% in 34%.
Consolidated Performance
Based in our forecasts, we expect consolidated revenues to increase from $R9,882mn in 2016 to $R11,815mn in 2021 at a CAGR of 3.6%. For costs of goods sold we expect an increase from $R6,572mn to $R7,265mn in the same period at a lower CAGR of 2%, reflecting the operational improvements that Suzano will continue to implement in its business. The revenue increase will come mostly from the increase in pulp capacity of 300k tons and the start up of the tissue business later this year as well as the expected increase in average price for both paper and pulp products over the 5 year forecast period. Net income should increase from $R1,692mn in 2016 to $R2,405mn in 2021.
ROIC is expected to increase from 4.33% in 2016 to 12.1% in 2021. It is worth mentioning that 2016 was a particularly bad year for brazilian pulp producers as revenues were negatively affected by a strong appreciation of the BRL. As a comparison, the average ROIC in the 2014-2016 period was 8.4%. The significant increase in ROIC can be explained by the improvement in operating margins as we expect EBITDA margins to increase in the coming years due to Suzano’s program of cost reductions and start of production of new value-added products such as tissue and fluff pulp.
0M 2,000M 4,000M 6,000M 8,000M 10,000M 12,000M 14,000M
Gross profit Operating revenues Cost of goods sold
Source: Company reports and analyst estimates Figure 22 Operating revenues, cogs and gross profit
SUZANO PAPEL E CELULOSE COMPANY REPORT
Valuation
Our target price for Suzano was reached through the method of Adjusted Present Value (APV). The APV was chosen over the more commonly used Discounted Cash Flow model due to the expectation of changes in the leverage level of Suzano, which is in a deleveraging process as we estimate that the company will have a Debt/Equity ratio of 0.34 in 2021, compared with the value of 1.1 in 2016. We discounted the unlevered free cash flows at the unlevered cost of capital and the tax shields at our estimated cost of debt.
Cost of capital
Our unlevered cost of capital was based on the Capital Asset Pricing Model with the following parameters:
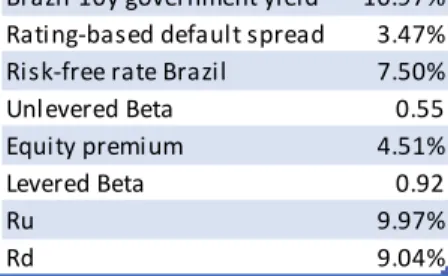
Risk-free rate – The risk free rate was calculated by subtracting the default
spread based on Moody’s current Ba2 rating of Brazil, from the 10y Brazil Federal Government bond yield. This yielded a risk free rate for Brazil of 7.5%.
Equity premium - We used a market risk premium of 4.51%, the implied
market risk premium according to Aswath Damodaran as of 1st May 2017
Unlevered beta - In order to calculate the unlevered beta, a group of 10
companies were selected. We selected companies that operate in the pulp & paper industry taking into account geographical diversity and similarity to Suzano’s business model. Additionally, we restricted our selection to companies based in emerging markets to better reflect the risk of Suzano’s business model. The stock returns of 240 weeks were then regressed against the Morgan Stanley Capital International World (MSCI) Index and were delevered using the company’s current capital structure, resulting in an average unlevered beta of 0.55, a value higher than Suzano’s value of 0.16. To assure that our beta was statistically significant, we also computed the 95% confidence interval for the individual unlevered betas: we reached a confidence interval of 0.55 +- 0.25, which we found acceptable. Valuation Data
Brazil 10y government yield 10.97%
Rating-based default spread 3.47%
Risk-free rate Brazil 7.50%
Unlevered Beta 0.55
Equity premium 4.51%
Levered Beta 0.92
Ru 9.97%
Rd 9.04%
Levered beta Unlevered beta lower 95% confidence upper 95% confidence CMPC CI Equity 0.54 0.54 0.30 0.79 COPEC CI Equity 0.75 0.75 0.56 0.94 SAP SJ Equity 0.55 0.54 0.23 0.85 2314 HK Equity 0.76 0.53 0.25 0.81 SUZB5 BZ Equity 0.26 0.16 -0.10 0.41 FIBR3 BZ Equity 0.25 0.15 -0.09 0.39 KLBN11 BZ Equity 0.70 0.41 0.19 0.63 MND SJ Equity 0.90 0.90 0.65 1.14 METSB FH Equity 0.95 0.86 0.60 1.11 MERC US Equity 1.06 0.65 0.41 0.89 Industry average 0.55 0.30 0.80
Figure 23 Unlevered beta calculations
Source: Bloomberg and analyst estimates Source Analyst estimates
SUZANO PAPEL E CELULOSE COMPANY REPORT
Unlevered cost of capital – Applying the Capital Asset Pricing Model
equation to the risk-free rate of 7.5%, 0.55 unlevered beta and 4.51% equity premium, we obtained an unlevered cost of capital of 9.97%.
Cost of Debt – We assumed that tax shields have the same risk of debt and therefore we discounted them at Suzano’s cost of debt. As Suzano only has publicly traded debt denominated in US dollars we added the difference between both central banks target inflation rates to the current yield of the company’s debt. This resulted in a rate of 9.4%. To calculate the real cost of debt we subtracted the probability of default times the recovery rate which was respectively 0.68 based on Suzano’s current credit rating and an assumed 50% recovery rate.
Adjusted Present Value
The continuing value was obtained through a perpetuity with a growth rate of 1.73%, computed by multiplying our last forecasted year ROIC of 12.1% with the investment rate estimated for 2021 – 14%. The investment rate for 2021 was computed over NOPLAT and net of depreciations and amortizations. Lastly, we discounted the unlevered free cash flows by the unlevered cost of capital and the tax shields by the cost of debt. This resulted in an enterprise value of R$ 28,239 million and, after subtracting Net Debt at current book values, an Equity value of $R16,933 million or $R15.29 per share.
Sensitivity Analysis
As the unlevered cost of capital and perpetuity growth rate have such a great impact on valuation, a sensitivity analysis was performed to test how our price target changes with variations in this two parameters.
2018 2019 2020 2021 Discount factor UFCF 91% 83% 75% 68%
Discount factor tax shields 92% 84% 77% 71%
Discounted tax shields 256,275 204,844 160,038 120,368
Discounted UFCF 1,395,793 1,484,242 1,560,647 1,603,353 PV UFCF 6,044,035 PV tax shields 741,526 Continuing Value ROIC (2021) 12.1% IR (2021) 14.3% g 1.7% FCF(2021) 2,345,164 Tax Shield (2021) 170,159 Continuing value UFCF 19,779,303 Continuing value TS 1,674,326
Total 21,453,629
Source Analyst estimates
Adjusted Present Value
Continuing value UFCF 19,779,303 Continuing value TS 1,674,325.71 PV UFCF 6,044,035 PV tax shields 741,526 Enterprize value 28,239,190 Net Debt 11,305,698 Equity Value 16,933,492 # of shares 1107738677 Dividend Yield 2.92% Target price 15.29 Current price 15.25 Price upside 0.2% Recommendation HOLD Total return 3%
SUZANO PAPEL E CELULOSE COMPANY REPORT
Figure 24 - SUZB5 price target sensitivity to growth rate in perpetuity and unlevered cost of capital
U
nlevered
co
st
of
ca
pit
a
l
Perpetuity growth rate
0.2% 0.7% 1.2% 1.7% 2.2% 2.7% 3.2% 11.47% 9.19 9.90 10.69 11.56 12.52 13.61 14.83 10.97% 10.05 10.83 11.70 12.66 13.74 14.95 16.33 10.47% 11.00 11.86 12.83 13.90 15.11 16.47 18.03 9.97% 12.04 13.00 14.08 15.29 16.65 18.21 20.00 9.47% 13.20 14.28 15.49 16.85 18.41 20.20 22.27 8.97% 14.49 15.70 17.08 18.64 20.43 22.51 24.95 8.47% 15.94 17.32 18.88 20.68 22.77 25.22 28.13
Source: Analyst estimates
Risks and Scenario Analysis
Suzano’s two business segments – market pulp and integrated paper – are subject to a great level of uncertainty. This is particularly truth regarding the market pulp segment as revenues are mostly denominated in US dollars and costs are mostly denominated in local currency. As mentioned in the “Value Drivers and Forecasts” section, our base case assumes that the evolution of the real against the dollar will be equal to the differential between the two currencies’ inflation rates. However, other factors may affect the future evolution of the Brazilian real such as political risks, international prices of the commodities exported by Brazil, among others. In order to complete our valuation, we include two additional scenarios corresponding to two possible different future states of the world: a pessimistic and an optimistic scenario. For both scenarios, we maintain the base case for 2017 as almost half of the year has already passed and the degree of uncertainty is much lower.
Pessimistic scenario - we define plausible (although pessimistic) values
for the Brazilian real and international pulp prices in the years beyond 2017. In this scenario, we assume an oversupply of pulp beyond 2017. Furthermore, we assume a lower-than-expected global paper consumption. The result is a fall in market pulp prices from 2017 onwards with a record low of 610 average price in 2018, after which we expect inefficient capacity closures should drive a gradual recuperation in prices in the following years until a long-term price of 630$/ton of BHKP is reached. Concerning the Brazilian real, for the pessimistic scenario we use an exchange rate against the US dollar 10% lower than in our base case. In this scenario our price target reduces to $R8.5, 44% lower than the current share price.
SUZANO PAPEL E CELULOSE COMPANY REPORT
Optimistic scenario – In our optimistic scenario we assume that the
world supply and demand for pulp continues balanced beyond 2017. We still assume a decrease in prices in 2018 with the entrance of 3.95k tons of additional pulp in the market, but to a lesser extent than in the base case (a 7% decrease vs 11% in the base case). Furthermore, we assume continued depreciation of the Brazilian real due to increase in political risks which further boosts the company’s revenues and value. In this scenario, our price target increases to $R20.6, 35% higher than the current share price.
Multiples valuation
To complement the APV valuation, we also compared our forecasts for FY2017 with the comparable companies chosen for the calculation of our unlevered beta. We used our own forecasts for Suzano and Factset analyst estimates for the
5 7 9 11 13 15 17 19 21
Jan-16 Jul-16 Jan-17 Jul-17 Jan-18 Optimistic $R20.6 +35% Base case $R15.3 <1% Pessimistic $R 8.5 -44%
Market Cap $US '000 Dividend yield % P/E EV/EBITDA Net debt/Market Cap Suzano Papel e Celulose SA (implicit) Brazil 3255 2.9 11.1 7.3 91.1
Fibria Celulose S.A. Brazil 5919 1.1 24.4 8.67 82.1
Klabin SA Brazil 5369 3.6 14.8 10.16 148.1
International Paper Company USA 21541 3.5 14.5 7.97 223.7
Stora Enso Oyj Finland 10122 3.4 15.0 8.11 41.3
Navigator Company SA Portugal 3207 6.9 15.9 9.13 1.6
UPM-Kymmene Oyj Finland 14941 4.0 14.7 8.57 -11.9
Empresas CMPC S.A. Chile 5992 0.7 35.3 8.79 45.2
Empresas Copec S.A. Chile 14734 1.2 28.2 10.01 48.2
Sappi Limited South Africa 4242 1.7 13.4 7.16 92.8
Lee & Man Paper Limited China 3799 3.9 8.8 8.52 80.5
Mondi Limited South Africa 3076 2.7 15.7 8.83 37
Metsa Board Corporation Finland 2718 3.1 17.1 9.65 24.4
Mercer International Inc. USA 741 4.0 10.5 5.41 115.2
Average 7415.4 3.1 17.6 8.5 71.4 Assumptions 2017 2018 2019 2020 2021 Base case BHKP Europe 720 640 650 655 660 USD/BRL 3.41 3.35 3.40 3.40 3.40 Pessimistic scenario BHKP Europe 720 610 620 625 630 USD/BRL 3.25 3.31 3.37 3.44 3.50 Optimistic scenario BHKP Europe 720 670 680 685 690 USD/BRL 3.25 3.47 3.54 3.61 3.68
Source: Analyst estimates and bloomberg Figure 25 Senarios assumptions and price targets
SUZANO PAPEL E CELULOSE COMPANY REPORT
comparable companies. The current market capitalization in $US, FY2017 dividend yield, FY2017 Price-to-earnings ratio, Enterprise value to FY2017 EBITDA and current Net Debt to Equity were the parameters chosen. We note that, for FY2017, Suzano looks to be at an attractive valuation when compared with its Brazilian and international peers, as only its dividend yield is expected to be below average.
Appendix – Financial Statements
Simplified Income statement 2015 H 2016 H 2017 P 2018 P 2019 P 2020 P 2021 P Unit: Br real '000
Operating revenues 10,224,361 9,882,313 10,084,516 10,254,126 10,834,077 11,331,784 11,815,444 Cost of goods sold (6,184,246) (6,571,622) (6,890,690) (7,058,797) (7,112,778) (7,177,396) (7,265,486)
Gross profit 4,040,115 3,310,691 3,193,826 3,195,330 3,721,299 4,154,388 4,549,959 Selling expenses (409,986) (408,810) (392,868) (378,967) (378,732) (373,467) (365,777) General and administrative expenses (455,629) (427,100) (425,754) (422,661) (435,732) (444,417) (451,570) Depreciation, Amortization, Depletion 1,419,475 1,403,521 1,341,037 1,359,324 1,396,336 1,428,099 1,458,966
Other non-recurent income (104,516) (1,157,688) - - - -
-EBITDA 4,489,459 2,720,614 3,716,241 3,753,026 4,303,171 4,764,603 5,191,578
EBIT 3,069,984 1,317,093 2,375,204 2,393,702 2,906,835 3,336,504 3,732,612
Taxes on operations n.a. (351,821) (634,463) (639,404) (776,472) (891,245) (997,053)
NOPLAT 3,069,984 965,272 1,740,741 1,754,298 2,130,363 2,445,259 2,735,559
Net interest (969,847) (795,020) (783,411) (670,214) (564,698) (459,080) (359,237)
Currency translation gains (2,828,407) 1,367,281 635,995 (151,676) (151,638) (151,159) (141,231)
Other financial gains (630,251) 528,839 - - - -
-Financial result (4,428,505) 1,101,100 (147,415) (821,890) (716,336) (610,240) (500,468) Taxes on financial items
Net financial result (2,922,813) 726,726 (97,294) (542,447) (472,782) (402,758) (330,309)
Net income 147,171 1,691,998 1,643,447 1,211,850 1,657,581 2,042,501 2,405,250
Comprehensive Income 267,625 1,528,720 1,643,447 1,211,850 1,657,581 2,042,501 2,405,250
Simplified Balance sheet 2015 H 2016 H 2017 P 2018 P 2019 P 2020 P 2021 P
Unit: Br real '000
Cash & equivalents 2,448,096 3,695,312 3,811,727 3,953,566 4,236,092 4,538,338 4,860,636
Receivables 2,578,851 2,619,351 2,931,407 2,976,771 3,088,461 3,185,838 3,282,575
Other current assets 1,562,072 1,714,843 1,609,440 1,644,451 1,630,418 1,640,226 1,648,525
Total current assets 6,589,019 8,029,506 8,352,574 8,574,789 8,954,971 9,364,401 9,791,736
Biological Assets 4,130,508 4,072,528 4,437,395 4,437,395 4,437,395 4,437,395 4,437,395
Property, Plant & Equipement 16,346,234 16,235,280 16,389,576 16,422,069 16,454,562 16,487,055 16,519,548
Other non-current assets 1,194,224 1,061,999 1,002,933 1,018,959 1,042,857 1,060,024 1,081,209
Total non-current assets 21,670,966 21,369,807 21,829,903 21,878,423 21,934,814 21,984,474 22,038,152
Total assets 28,259,985 29,399,313 30,182,477 30,453,211 30,889,785 31,348,875 31,829,888
Current Loans and financing 2,024,964 1,594,720 1,478,551 1,438,966 1,354,012 1,256,283 1,147,657
Payables 1,080,909 1,384,209 1,550,316 1,506,690 1,757,351 2,026,170 2,325,660
Other current liabilities 404,701 850,945 786,814 786,814 786,814 786,814 786,814
Total current liabilities 3,510,574 3,829,874 3,815,681 3,732,470 3,898,177 4,069,267 4,260,131
Non-current Loans and financing 12,892,378 12,418,059 11,513,455 11,205,202 10,543,672 9,782,659 8,936,787
Non-current payables 1,806,716 2,182,346 2,165,148 2,191,319 2,280,805 2,357,601 2,432,230
Other non-current liabilities 858,236 825,540 758,291 758,291 758,291 758,291 758,291
Total non-current liabilities 15,557,330 15,425,945 14,436,894 14,154,812 13,582,768 12,898,552 12,127,308
Total liabilities 19,067,904 19,255,819 18,252,575 17,887,282 17,480,945 16,967,819 16,387,439
Capital stock 6,241,753 6,241,753 6,241,753 6,241,753 6,241,753 6,241,753 6,241,753
Profits reserve 706,137 1,657,125 3,443,533 4,079,560 4,922,471 5,894,687 6,956,080
Other Equity 2,244,191 2,244,616 2,244,616 2,244,616 2,244,616 2,244,616 2,244,616
Total equity 9,192,081 10,143,494 11,929,902 12,565,929 13,408,840 14,381,056 15,442,449
SUZANO PAPEL E CELULOSE COMPANY REPORT
Disclosures and Disclaimers
Report Recommendations
Buy Expected total return (including expected capital gains and expected dividend yield) of more than 10% over a 12-month period.
Hold Expected total return (including expected capital gains and expected dividend yield) between 0% and 10% over a 12-month period.
Sell Expected negative total return (including expected capital gains and expected dividend yield) over a 12-month period.
This report was prepared by [insert student’s name], a Master in Finance’s student of Nova School of Business & Economics (“Nova SBE”), within the context of the Field Lab – Equity Research.
This report is issued and published exclusively for academic purposes, namely for academic evaluation and masters graduation purposes, within the context of said Field Lab – Equity Research. It is not to be construed as an offer or a solicitation of an offer to buy or sell any security or financial instrument.
This report was supervised by a Nova SBE faculty member, acting merely in an academic capacity, who revised the valuation methodology and the financial model.
Given the exclusive academic purpose of the research notesreports produced by Nova SBE students, it is Nova SBE understanding that Nova SBE, the author, the present report and its publishing, are excluded from the persons and activities requiring previous registration from local regulatory authorities. As such, Nova SBE, its faculty and the author of this report have not sought or obtained registration with or certification as financial analyst by any local regulator, in any jurisdiction. In Portugal, the author of this report is not registered with or qualified under COMISSÃO DO MERCADO DE VALORES MOBILIÁRIOS (“CMVM”, the Portuguese Securities Market Authority) as a financial analyst. Rosário André - as the academic supervisor of the author - is registered as a financial analyst with CMVM. No approval for publication or distribution of this report was required and/or obtained from any local authority, with the exception of CMVM, which regulates the issuance and publication of equity research reports.
Cash Flow Statememnt 2015 H 2016 H 2017 P 2018 P 2019 P 2020 P 2021 P
Unit: Br real '000
NOPLAT 3,069,984 965,272 1,740,741 1,754,298 2,130,363 2,445,259 2,735,559
Depreciations and amortizations 1,419,475 1,403,521 1,341,037 1,359,324 1,396,336 1,428,099 1,458,966
Operational cash flow 4,489,459 2,368,793 3,081,778 3,113,622 3,526,699 3,873,358 4,194,525
CAPEX 1,593,098 1,124,550 1,860,200 1,391,817 1,428,829 1,460,592 1,491,459
Variation in WC 1,344,086 (535,597) 272,314 61,931 78,288 84,599 83,969
Assets Other 1,483,995 (1,232,294) (96,194) (124,879) (224,531) (252,475) (273,933)
Investing cash flow 1,453,189 1,821,247 2,228,708 1,578,627 1,731,648 1,797,667 1,849,361
Unlevered FCF 3,036,270 547,546 853,070 1,534,996 1,795,052 2,075,691 2,345,164
Tax Shields 1,505,692 (374,374) 50,121 279,443 243,554 207,482 170,159
Loans 1,156,757 (904,563) (1,020,773) (347,838) (746,484) (858,741) (954,499)
Equity (1,270,214) (369,709) 264,997 (644,710) (575,786) (814,192) (1,060,357)
Interest (4,428,505) 1,101,100 (147,415) (821,890) (716,336) (610,240) (500,468)
Financing cash flow (3,036,270) (547,546) (853,070) (1,534,996) (1,795,052) (2,075,691) (2,345,164)
SUZANO PAPEL E CELULOSE COMPANY REPORT
The additional disclaimers also apply:
USA: Pursuant to Section 202 (a) (11) of the Investment Advisers Act of 1940, neither Nova SBE nor the author of this report are to be qualified as an investment adviser and, thus, registration with the Securities and Exchange Commission (“SEC”, United States of America’s securities market authority) is not necessary. Neither the Author nor Nova SBE receive any compensation of any kind for the preparation of the Reports. Germany: Pursuant to §34c of the WpHG (Wertpapierhandelsgesetz, i.e., the German Securities Trading Act), this entity is not required to register with or otherwise notify the Bundesanstalt für Finanzdienstleistungsaufsicht (“BaFin”, the German Federal Financial Supervisory Authority). It should be noted that Nova SBE is a fully-owned state university and there is no relation between the student’s equity research reports and any fund raising programme.
UK: Pursuant to section 22 of the Financial Services and Markets Act 2000 (the “FSMA”), for an activity to be a regulated activity, it must be carried on “by way of business”. All regulated activities are subject to prior authorization by the Financial Conduct Authority (“FCA”). However, this Report serves an exclusively academic purpose and, as such, was not prepared by way of business.The author - a Masters’ student - is the sole and
exclusive responsible for the information, estimates and forecasts contained herein, and for the opinions
expressed, which exclusively reflect his/her own judgment at the date of the report. Nova SBE and its faculty have no single and formal position in relation to the most appropriate valuation method, estimates or projections used in the report and may not be held liable by the author’s choice of the latter.
The information contained in this research notereport was compiled by students from public sources believed to be reliable, but Nova SBE, its faculty, or the students make no representation that it is accurate or complete, and accept no liability whatsoever for any direct or indirect loss resulting from the use of this report or of its content.
Students are free to choose the target companies of the research notesreports. Therefore, Nova SBE may start covering and/or suspend the coverage of any listed company, at any time, without prior notice. The students or Nova SBE are not responsible for updating this report, and the opinions and recommendations expressed herein may change without further notice.
The target company or security of this report may be simultaneously covered by more than one student. Because each student is free to choose the valuation method, and make his/her own assumptions and estimates, the resulting projections, price target and recommendations may differ widely, even when referring to the same security. Moreover, changing market conditions and/or changing subjective opinions may lead to significantly different valuation results. Other students’ opinions, estimates and recommendations, as well as the advisor and other faculty members’ opinions may be inconsistent with the views expressed in this report. Any recipient of this report should understand that statements regarding future prospects and performance are, by nature, subjective, and may be fallible.
This report does not necessarily mention and/or analyze all possible risks arising from the investment in the target company and/or security, namely the possible exchange rate risk resulting from the security being denominated in a currency either than the investor’s currency, among many other risks.
The purpose of publishing this report is merely academic and it is not intended for distribution among private investors. The information and opinions expressed in this report are not intended to be available to any person other than Portuguese natural or legal persons or persons domiciled in Portugal. While preparing this report, students did not have in consideration the specific investment objectives, financial situation or particular needs of any specific person. Investors should seek financial advice regarding the appropriateness of investing in any security, namely in the security covered by this report.
The author hereby certifies that the views expressed in this report accurately reflect his/her personal opinion about the target company and its securities. He/ She has not received or been promised any direct or indirect compensation for expressing the opinions or recommendation included in this report.