Universidade de Trás-os-Montes e Alto Douro Departamento de Zootecnia
Effects of nitrate and additional effect of probiotic on
methane emissions and dry matter intake in Nellore
bulls.
Alcina Maria Domingos Ascensão
Orientadores: Rob Hulshof, MSc Researcher Carbon Footprint Provimi Research Centre The Netherlands Prof. Doutor Divanildo Outor Monteiro
Departamento de Zootecnia Universidade de Trás-os-Montes e Alto Douro
Prof.ª Doutora Ana Luísa Guimarães Dias Lourenço Departamento de Zootecnia Universidade de Trás-os-Montes e Alto Douro
Dissertação do 2º Ciclo de Estudos de Engenharia Zootécnica (Grau de Mestre) apresentada à Universidade de Trás-os-Montes.
As doutrinas apresentadas são da exclusiva responsabilidade do autor
V Preface
This thesis is a product of collaboration between University of Trás-os-Montes and Alto Douro (UTAD) and the company Provimi - Feed solutions, from the department of Carbon Footprint (The Netherlands). Solving problems in the area of animal nutrition for years, Provimi also addresses the impact of enteric methane, produced by ruminants, on global warming. Mitigation of enteric methane can be achieved with nitrate, as calcium ammonium nitrate.
This thesis reports an experiment conducted in Brazil, São Paulo State, Colina in association with Nutron, a subsidiary company of Provimi and Instituto de Zootecnia de Colina.
The report is untitled “Effects of nitrate and additional effect of probiotic on methane emissions and dry matter intake in Nellore bulls”. The first chapter of this report gives an overview on actual concerns about Animal Production and environment.
The second chapter presents an overview on methane emissions in the world and specifically in Brazil where the trial was conducted, a brief summary of the enteric methane production process and ways to reduce enteric methane production as a guideline to understand the subsequent and main topic in this thesis: use of nitrate as a diet compound to reduce enteric methane emissions.
The Methane Trial it’s presented on chapter three.
According to Leng (2008), current researches on the use of nitrate in ruminant diets did much to stifle interest in this area. When the level of nitrate incorporated in a diet is sufficient to maintain optimum fermentation rate, it can also mitigate enteric methane production (Leng, 2008).
VII Abstract
This study aimed to assess the potential of nitrate as a dietary component to reduce enteric methane productions. The main focus of previous researches with ruminants and nitrate was the toxic effect of nitrite, called methemoglobinemia.
The animals were exposed to different diets in three different periods. Six days gas collections were completed for each bull in each of three collection periods using the SF6 tracer gas technique. Sixteen animals (245 ± 13kg), submitted to a neutral diet
during the first period, were randomly allocated to a treatment blocked for methane emission per kg of DMI. Eight animals were allocated to a diet with urea and the others eight bulls to a nitrate diet (2.15% DM basis). During the third period, eight bulls received nitrate diet and the other eight bulls, beyond the nitrate diet, were drenched with 200 ml of probiotic (Megasphaera elsdenii).
In the second period daily methane production (g/day) was 41.6% lower from bulls fed a nitrate diet than from bulls fed an urea diet (P<0.001). Nitrate diet produced less methane (expressed by g/kg of DMI) than urea diet (P<0.001). Methane production (% GEI) was 5.6% on urea diet and 3.1% on nitrate diet, resulting in a production of less 41.1% with nitrate diet compared with urea diet (P<0.001). The DMI was not different between treatments (P>0.05).
In the third period the nitrate diet plus probiotic had a lower daily methane emissions (P<0.05). However there were no significant differences between treatments, when methane emission was expressed per kg DMI or GE intake (P>0.010). Furthermore no differences were found in DMI (P=0.13).
Data obtained in this study showed that nitrate as a high potentiality to reduce methane emissions.
IX Resumo
Este estudo foi realizado para avaliar a potencialidade do nitrato como componente na dieta para reduzir a produção de metano entérico. Estudos prévios acerca de ruminantes e nitrato focavam-se principalmente na toxicidade do nitrito observada aquando da incorporação de nitrato nas dietas.
Os animais receberam diferentes dietas em três diferentes períodos. A recolha de metano foi efectuada durante seis dias em cada animal e em cada período, utilizando a técnica do gás traçador SF6. Dezasseis animais (245 ± 13kg), submetidos a uma dieta
neutra durante o primeiro período foram aleatoriamente distribuídos a um tratamento pela produção de metano por kg de matéria seca. No segundo período, a oito animais foi atribuída a dieta com ureia e aos restantes oito animais a dieta contendo nitrato (2,15% base MS). Durante o terceiro período, oito animais receberam uma dieta com nitrato e os outros oito animais, para além da dieta contendo nitrato, receberam 200 ml de probiótico (Megasphaera elsdenii).
No segundo período a produção diária de metano (g/dia) nos animais alimentados com a dieta de nitrato foi 41,6% mais baixo que nos animais que receberam a dieta com ureia (P<0,001). A dieta contendo o nitrato produziu menos metano expresso em g/kg de IMS (P<0,001). A produção de metano (% energia bruta ingerida) foi de 5,6% na dieta de ureia e 3,1% na dieta de nitrato, resultando numa redução de 41,1% com a dieta de nitrato quando comparado com a dieta de ureia (P<0,001). A ingestão de matéria seca não foi diferente entre os tratamentos (P>0,05).
No terceiro período, na dieta de nitrato com probiótico observou-se uma menor produção de metano (P<0.05). No entanto, não houve diferenças significativas entre os tratamentos, em relação às emissões de metano expressas em kg de matéria seca ou energia bruta ingerida (P>0,10). Além disso, não foram encontradas diferenças na ingestão de matéria seca (P=0.13).
Dados obtidos neste estudo mostraram que o nitrato tem uma grande potencialidade para reduzir as emissões de metano.
Palavras-chave: bovinos Nelore, gases de efeito de estufa, metano, nitrato, Megasphaera
XI Acknowledgments
I wish to take this opportunity to express my gratitude to Rob Hulshof, for his continuous support, encouragement and patience, and to give me the opportunity to gain his trust and friendship. His continuous good mood and humor was always welcome.
To Dr. Hink Perdok: his deep knowledge and his ability to answer questions in a very precise way have always been of great help. Thank you for allowing me to join in Carbon Footprint team.
The working environment at Instituto de Zootecnia de Colina was enjoyable by the staff and students that I meet there. A special thanks to Alexandre Berndt for the guidance, advice and theoretical support.
To my supervisors: Dr. Divanildo Outor Monteiro and Drª. Ana Luísa Guimarães Dias Lourenço. I’m gratefully for the support and correction of this thesis.
To my parents Ana and Adelino, my sisters Ana Cristina and Susana, my brother-in-law Jorge and my beautiful niece Simone, for the love expressed kilometers away…
To my friends at UTAD, CAH and to my best friends…thank you for all. To Leonel...my better half.
XIII Contents
Table Index ... XV Figure Index ... XVII List of Abbreviations ... XIX
Chapter 1 ... 1
1. Introduction ... 3
Chapter 2 ... 5
2.1 Methane emissions - World and Brazil ... 7
2.3 Mitigate enteric methane production ... 12
2.3.2 Direct inhibition of methanogenisis ... 13
2.3.3 Redirect hydrogen utilization ... 14
2.4 Nitrate as a diet compound to reduce enteric methane emissions ... 17
Chapter 3 ... 23
3.1. Introduction ... 25
3.1.1. Objectives ... 26
3.2.1. Experimental Design and Animals ... 26
3.2.2. Treatments and Diet ... 26
3.3. Methods ... 30
3.3.1. Intake... 30
3.3.2. Measurements of Methane Emissions ... 31
3.4. Statistical analysis ... 31
3.5. Results ... 32
3.6. Discussion ... 37
3.7. Conclusion ... 40
Appendix ... 51
Appendix 1: ‘Instructions for the activation of the PRO-probiotic’... 53
Appendix 2: Domestication of the animals (Instituto de Zootecnia de Colina) (Author photographs). ... 55
Appendix 3: Sulphur hexafluoride (SF6) tracer gas technique (Instituto de Zootecnia de Colina) (Author photographs). ... 56
XV Table Index
Table 1. Sources of anthropogenic greenhouse gases: World and Brazil...8
Table 2. Agriculture sources of non-CO2 greenhouse gases...8
Table 3. Some estimated toxic doses of nitrates for ruminants. In all cases these were measured in both laboratory trials and in field trials where outbreaks of nitrate poisoning had occurred (Leng, 2008)...18 Table 4. Diet composition...29
Table 5. Initial body weight, LS means of methane emissions and dry matter intake from bulls fed a neutral diet1 during the first period...33 Table 6. Initial body weights and LS means of dry matter intake and methane emissions from bulls fed a diet with urea or calcium nitrate during the second period...34 Table 7. Initial body weights, dry matter intake and methane emissions from bulls fed a diet with nitrate or nitrate plus probiotic during the third period...36
XVII Figure Index
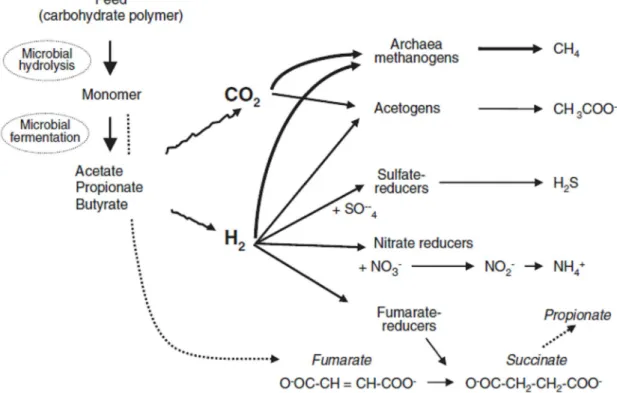
Figure 1: Metabolism of NADH H+ and the electron sink products in anaerobiosis (Moss et al., 2000)...10 Figure 2: Schematic microbial fermentation of feed polysaccharides and H2 reduction
pathways in the rumen (Morgavi et al., 2010)...11 Figure 3: Relationship between methane produced in vivo and in vitro from a range of diets (Moss and Givens, 1997)...21 Figure 4: From the top: [1] Sugarcane bagasse; [2] Concentrate for urea diet and [3] Concentrate for nitrate diet (Author photographs)...27 Figure 5: Schedule of the adaptation period to nitrate diet for the second period and methane collection days...29 Figure 6: Schedule of the adaptation period to nitrate diet for the third period, probiotic administration and methane collection days...30 Figure 7: Comparison of dry matter intake and methane productions expressed in percentage between urea diet and nitrate diet. ...35 Figure 8: Average methane production per kg DMI per collection day for the two treatments...35
XIX List of Abbreviations
ANRA - Assimilatory Nitrate Reduction to Ammonia
ATP – Adenosine Triphosphate
BW – Body Weight
CH4 – Methane
CO2– Carbon dioxide
DMI – Dry Matter Intake
DNRA – Dissimilatory Nitrate Reduction to Ammonia
GEI – Gross Energy Intake
GHG – Greenhouse Gases
H2 - Hydrogen
IPPC – Intergovernmental Panel on Climate Change
IR - Solar Infrared
NAD+ - Nicotinamide Adenine Dinucleotide
NADH – Reduced form of NAD+
NH3 - Ammonia
NPN - Non Protein Nitrogen
NRB – Nitrate Reducing Organisms
PR – Permeation Rate
SF6 - Sulphur Hexafluoride
Chapter 1
Introduction
3 1. Introduction
Nowadays, there is a great conflict between the economical and the environmental sectors, about the way to forward development, productive activities, life of citizens and corporations (Primavesi et al., 2007).
Limiting global warming remains the priority and biggest challenge of the XXI century (FAO, 2006). The radiation forcing of the climate system is dominated by the long-lived Greenhouse Gases (GHGs) (IPPC, 2007). The greenhouse effect is the result of the absorption of solar infrared (IR) radiation by gases and the earth’s surface, which, as a result, is heated and then reemits IR radiation at low frequency with a high absorptive power (Moss et al. 2000).
Between 1970 and 2004, the largest growth in GHG emissions has come from energy supply, transport and industry, while residential and commercial buildings, forestry (including deforestation) and agriculture sectors have been growing at a lower rate (IPPC, 2007).
According to FAO (2009), 40% of the global value of agricultural output comes from the livestock sector and support the livelihoods and food security of almost a billion people. Also reported by FAO (2009), this sector as a decisive action for poverty reduction and food security, environmental sustainability and improved human health But, this sector is going through a complex process of change, both technical and geographical, which is shifting the balance of environmental problems caused by the sector (FAO, 2006). Corrective action is needed to encourage the provision of public goods, such as valuable ecosystem services and environmental protection (FAO, 2009).
Growing global population and increased economic means in developing countries suggest continually growing food demand and, therefore, meat demand. The beef industry’s ability to produce high quality food using marginal agricultural resources not suitable for crop production is a particular advantage for beef, compared to other livestock industries (Peel, 2010). According to Kronberg et al. (2010) FAO estimates world food production will need to increase 70% by 2050 to feed an additional 2.3 billion people, giving a total of 9.1 billion.
The most important gas associated with climate change is carbon dioxide but there are other greenhouse gases, such as methane, nitrous oxide, ozone and sulphur hexafluoride that also contribute (FAO, 2006).
Ruminant livestock, globally, are a large and growing source of greenhouse gas emissions (Janzen, 2010). In average, cattle lose 6% of the gross energy intake as methane which acts as powerful GHG in the atmosphere (Johnson and Johnson, 1995). In addition, CH4 is considered 25 times more powerful at warming the atmosphere
than CO2 (Foster et al., 2007). Enteric methane emissions are predictable to grow by
over 30% from 2000 to 2020 (O’Mara, 2010).
There are mitigation possibilities, but it is crucial to develop new technologies (O’Mara, 2010). Examples of strategies to mitigate enteric methane per kg beef are presented in Perdok and Newbold (2009). These include younger age at first calving and shorter calving interval, minimise involuntary culling, higher longevity of breeding stock, improve genetic merit of animals and crops, optimise diet formulation, supply supplements such as NPN and minerals (“proteinated salts”), improve animal health and disease control and improve feed conversion efficiency.
Ruminants fed on temperate forages produce less methane that the ones fed on tropical ones. Brazil is the biggest beef producer in the world and the vast majority of its herd grazes in what was forest 100 years ago (Neto, 2010). There are some factors that can negatively influence fiber digestion and consequently methane production, such as the presence of secondary compounds (e.g., tannins) in tropical legumes and the predominant C4 photosynthetic pathway in tropical grasses (Archimède et al., 2010).
Meanwhile, Provimi – Feed Solutions with its partners in Brazil work on additional strategies to reduce the Carbon Footprint of beef production. High quality animal feed generally increases animal productivity and decreases the amount of greenhouse gases emitted per kilogram of product. The impact of diet composition on methane production is the main focus of Provimi Ruminant Research.
Chapter 2
Literature Review
7 2.1 Methane emissions - World and Brazil
Changes in atmospheric concentrations of Greenhouse Gases (GHGs) and aerosols, land cover and solar radiation modify the energy balance of the climate system and are drivers of climate change. Carbon dioxide (CO2), methane (CH4),
nitrous oxide (N2O) and halocarbons (a group of gases containing fluorine, chlorine or
bromine) are the four long-lived GHGs resultant from anthropogenic activities (IPCC, 2007).
Since 1750, global atmospheric concentrations of CO2, CH4 and N2O have
increased noticeably as a result of human activities and nowadays far exceed pre-industrial values determined from ice cores spanning many thousands of years (IPCC, 2007).
According to Moss et al. (2000), CH4 is the second most problematic GHG after
CO2.
According to IPCC (2007) agriculture may account 17-32% of all anthropogenic GHG emissions and 32% of the anthropogenic CH4 emission in the world, comes from
Ruminant Livestock (Perdok and Newbold, 2009).
Brazil is one of the top world GHG emitters, and a large majority of Brazil’s GHG emissions, comes from burning linked to deforestation of the Amazon biome. (Cerri et
al., 2009).
Preliminary estimations of greenhouse gases emissions made for Brazil showed that ruminant livestock is the main source of methane from agricultural activities (EMBRAPA, 1999). USEPA (2000) reported that 50% of ruminant’s population in the world, mainly bovine, is located in tropical regions. According to Brazilian Institute of Geography and Statistics (2009), Brazil has now around 190 million bovine heads, mostly zebu breeds (Demarchi et al., 2003), producing 9.4 million tons of CH4 per year –
2.5% of the total gas produced in the world, the equivalent to 69% of Brazilian methane emission (Berndt, 2010).
A resume of methane emissions in numbers is expressed on the tables below (Table 1 and Table 2) (Perdok and Newbold, 2009).
Table 1. Sources of anthropogenic greenhouse gases: World and Brazil.
Sources: World: IPCC, 2007; Brazil: calculated from Cerri et al., 2009 cited by Perdok and Newbold (2009).
Table 2. Agriculture sources of non-CO2 greenhouse gases.
World (%) Brazil (%)
N2O emissions from soils 38 42
CH4 from enteric fermentation 32 53
Biomass burning 12 1
Wetland rice production 11 1
Manure management 7 3
Sources: World: IPCC, 2007; Brazil: calculated from Cerri et al., 2000 cited by Perdok and Newbold (2009).
GHG emissions and sinks were published in 2004 in the report entitled “Brazil’s Initial National Communication to the United Nation Framework Convention on Climate Change”. (Cerri et al., 2009).
Source World (%) Brazil (%)
Energy supply 25.9 17.5
Industry 19.4 1.8
Land use change and forestry (LUCF) 17.4 56.4
Agriculture 13.5 23.1
Transport 13.1 -
Residential & commercial buildings 7.9 -
9
2.2 Ruminal Fermentation and the Production of Methane
The farming of ruminant livestock is a leading contributor to the growth of methane in the atmosphere (Lassey et al., 2007). That is a result of the complex microbiological fermentation that breaks down cellulose and other macro-molecules in the rumen. The methane generate is mainly expelled via eructation (80 to 95% according to Martin et al., 2008) through the mouth and nose (Moss et al., 2000).
Microbial enzymatic activity in the rumen (and salivary enzymes), hydrolyses much of the dietary organic matter to amino acids and simple sugars (O’ Mara, 2004). During the oxidation of sugars, NAD+ is reduced to NADH which has to be reoxidised
to NAD+ to allow fermentation to continue. Under anaerobic rumen conditions, NAD+
must be regenerated by electron transfer to acceptors other than oxygen (McAllister and Newbold, 2008). In the absence of oxygen, carbon from CO2 is the ultimate
acceptor of hydrogen ions, thus generating CH4. (McDonald et al., 2002).
The end products of the sugars oxidation are the volatile fatty acids (VFA) – mainly acetic, propionic and butyric acids – CO2 and hydrogen, are produced in high
quantity during the synthesis of acetic and butyric acids (O’ Mara, 2004 and Nascimento et al., 2007) (Figure 1).
But the major producers of H2 are the organisms which produce acetic acid in the
fermentation pathway (Hegarty and Gerdes, 1998). A decreased emission of methane associated with an increase in acetate available to the host animal is a desirable condition that, combined with the observation that reductive acetogenesis is the main electron sink observed in many non-ruminant herbivores (Klieve and Ouwerkerk, 2007).
Figure 1. Metabolism of NADH H+ and the electron sink products* in anaerobiosis. (Moss et al., 2000).
Methanogenic organisms on mixed microbial ecossystem, belonging to gender such as Methanobrevibacter, Methanobacterium, Methanomicrobium and Methanosarcina use the hydrogen (H2) (Wolin et al., 1997) through combination with some of the CO2 to
produce methane(O’ Mara, 2004), as shown in the reaction below (Moss et al., 2000 and Morgavi et al, 2010).
As a consequence the syntheses of acetic and butyric acids in the rumen enhance the CH4 production in the rumen.
Although, the presence of others electron acceptors than CO2 has an effect on the
11
Figure 2. Schematic microbial fermentation of feed polysaccharides and H2 reduction
pathways in the rumen (Morgavi et al., 2010).
Among H2 producers, protozoa have a prominent position, which is
strengthened by their close physical association with methanogens, which favours H2
transfer from one to the other (Morgavi et al., 2010). Other function that is associated with production of H2, also reported by Morgavi et al. (2010) is the degradation of
fibrous plant material. If the transfer between H2 producers and H2 interspcies is
affected, the build-up of H2 in the milieu inhibits the reoxidation of co-enzymes
involved in redox reactions within bacterial cells, ultimately depressing the fermentation processes. This is the reason why methanogenesis is intimately linked to degradation of plant fibre in the rumen (Morgavi et al., 2010).
In the productive system of ruminants, nutritionists challenge is to develop strategies to mitigate methane production (Martin et al., 2008) that increase daily gain (Perdok and Newbold, 2009). In this way less feed is spent on maintenance and total lifetime methane emissions are reduced, resulting in less CH4 per kg live weight or per
2.3 Mitigate enteric methane production
Considerable effort is being devoted to strategies that will reduce CH4 production
by ruminal microorganisms. These strategies are at various stages of development, with relatively few inhibitors commercially available or economically feasible to the producer (Guan et al., 2006).
In considering strategies to decrease methanogenesis in the rumen, several scenarios can be envisaged (Martin et al., 2008; McAllister and Newbold, 2008):
i)direct inhibition of methanogenesis with the need to redirect H2 into alternative
products;
ii) decrease H2 production in the rumen (without affecting feed
fermentation);
iii) redirect hydrogen utilization (H2 consuming pathways).
To better understand how these alternatives can reduce the enteric methane production, some examples are explained below.
2.3.1 Decrease hydrogen production
Protozoa
Protozoa play an active role in ruminal sugar and fibre fermentation. Coleman (1986) estimated that protozoa might be responsible for up to 50%of fibrolytic activity within the rumen.
The removal of protozoa from the rumen (defaunation) was reported to be associated with decreases in methane production (Ushida et al., 1997). However, contradictory results have been reported between in vitro and in vivo data and between short- and long-term defaunation experiments (Ranilla et al., 2003), and it remains unclear to what extent defaunation would reduce ruminal methogenesis. McAllister and Newbold
13
groups were fed a mix of concentrate supplement and grass hay (60:40). Protozoa-free lambs produced 26% less methane per kg DM intake than faunated lambs.
Diet
The type of feed offered can have a major effect on methane production. The forage:concentrate (F:C) ratio of the diet has an impact on ruminal fermentation and consequently on the acetate: propionate ratio, that decrease with declining F:C. Propionate is probably the major alternative hydrogen sink after CH4, it would therefore be expected that methane production would be less when high concentrate diets are fed (Fahey and Berger, 1988). Johnson and Johnson (1995) reported that enteric methane represents an energy loss of 6–7% of gross energy intake when forages were fed at maintenance, and that this proportion was reduced to 2–3% when high grain concentrates (>90%) were offered at near-ad libitum levels.
2.3.2 Direct inhibition of methanogenisis
Plant extracts
There is an interest in the use of natural products as feed additives to manipulate enteric fermentation and possibly reduce enteric CH4 production (Boadi et al., 2004).
Broudiscou et al. (2000) screened 13 plant extracts for their influence on fermentation in
vitro and observed that protozoa numbers were affected.
García-González et al. (2006) suggested that rhubarb (Rheum palmatum) might directly inhibit ruminal methanogens; nevertheless, most research to date has focussed on garlic (Allium sativum). Busquet et al. (2005) examined the effect of garlic oil on ruminal fermentation using an in vitro batch culture system. Methane production after 17 h incubation was significantly reduced by garlic oil, allyl mercaptan and diallyl disulfide at 300mg/L. (Ferme et al., 2007).
Recently confirmed these findings, reporting that garlic extracts also changed the structure of the archaeal methanogen community in the rumen. These results suggest that allicin may inhibit rumen methanogens directly (McAllister and Newbold, 2008).
Immunisation
Research in Australia suggests that vaccination against methanogens may be another plausible method for mitigating methanogenesis (Wright et al., 2004). Immunisation of sheep with a mixed whole-cell preparation from three methanogens reduced methane production (per kg DM intake) by 7.7%.
Development of a recombinant vaccine against cell surface proteins that are conserved across a broad range of methanogen species may improve the effectiveness of vaccination as a methane mitigation method (McAllister and Newbold, 2008).
Bacteriophages and bacteriocins
Biological control strategies such as bacteriophages or bacteriocins could prove effective for directly inhibiting methanogens and redirecting hydrogen to other reductive rumen bacteria such as propionate-producers or acetogens. Bacteriophages are obligate microbial viruses that infect both bacteria and archaea and lyse their hosts during the lytic phase of their development. (McAllister and Newbold, 2008).
To date, no phages specific to rumen methanogens have been reported, but diverse phage populations are known to be present in anaerobic environments such as methanogenic biodigesters (Park et al. 2007). McAllister and Newbold (2008) reported that. siphoviridae phages (siphophages) are known to infect methanogens such as
Methanobacterium, Methanobrevibacter and Methanococcus spp. but siphophages have yet to be isolated from the rumen.
2.3.3 Redirect hydrogen utilization
Ionophores
Ionophores, which are added to ruminant diets to improve the efficiency of feed utilization, have been shown to decrease CH4 production (Mathison et al. 1998). This
15
acts as hydrogen sink. However, methane reduction (-25%) is not persistent and after 2 weeks there is no reduction per unit of intake (Carmean et al., 1991). Other studies reported by McCaughey et al. (1997) and Sauer et al. (1998) also shown that CH4
production was not suppressed with prolonged or repeated use of ionophores.
Organic acids
Newbold et al. (2005) recently completed a comprehensive evaluation of 15 different potential propionate precursors.
Fumaric acid is an intermediate in the propionic acid pathway, in which it is reduced to succinic acid. In this reaction, H2 ions are needed and therefore reducing
fumaric acid may provide an alternative electron sink for H2 (Boadi et al., 2004).
Fumarate and acrylate produced the most consistent reductions in methane formation in batch culture, and fumarate was more effective than acrylate in artificial rumens. Fumarate (3.5 g/L) has been shown to reduce methane output by 38% in continuous fermenters with forage as substrate (Kolver et al., 2004). Including multiple forms of propionate precursors in the diet could yield an additive inhibition of methane emissions as the reductive pathways differ among organic acid sources.
In contrast, methane emissions by growing beef cattle were unaffected by fumarate fed as 1% of DM intake (McGinn et al., 2004; Beauchemin and McGinn, 2006) and only a small, non-significant reduction in methane was noted when 3% malate was added to the diets of dairy cows (O’Mara, 2004). At this point, even if supplementing diets with organic acids would suppress methane emissions it seems uneconomical (McAllister and Newbold, 2008).
Fatty acids
Coming from coconut, canola, or kernel, oils contain fatty acids that increase the energy density of the diet (Kumar et al., 2009). Fatty acids provide an alternative hydrogen sink and inhibit protozoa (Johnson and Johnson 1995). For example, methane production were reduced by 22% when fed sunflower oil (400 g/d, approximately 5% of DMI) (McGinn et al., 2004) however, Beauchemin and McGinn (2006) found that feeding canola oil as additives also reduce animal performance due to lower feed
intake and fibre digestibility. Martin et al. (2008) studied three forms of presentation of linseed fatty acid: crude linseed (CLS), extruded linseed (ELS) and linseed oil (LSO). Daily methane production was significantly reduced CLS 12%, ELS 38% and LSO -64% but the milk production decreased for ELS and LSO compared with Control and CLS. The use of linseed reduces methane production, but the productivity seems to be affected. More research is needed to show that these products are sustainable.
Nitrate and Sulphate
The thermodynamics of the conversion of nitrate into NH3 is more favourable
than the formation of methane and can effectively replace methanogenesis in the rumen if nitrate is available (Morgavi et al, 2010).
The Gibbs free energies of propionic and butyric acids fermentation, which are positive under standard conditions, can become negative at H2 partial pressures (Chen,
2003). Kumar et al. (2009) report that reactions consume high amounts of H2. Thus,
when methanogenic consortia are major competitors in an anaerobic mixed culture, the efficient use of hydrogen for dehalogenation can be obtained by strategies that maintain hydrogen at a certain concentration (Chen, 2003).
Nitrate is a potent inhibitor of methanogenesis in all systems from fermentative digestion in the rumen to secondary fermentation in a wide range of systems from anaerobic biodigestors to sediments (Hungate 1965; Allison et al., 1981; Akunna et al., 1994, cited by Leng, 2008). However, ways must be found to reduce risks of toxicty, caused by intermediates of nitrate and sulphate metabolism, before this approach can be used in practice (Perdok and Newbold, 2010).
Sulphate-reducing bacteria, Denitribacterium detoxificans and Wolinella succinogenes utilise sulphate, as electron acceptor (Weimer, 1998; Anderson et al., 2000; Simon, 2002) other than CO2 to oxidise H2 (Morgavi et al., 2010). In the other hand, the
17
2.4 Nitrate as a diet compound to reduce enteric methane emissions
As mentioned in 2.1., the major hydrogen (electron) sink in the rumen is methane, produced by the reduction of carbon dioxide using reduced co-enzymes such as NADH as the electron source.
Carbon dioxide can be replaced by nitrate as an electron acceptor with the generation of another reduced product - in this case, ammonia, i.e. nitrate is reduced to nitrite and then to ammonia (Leng, 2008).
(1 mol of nitrate would produce 1 mol of ammonia and reduce methane production by 1mol (Leng, 2008)).
Bacteria that reduce nitrate to ammonia are more active in the rumen when substantial amounts of nitrate have been included in a diet for extended periods (Leng, 2008).
Understanding the metabolism of nitrate in the animal will be the key to enable the use of nitrate as a nutrient and as anti methanogenic compound in the rumen.
Nitrate reduction in anaerobic systems occurs by two distinct pathways: dissimilatory nitrate reduction to ammonia (DNRA) and assimilatory nitrate reduction to ammonia (ANRA) (Leng, 2008).
The DNRA is the production of ammonia by reduction of nitrate and/or nitrite which occurs when redox potential values in the medium are low (Knowles, 1982 cited by Leng, 2008). This often occurs in the presence of sulphide (Brunet and Garcia-Gill, 1996) or high organic matter concentrations (Hungate, 1965 cited by Leng 2008; Akunna et al., 1993) and is affected by the nature of the carbon source (Akunna et al., 1993).
The ANRA involves enzymes that catalyze the reduction of nitrate to nitrite and then to ammonia. Nitrate is reduced to nitrite by NADH reduction and nitrite is reduced to ammonia by assimilatory nitrite ammonification which is coupled to ATP formation (Simon, 2002).
Assimilatory nitrate reduction has important advantages for the efficiency of energy use in microorganisms compared with methane generation because the energy lost in methane by the second is conserved in microbial biomass by the first (Leng, 2008).
Nitrate in ruminant feeds can generate the condition, methemoglobinemia (Crawford et al., 1966), which reduces feed intake and productivity and can be fatal. The toxic agent, nitrite, is absorbed from the rumen binds to haemoglobin of red blood cells limiting tissue supplies of oxygen (Bradley et al., 1939). The majority of research on nitrate in ruminant diets has been focused on its toxic role and the lethal dose of nitrate as reported in the literature is extremely variable (O’Hara and Fraser, 1975; Bradley et al., 1940; Crawford et al., 1966; Wnght and Davison, 1964; Deeb and Sloan, 1975; Ruhr and Osweiler, 1986; Setchell and Williams 1968 cited by Leng, 2008) (see Table 3).
Table 3. Some estimated toxic doses of nitrates for ruminants. In all cases these were measured in both laboratory trials and in field trials where outbreaks of nitrate poisoning had occurred (Leng, 2008).
Dose (mg nitrate/kg body weight)
Reference
198-998 O’Hara and Fraser, 1975
326 716
Bradley et al., 1940 Crawford et al., 1966
19
In almost all similar experiments, the animals used were on feed but had not been adapted to nitrate (see examples Sar et al., 2004 a,b; Sar et al., 2006). In almost every study, the nitrate was injected into rumen or suddenly given in the diet (Lewis, 1951; Takahashi et al., 1998cited by Leng, 2008).
The latter research examining in vivo metabolism of nitrate has failed in acclimatizing the animals to nitrate. This is appropriate when researching the toxic aspects of sudden ingestion of nitrate, but from a nutritionists’ viewpoint, good husbandry demands that any diet is introduced to ruminants relatively slowly to enable the rumen microbes and the animal to adapt to the changed feeding conditions (Leng, 2008).
A large number of microbial species found in the rumen have the capacity to reduce nitrate or nitrite to ammonia (see Cheng and Phillips 1988). These organisms are quickly transferred between animals and their population densities respond to the presence of nitrate in a diet (Cheng et al., 1985; Alaboudi and Jones 1985 cited by Leng, 2008). As sheep become accustomed to increasing intake of dietary nitrate, the rates of both nitrate and nitrite reduction in rumen fluid increase by 3-10 fold (Allison and Reddy, 1984). Allison and Reddy (1984) showed that the increase is associated with marked increase in populations of nitrate reducing organisms (NRB) and selection of different predominant bacterial groups in the nitrate-adapted animals.
Introducing nitrate for the first time into sheep, increased the rate of nitrate reduction in strained rumen fluid, in just 4 h, by 15 fold from the low level of activity prior to nitrate introduction (Allison and Reddy, 1984). This increase from very low to a substantial level is further increased on a daily basis with time from nitrate’s first inclusion in the diet (Allison and Reddy, 1984: Aloubadi and Jones, 1985).
In 40kg sheep given a diet of lucerne/ground corn, nitrate and nitrite levels in rumen fluid were undetectable but on day 1 of inclusion of nitrate (0.17g of NO3-/kg
body weight) at 1 h post feeding, nitrate and nitrite concentration in rumen fluid were 1.7 and 0.26 m-mol/L, respectively. Within 6 days the rumen microbes had adapted and nitrate and nitrite were so rapidly metabolized that their concentrations in rumen fluid were undetectable 1h post feeding (Allison and Reddy, 1984). Thus the accumulation of both nitrate and nitrite in the rumen depends on how long the animal has been accustomed to nitrate in the feed.
Carver and Pfander (1973) cited in Leng (2008) found that 21 d was needed to enable sheep to acclimate to a diet containing 3.2% KNO3.
Sar et al. (2004) fed sheep half their ration at zero hour and nitrate or water (control) was administered at 30min after the animals were fed. Inhibition of methane production appeared to be delayed by some 30min. Thus there is evidence for nitrate addition to the diet of ruminants inhibiting methane production and more so in the animal adapted to nitrate (Allison et al., 1981; Allison and Reddy, 1984).
Sokolowski et al. (1969) found that adding 3.2% KNO3 to a concentrate based diet,
with or without added sulphur, lowered the overall growth rates of lambs offered the diet over 48 days. Tillman et al. (1965) studied nitrate metabolism in the rumen of 24 kg sheep in a feeding trial in which the lambs were offered purified diets in which nitrate was the sole source of fermentable nitrogen. The diet consisted of corn starch (24%), corn dextrose (24%) and purified cellulose (31.8%), KNO3 (6.5%), NaNO3 (6.5%) with
the remainder as a complete mineral and vitamin mix and supplied approximately 25gN/kg of calculated digestible organic matter. Feed intake was 340g/day and the sheep grew at about 42 g/day.
Hulshof et al. (2009, unpublished) found that nitrate applied in a beef cattle ration based on sugarcane reduces methane production, without visible effect on animal health. However, that experiment showed that there was a numerically lower DMI for animals fed with nitrate, due to the nitrite produced.
The DMI depression demands new approaches; one of which is the use of probiotic. There are microbial feed additives that have been developed to improve animal productivity by directly influencing rumen fermentation. Wallace and Newbold (1993) cited by Lascano and Cárdenas (2010) reviewed data from trials involving dairy cows and growing cattle fed high concentrate diets and calculated that probiotics improved productivity by 7 - 8%.
In this trial was used Megasphaera elsdenii as a probiotic. As reported by Cheng et
21
Interest in probiotics as also a potential technology to reduce CH4 came from
findings that in vitro they can directly reduce CH4 production (Frumholtz et al., 1989).
The addition of Saccharomyces cerevisiae reduced CH4 by 10% in vitro, but was not sustained over a long period (Mutsvangwa et al., 1992). However, in vitro results on CH4 reduction have not been consistent (Martin et al., 1989) and there are no reports in
the literature on in vivo CH4 production after supplementation of probiotics.
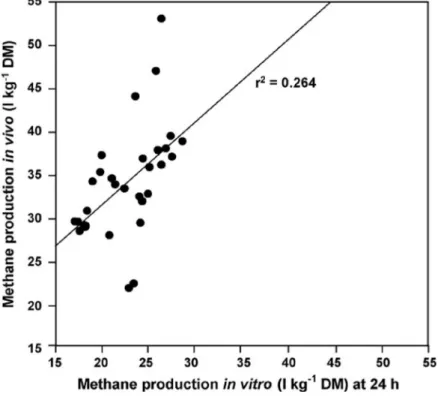
Furthermore, it is extremely difficult to extrapolate from in vitro measurements to
in vivo situations in ruminants, or to field conditions. The relationship between methane produced in vivo and in vitro is very poor (Figure 3) (Flachowsky and Lebzien, 2009).
Figure 3. Relationship between methane produced in vivo and in vitro from a range of diets (Moss and Givens, 1997).
For this reason, more research is needed. Scientists dealing with in vitro techniques should cooperate with those working with animals as much as possible (Flachowsky andLebzien, 2009).
2.5 Conclusions from literature
As cited in Hegarty et al. (2007), the goal in addressing livestock methane emissions, is not simply stopping methane emissions, but rather, redirecting hydrogen into more beneficial pathways. In this way, studying alternatives to reduce enteric methane productions was taking from researchers a special attention. But it seems to be a large discrepancy between authors and their conclusions about the several ways that can be used to reduce methanogenesis.
In recent years, there has been increasing interest in the use of plant extracts to manipulate ruminal fermentation (McAllister and Newbold, 2008), perhaps as a result of the changes introduced within the European Union to forbid the use of growth-promoting antibiotics including monensin and related compounds, in animal feed. Williams et al. (2007) recently reported that IgG antibodies generated against rumen protozoa remained active and continued to bind to target cells for up to 8 h in ruminal flant, suggesting some measure of stability of antibodies in ruminal fluid.
For countries abroad European Union, supplementation of monensin in cattle diets can decrease enteric methane emissions by 27 to 30% for 2 to 4 weeks. But, monensin does not increase the extent or duration of depression in enteric methane emissions after these weeks (Guan et al., 2006).
As cited by Leng (2008), in the majority of research where nitrate has been administered to ruminants, the objectives have been to study the nitrate toxicity syndrome. In order to simulate the field conditions, nitrate has been administered as an intra-ruminal load in animals unaccustomed to consuming nitrate. This “toxicological approach” appears to have masked the high potential of nitrate. Nevertheless, there seems to be a lower dry matter intake in animals fed with nitrate. Understanding the nitrate metabolism in the rumen is the main objective (Leng, 2008).
The variability of the results between authors, demands more research before nitrate can be recommended for use in commercial beef cattle operations.
Chapter 3
Effects of nitrate and additional effect of probiotic on
methane emission and dry matter intake in Nellore bulls.
25 3.1. Introduction
Globally ruminants produce around 80 million tonnes of methane annually, which accounts for about 28% of anthropogenic methane emissions. Enteric methane is produced by reduction of carbon dioxide during fermentative digestion in the rumen.
Hydrogen is readily appropriated by methanogenic bacteria that use it to reduce carbon dioxide to methane which is quickly lost from the rumen fluid to the gas cap and removed by eructation (Leng, 2008).
Diet modifications can help mitigate CH4 emissions from cattle. Dietary
manipulations reduce CH4 emissions by decreasing the fermentation of OM in the
rumen, shifting the site of digestion from the rumen to the intestines, diverting H2
away from CH4 production during ruminal fermentation, or by inhibiting
methanogenesis by ruminal bacteria (Johnson and Johnson, 1995; Benchaar et al., 2001). Nitrate can be the choice for an alternative to CO2 as an electron acceptor because
it is reduced to ammonia, the key compound needed for microbial cell synthesis. There is evidence of methane production inhibition when nitrate is added to the diet of ruminants and more so in the animal adapted to nitrate (Allison et al., 1981; Allison and Reddy, 1984). But, nitrate has been rejected as a potential N source for ruminants because nitrite poisoning has occurred in the animals (Leng, 2008). It was also reported, by Tillman et al. (1965) that, when sheep were fed with nitrate, the dry matter intake decreased and, consequently, the average daily gain diminished. This adverse effect can be reduced by administering a probiotic to the animals. It has been shown that yeast culture influenced microbial metabolism and improved DMI, fiber digestion, and milk production in lactating cattle (Shaver and Garrett, 1995; Doreau and Jouany, 1998 cited by Boadi et al., 2004 ; Dann et al. 2000).
However, there is limited information showing the effects of nitrate in vivo and in beef cattle, under Brazilian conditions, in methane production and dry matter intake. Furthermore, is also important to know effects of the probiotic when applied under such conditions.
3.1.1. Objectives
The objectives of this study was to determine the effect of nitrate on enteric methane emission in high concentrate diet and assessing the response of administering probiotic on methane production and dry matter intake of animals fed a nitrate containing diet.
3.2. Material
This thesis reports an experiment conducted at Instituto de Zootecnia Colina, São Paulo State, Brazil between March 29th and June 21st of 2010.
All animals were cared for in accordance with the guidelines of the Jaboticabal Animal Welfare Commission.
3.2.1. Experimental Design and Animals
Sixteen Nellore bulls and four as backup (age of the animals unknown) averaging 245 ± 13kg were selected from a herd of 200 grazing bulls. The experiment was designed as a randomised block design and monitored to measure the enteric methane release and daily feed intake. Based on methane productions and body weight animals were randomly allocated to the diets.
During the 96 days of experiment, the animals were housed in a tie-stall with a feeding trough and water trough, and received wood shavings as bedding.
The manure was removed daily. No manure or urine samples were taken.
3.2.2. Treatments and Diet
27
The first five days the animals received 2 kg hay per day in order to slowly adapt the animals to sugarcane bagasse and concentrate (Figure 4).
Figure 4. From the top: [1] Sugarcane bagasse; [2] Concentrate for urea diet and [3] Concentrate for nitrate diet (Author photographs).
Animals were fed twice a day at 8.00am and 3.00pm. Fresh water and feed was provided on an ad libitum basis. The animals were fed 112% of the average DMI of the two days before the previous day. The amount of dry matter intake was estimated at 2.3% of the body weight (BW) before the trial began. At the time of feeding, water was added to the diets to obtain a diet DM not exceeding 68%. Total ration was mixed thoroughly by hand.
The experiment was divided in three measuring periods. Between each period the animals were in the pasture therefore the length of individual housing is kept to a maximum of 25 days.
Body weight measurements were taken at the beginning and end of each period. For that procedure, the animals were fasting during 16 hours (without access to water and feed).
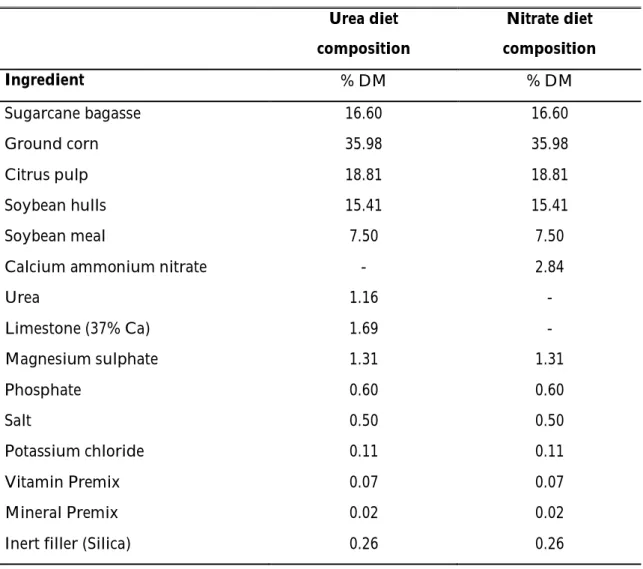
During the first period (day 9-32) the sixteen animals received a neutral diet and methane was measured for six consecutive days (day 27-32). Based on these methane productions, the animals were paired and within the pair randomly allocated to the urea diet (containing 1.16% on DM basis of urea) or nitrate diet (containing 2.84% on DM basis of calcium ammonium nitrate). The diets were iso-nitrogenous and the composition is shown in Table 4.
29 Table 4. Diet composition.
Urea diet composition Nitrate diet composition Ingredient % DM % DM Sugarcane bagasse 16.60 16.60 Ground corn Citrus pulp 35.98 18.81 35.98 18.81 Soybean hulls 15.41 15.41 Soybean meal 7.50 7.50
Calcium ammonium nitrate - 2.84
Urea Limestone (37% Ca) Magnesium sulphate Phosphate Salt Potassium chloride Vitamin Premix Mineral Premix Inert filler (Silica)
1.16 1.69 1.31 0.60 0.50 0.11 0.07 0.02 0.26 - - 1.31 0.60 0.50 0.11 0.07 0.02 0.26
In the second period (day 44-67), to eight animals was given the urea diet and eight the nitrate diet. The animals were adapted to the diets during 18 days followed by six days of methane collection (day 62-67). Every three days the level of nitrate was increased with 25%, as shown in Figure 5.
Figure 5: Schedule of the adaptation period to nitrate diet for the second period and methane collection days.
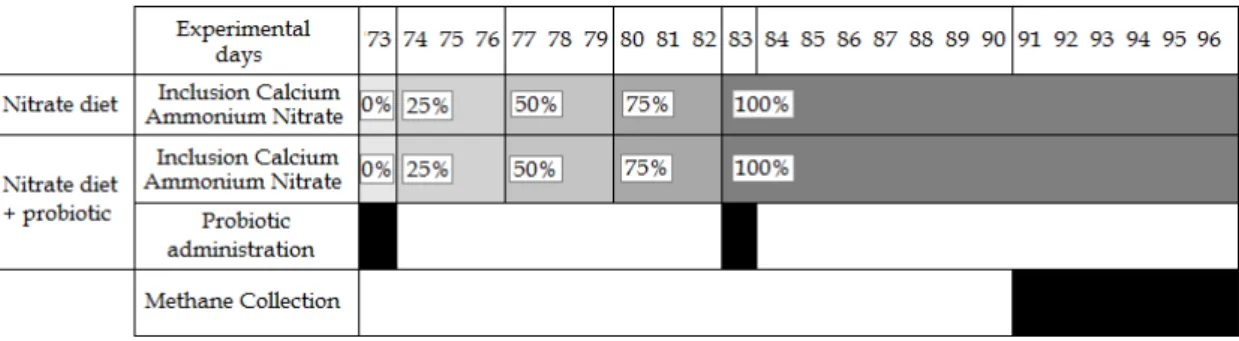
The third period (day 73-96) all sixteen animals received the nitrate diet. On day 73, the day they received the concentrate, eight bulls (done by stratified randomisation i.e. 4 with a nitrate history and 4 with a urea history) was drenched with 200ml probiotic and eight with 200ml water. This was repeated at day 83, when the animals received 100% nitrate diet. On day 72 and 82 the probiotic was incubated, according to the protocol in Appendix 1. Six days of methane collection was measured (day 91-96) (see Figure 6).
Figure 6: Schedule of the adaptation period to nitrate diet for the third period, probiotic administration and methane collection days.
3.3. Methods
3.3.1. Intake
Feed intake and orts were measured and recorded every day to calculate Dry Matter Intake (DMI). During the 6 days of methane collection samples from fresh feed and orts, with a minimum of 100g and a maximum of 500g per sample, were collected and stored in the freezer.
At the end of each methane collection period the samples were pooled and dry matter content of fresh feed and refusals were measured at 60°C for 72 h. These samples were ground (1-mm screen) and analyzed for dry matter (DM), ash, crude protein (CP), neutral detergent fiber (NDF), acid detergent fiber (ADF), lignin, crude
31 3.3.2. Measurements of Methane Emissions
Enteric CH4 gas production was measured using the sulphur hexafluoride (SF6)
tracer gas technique (Johnson et al., 1994), modified by Primavesi et al. (2002), which allows the direct measurement of CH4 production from individual animals in feedlot
conditions.
Brass permeation tubes containing SF6 were calibrated at 39°C for 6 weeks, before
the trial began. The permeation tubes were placed in the rumen using a speculum six days prior to the methane measurements.
This allowed enough time for the tracer gas to equilibrate in the rumen. Animals were trained to wear the collection devices during three days, before each methane collection period started.
The methane measurements were taken in 6 consecutive days in all three periods, respectively from 27-32 (1st period), 62-67 (2nd period) and 90-95 (3rd period). The
collection devices were changed every 24h before the morning feeding.
At the end of each period the devices containing the samples were sent to EMBRAPA Meio ambiente Jaguariuna – Laboratório de Ecologia Química to analyse.
Background concentrations of these gases were also measured in two ambient air samples collected every day in the shed during the same six days breath sampling period. Daily CH4 production from each animal was calculated according to Johnson et al. (1994), using the known permeation rate of SF6 and the concentrations (above the
background) of SF6 and CH4 in the breath samples (Martin et al., 2008).
3.4. Statistical analysis
Data on g CH4/bull/hour, g CH4/bull/day, g CH4/kg DMI, % CH4/GEI, kg
CH4/bull/year and dry matter intake were used to statistical analysis. All data from
the experiment were analyzed using the PROC MIXED procedure of SAS (by Littel, 1998; Wang and Goonewardence, 2004). The following model was applied:
Where Y = dependent variable for animal k (k = 1, 2, …, 16); µ = average intercept; TREATM = effect of treatment i (i = 1, 2); TIME = the effect of time period j (j = 1, 2, 3, 4, 5, 6) INITIALBW = the effect of initial body weight of animal k; εij = error
term, which represents all other effects.
Period and treatment were included as fixed effects and animal was included as random effect.
Because the SE of the LS Means was not the same for all the observations, it was necessary to calculate a pooled SE. The formula was based on the standard errors from the LS Means (Ott and Longnecker, 2008).
The model residuals were tested for a normal distribution using Shapiro-Wilk W test. Overall differences between treatment LS means were considered to be significant when P <0.05 and trends were discussed at P < 0.10.
3.5. Results
This study is one of the first reports of enteric CH4 emissions from feedlot cattle
under Brazilian conditions management.
The statistical analysis was run to DM intake and CH4 emissions output reported
as grams per day, grams per kilogram of DM intake and a percentage of GE intake for period 2 and 3.
According to Lassey (2005), gaining insight into factors that influence methane production requires that the methane emitted was to be expressed per unit of intake (g of methane/kg of DM intake).
Period 1
33
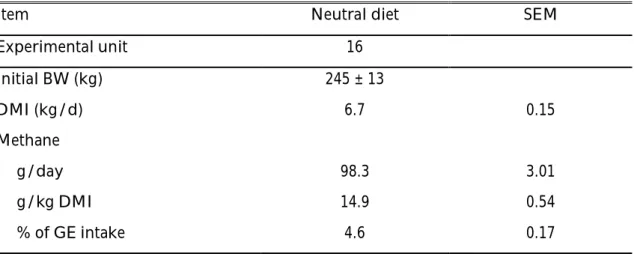
Table 5. Initial body weight, LS means of methane emissions and dry matter intake from bulls fed a neutral diet1 during the first period.
Item Neutral diet SEM
Experimental unit 16 Initial BW (kg) 245 ± 13 DMI (kg/d) 6.7 0.15 Methane g/day 98.3 3.01 g/kg DMI 14.9 0.54 % of GE intake 4.6 0.17
1 Methane emissions and corresponding DMI determined for 5 d.
Period 2
In this second period the methane emissions differed amongst diets. Initial body weights, feed intake and methane emissions are presented in Table 6.
There was no significant difference on total DMI between urea and nitrate diets, but there was a tendency for higher intake in bulls assessed to nitrate diet (P=0.09). The average DMI during the six days of methane collection was 7.4 and 9.2 kg for urea diet and nitrate diet, respectively.
Daily methane production (g/day) was 41.6% lower from bulls on nitrate diet than from bulls on urea diet (Figure 7). There was a daily methane production of 130.9 and 91.5 g CH4/day for urea diet and nitrate diet, respectively, showing an significant
difference between treatments (P<0.001).
Regarding the grams of methane per kg of DMI, there was a highly significant difference between treatments (P<0.001), showing productions for urea diet of 18g CH4/kg DMI and 10.1 g CH4/kg DMI for nitrate diet. These values represent a
difference of 41.1% of the methane produced by bulls fed a nitrate diet compared with bulls fed urea diet (Figure 7). The methane production per kg of DMI was different among time (P<0.01). Figure 8 shows average CH4 g/kg of DMI produced by each treatment during the collection period. These values were obtained using the average methane production per bull, per day, per treatment.
With an assumption of gross energy content of this diet of 17.6 MJ per kg dry matter, methane production expressed in % GEI was 5.6% for the urea diet and 3.1% for the nitrate diet, resulting in a production of 58.9% of GEI in the nitrate diet compared to the urea diet (Figure 7). There was a highly significant difference between nitrate diet and urea diet (P<0.001) (Table 6). During the six days of methane collection the same animal lost different amounts of GEI as methane (P<0.05) and the initial body weight showed a tendency to influence the GEI lost as methane (P<0.10).
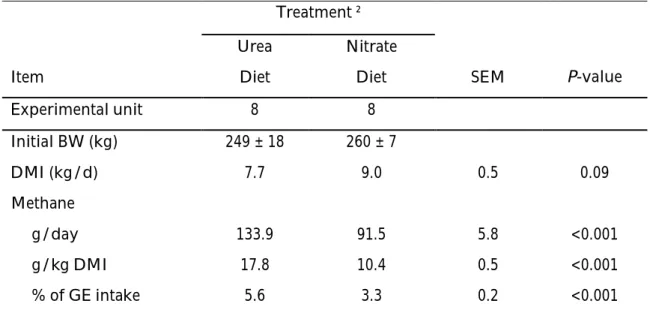
Table 6. Initial body weights and LS means of dry matter intake and methane emissions from bulls fed a diet with urea or calcium nitrate1 during the second period.
Treatment ²
Urea Nitrate
Item Diet Diet SEM P-value
Experimental unit 8 8 Initial BW (kg) 249 ± 18 260 ± 7 DMI (kg/d) 7.7 9.0 0.5 0.09 Methane g/day 133.9 91.5 5.8 <0.001 g/kg DMI 17.8 10.4 0.5 <0.001 % of GE intake 5.6 3.3 0.2 <0.001
1 Methane emissions and corresponding DMI determined for 6 d.
2 Treatments were urea diet (1.16% of urea in DM diet) and calcium ammonium nitrate diet (2.84% of DM
35
Figure 7. Comparison of dry matter intake and methane productions expressed in percentage between urea diet and nitrate diet.
Figure 8. Average methane production per kg DMI per collection day for the two treatments.
Period 3
The results are presented in Table 7. During the 6-d of methane collection period, the nitrate diet and nitrate diet plus probiotic diet consumed on average 8.7 and 7.6 kg of DM, respectively. During this period, even without significant differences (P>0.10), the bulls fed nitrate diet consumed 12.6% more DM, than the bulls fed nitrate plus probiotic diet.
Daily methane emissions were significantly reduced per day, 90.1 and 73 g CH4/day, in nitrate diet and nitrate plus probiotic diet, respectively (P<0.05).
Regarding the grams of methane produced per kg of DMI, 10.7g vs. 10.2g, there wasn’t a significant difference between treatments (P>0.10).
The energy of the TMR was estimated 17.6MJ per kg DM, thus daily methane loses represents 3.3% of energy intake for the nitrate diet and 3.2% using nitrate plus probiotic diet. As we can see in Table 7, there was no significant differences between treatments (P>0.10).
Table 7. Initial body weights, dry matter intake and methane emissions from bulls fed a diet with nitrate or nitrate plus probioticduring the third period.
Treatment ¹
Nitrate Nitrate diet
Item diet plus probiotic SEM P-value
No. of observations 47 47 Initial BW (kg) 276 ± 15 279 ± 19 DMI 8.7 7.6 0.51 0.131 Methane g/day 90.1 73 4.01 0.010 g/kg DMI 10.7 10.2 0.69 0.601
37 3.6. Discussion
Period 1
The neutral diet used in this study was typical of diets fed in Brazil to beef cattle in feedlots (Millen et al., 2009).
When methane:DMI ratio expressed in dimensionless form with both methane and DMI as energies of combustion, this ratio is the proportion or percentage of GEI that is expelled as methane (Johnson et al., 2000). For this period, bulls fed with neutral diet, about 4.6% of the ingested energy was lost as CH4.
The IPCC (2007) guidelines recommend 6.5±1.0% for all cattle and buffalo except where diets exceed 90% concentrates (3.0±1.0%) and for all sheep except juveniles (4.5±1.0%) (Lassey, 2008). The gross energy content of this diet was 17.6 MJ per kg dry matter, and methane enthalpy is 55.65MJ/kg. Consequently a methane yield of 4.6% converts to 14.9 g CH4 per kg DMI. The concentrate in this diet was 84%, so the value
obtained for GEI lost as CH4 (4.6%) is a good balance between what is reported by
Johnson and Johnson (1995) and the guidelines of IPPC (2007) from feedlot cattle. This can be also linked with the g of methane/day and g of methane produced/ kg DMI. It was observed that the values of methane produced during this period, weren’t influence by DMI (P>0.05). Others reasons can be appointed for these values. The carbohydrate level, the relation forage and concentrate (in this case was 16% sugarcane bagasse: 84% concentrate) and also forage processing (Johnson and Johnson, 2008).
It was reported that bagasse is not highly fermented in the rumen. Sugarcane bagasse showed a degradability of 20% only after 24hours using in-sacco degradability in 3 fistulated Nellore (Hulshof et al., 2009, unpublished).
In addition there was a high variability between measurements in the same animal (P<0.01), as aforesaid, without influence of DMI.
This technique of SF6, described in detail elsewhere (Johnson et al., 1994, Lassey et al., 1997; Lassey, 2007; Pinares-Patiño and Clark, 2008) also introduces its own complications: concerns have arisen about the performance of SF6 permeation tubes as
released SF6 ideally traces enteric methane (Vlaming et al., 2007; Pinares-Patiño and
Clark 2008).
Pinares-Patiño and Clark (2008) reported that the effect of SF6 permeation rate
(PR) on methane emission is limited when the range is limited (1.9 – 3.6 mg SF6/day)
and when the rates are balanced between treatments. Vlaming et al., (2007) tested the effect of two levels (low and high) of SF6 PR on the methane emission assessed,
respectively 2.88 vs. 7.34 mg SF6/day. Animals inserted with the high PR tubes had a
higher methane emission compared to the low level, respectively 21.8 vs. 18.3 g CH4/kg DMI. In this trial, to minimize the effect of SF6 technique, the PR was 2.16 ±
0.04 mg SF6/day and all the halters had equal absorption rates (45-55% after 24 hours).
Period 2
Feeding bulls with 2.82% calcium ammonium nitrate as DM in the diet, which correspond to a 2.15% of pure nitrate in this diet, reduced the enteric methane emissions.
This reduction in methanogenesis was expected, based on various studies made by Sar et al. (2004a), Allison et al. (1981), Allison and Reddy (1984). In those studies a clear delay of about 30min on methane production in the rumen was observed when sheep were fed half their ration at zero hour and nitrate or water (control) was administered 30min after the animals were fed.
The constant concern about the toxicity of the nitrite (see O’Hara and Fraser, 1975; Bradley et al., 1940; Crawford et al., 1966; Wnght and Davison, 1964; Deeb and Sloan, 1975; Ruhr and Osweiler, 1986; Setchell and Williams 1968) was not observed in this experiment. The most likely clinical signs of nitrate poisoning are painful breathing, cyanotic membranes, rapid breathing, muscle tremors, weakness, incoordination, diarrhea and frequent urination (Gadberry and Jennings, no date). As mentioned in Chapter 3, in Materials, the bulls had period of 21 days to slowly adapt the rumen to the new diet, and, obviously to the nitrate that is quickly fermentable in
39
included as a component of the diet. In this way nitrite accumulation in the rumen is insignificant and transitory (Alaboudi and Jones, 1985; Allison and Ready, 1984; Cheng
et al., 1985).
Although, high values of nitrite in the rumen can be also an explanation for the low DMI (Leng, 2008). Tillman et al. (1965) study nitrate metabolism sheep in a feeding trial in which the lambs were offered purified diets. Feed intake was 340g/day and the sheep grew at about 42 g/day. It was also studied that methemoglobinemia (Crawford
et al., 1966) reduces feed intake. However in this second period the decrease DMI on nitrate diet or, at least, a similar DMI for both diets was not observed. It showed a tendency for lower intakes on urea diet (P<0.10). One of the reasons behind this response may be due to the palatability of urea. Horn et al. (1966) clearly shows that concentrate intake can be greatly reduced by inclusion of urea in the concentrate. Feeding urea in the silage eliminates palatability problems such as those found when high urea intake is provided only in the concentrate mixture (Horn et al., 1966).
Regarding the percentage of GEI lost as methane, for the urea diet a value of 5.6% was observed. This value is in agreement with Johnson and Johnson (1995) report. For nitrate diet it was observed 3.3% of methane lost as GEI.
This value is in accordance with the recommendations established by IPPC (2007), which refer that for beef cattle the figure must be reduced to 3 ± 1%.
Period 3
Regarding this period, the expected effect of the probiotic was not observed (P=0.131). There were no significant differences between treatments on DMI. As aforesaid, the probiotic was introduced to increase DMI indirectly, by increasing the reduction nitrite.
Methane losses expressed in g/kg of DMI and % of GEI were not different between treatments and it was also achieved the target required for IPPC (2007). It can be accepted that nitrate reduces enteric methane emissions.
Although, daily methane emission has high values for nitrate diet, compared to nitrate diet plus probiotic (P<0.05). Facing these values, the low DMI observed in nitrate diet plus probiotic can be the explanation for the lower daily methane production.


![Figure 4. From the top: [1] Sugarcane bagasse; [2] Concentrate for urea diet and [3]](https://thumb-eu.123doks.com/thumbv2/123dok_br/15844273.1084732/47.892.309.584.203.688/figure-sugarcane-bagasse-concentrate-urea-diet.webp)