http://periodicos.uem.br/ojs/acta ISSN on-line: 1807-8672
Doi: 10.4025/actascianimsci.v41i1.42559
RUMINANT NUTRITION
Development and evaluation of prediction equations for
methane emission from Nellore cattle
Tatiana Lucila Pires Sobrinho1, Renata Helena Branco2, Elaine Magnani2, Alexandre Berndt3, Roberta Carrilho Canesin2 and Maria Eugênia Zerlotti Mercadante2*
1Departamento de Zootecnia, Faculdade de Ciências Agrárias e Veterinárias, Universidade Estadual Paulista, Jaboticabal, São Paulo, Brazil. 2Instituto de
Zootecnia, Centro Avançado de Pesquisa de Bovinos de Corte, Rod. Carlos Tonani, Km 94. Cx. Postal 63, 14174-000, Sertãozinho, São Paulo, Brazil.
3Empresa Brasileira de Pesquisa Agropecuária, Embrapa Pecuária Sudeste, São Carlos, São Paulo, Brasil. *Author for correspondence. E-mail:
[email protected]; [email protected]
ABSTRACT.
Dry matter intake (DMI), nutrient intake and enteric CH4 emission were evaluated in 48 Nellore cattle (392 ± 27
days of age). Equations were generated from intake data and evaluated using root mean square prediction error (RMSPE), and validated by cross-validation. Equations that included DMI and hemicellulose intake (HEMI) [ ; DMI and total
carbohydrate intake (TCHI) ;
metabolizable energy intake (MEI) and cellulose intake (CELI)
, and non-fiber
carbohydrate intake (NFCI) resulted in the lowest
RMSPE (14.3, 14.1, 14.3 and 14.7%, respectively). When literature equations were evaluated using our database, the most accurate predictions were obtained with equations that included DMI and lignin intake (RMSPE = 15.27%) and MEI, acid detergent fiber intake and lignin intake (RMSPE = 15.7%). The mean error
of predicting enteric CH4 emission with the equations developed in this study based on DMI and nutrient
intake is 17% and the most accurate predictions are obtained with equations including DMI, carbohydrate intake and MEI.
Keywords: beef cattle; dry matter intake; greenhouse gas; prediction; sulfur hexafluoride.
Received on April 23, 2018. Accepted on July 9, 2018.
Introduction
Livestock farming is an important source of greenhouse gases worldwide, generating carbon dioxide (CO2),
methane (CH4) and nitrous oxide (N2O) throughout the production process, which contribute significantly to
global warming (Monteiro et al., 2018). Global greenhouse gas emissions from livestock have increased by 51% from 1960 to 2001, mainly because of the increasing emissions from herds in developing countries (+ 117%). In this respect, cattle are responsible for 74% of global emissions in this sector (Caro, Davis, Bastianoni, & Caldeira, 2014). Methane emissions from enteric fermentation account for 25.9% of all CH4 emissions resulting from
anthropogenic activities (United States Environmental Protection Agency [USEPA], 2015). Eructed methane is responsible for 2 to 12% of ingested gross energy loss depending on the level of feeding, diet composition and other factors (Johnson & Johnson, 1995), as different breeds (Grobler, Scholtz, van Rooyan, Mpayipheli, & Neser, 2014).
Greenhouse gas emission inventories generally use mathematical models to predict enteric methane emission from cattle. These models can be applied directly, relating nutrient intake to methane emission, or by estimating emissions from mathematical descriptions of the biochemistry of rumen fermentation (Kebreab, Clark, Wagner-Riddle, & France, 2006). Methane prediction equations are available in the literature and have been developed, among others, for simultaneous analysis in cattle and sheep (Blaxter & Clapperton, 1965), dairy cows (Mills et al., 2003), beef cattle (Ellis et al., 2009), and beef and dairy cattle in separate and combined analysis (Ellis et al., 2007; Patra, 2017). These studies were developed by meta-analysis, including published results of enteric methane emission of animals from different breeds, categories, and fed different diets.
The use of different diet-related variables in prediction equations affects the accuracy of CH4 prediction (Ellis et
field and are closely correlated with enteric CH4 emission to model and predict CH4 production in ruminants.
The objective of the present study was to develop prediction equations for enteric methane emission from Nellore cattle raised in a tropical climate, and to evaluate the accuracy of equations described in the literature under the conditions studied.
Material and methods
The experiment was approved by Animal Ethics Committee, in accordance with Guidelines of Animal Welfare and Humane Slaughter (São Paulo State law number 11.977). The experiment was conducted in Sertãozinho, Brazil (21º10’ South latitude and 48º5’ West longitude); a region characterized by humid tropical climate with an average annual temperature of 24ºC and average annual rainfall of 1,312 mm.
Dry matter intake (DMI) and enteric methane emission were evaluated for 5 consecutive days in 24 male and 24 female Nellore animals (332 ± 35 kg initial body weight and 392 ± 27 days of age) housed in individual pens (12 m2). Daily intake was calculated as the difference between the feed provided and leftovers. Although intake was
only calculated during the measurement of methane emission (5 days), the simple correlation between the latter and DMI obtained in an 84-day feed efficiency test (Mercadante et al., 2015) was high (0.842; p < 0.01).
The diet fed to the animals consisted of Brachiaria brizantha cv. Marandu hay(445 g kg-1 of dry matter,
DM), ground corn (322 g kg-1 of DM), cottonseed meal (214 g kg-1 of DM), urea (4.5 g kg-1 of DM), ammonium
sulfate (0.5 g kg-1 of DM) and mineral supplement (19.5 g kg-1 of DM), with a roughage:concentrate ratio of
45:55. The diet was provided twice a day (8 am and 4 pm) and was adjusted individually to permit leftovers of 5 to 10%, ensuring ad libitum intake. Individual leftover samples were collected over the 5 days of methane emission measurement and the ingredients of the diet were sampled on the first day and stored for subsequent chemical analysis (Table 1).
The diet and leftover samples were dried for 72h at 55°C and ground in a knife mill with a 1-mm sieve. Association Official Analytical Chemists (AOAC, 1990) methods were used for the determination of DM (Method 934.01), ash (Method 942.05), and ether extract (Method 920.39) content. Crude protein content was determined from the nitrogen value obtained by the Dumas combustion method in a Leco® FP-528
nitrogen analyzer (St. Joseph, MI, USA) and multiplied by 6.25 (Etheridge, Pesti, & Foster, 1998). Gross energy was obtained by combustion of the samples in an adiabatic calorimeter (model 6300, Parr Instrument Company, Moline, IL, USA). Neutral detergent fiber was obtained using α-amylase without the addition of sodium sulfite, according to Van Soest, Robertson, and Lewis (1991) and adapted for the Ankom 200 Fiber Analyzer (Ankom Technology, Fairport, NY, USA), and was subsequently corrected for ash and protein. Acid detergent fiber was determined using the method of Goering and Van Soest (1970), adapted for the Ankom 200 Fiber Analyzer (Ankom Technology). Lignin was determined by solubilization of cellulose in sulfuric acid according to Van Soest et al. (1991). Total digestible nutrients (
), digestible energy [ and metabolizable energy (ME were calculated according to the National Research Council (NRC, 2001), in which: DCP = digestible crude protein, DFA = digestible fatty acids, DNDF = digestible neutral detergent fiber, DNDFP = digestible neutral detergent fiber free of digestible proteins, and DNFC = digestible
nonfiber carbohydrates. Non-fiber carbohydrates were determined as percentage using the following equation: 100 – (% crude protein + % ether extract + % mineral matter +% neutral detergent fiber corrected for ash and protein) according to Sniffen, O'Connor, Van Soest, Fox, and Russell (1992). Total carbohydrates were calculated as percentage: 100 – (% crude protein + % ether extract + % mineral matter).
Measurement of enteric methane
The sulfur hexafluoride (SF6) tracer gas technique described by Johnson and Johnson (1995) was used for
the quantification of daily enteric methane emission. For this purpose, an SF6 source (permeation tube) with a known constant release rate was inserted through the mouth into the animal’s rumen. For determination of the SF6 release rate, the tubes were kept in a beaker immersed in a water bath at 39ºC for 6 weeks prior to
24h. The animals were allowed to adapt to the sampling devices (canisters and halters) for 15 days. Methane was collected during 5 consecutive days at intervals of 24h. For correction of atmospheric methane concentrations inside the facility, gas samples were collected daily from ambient air with two collection canisters (blank), hanging at the entrance and exit of the barn.
Methane was determined in an HP6890 gas chromatograph (Hewlett Packard, Model HP 6890, Ramsey, MN, USA) equipped with a flame ionization detector (FID) and Plot HP-Al/M megabore column (0.53 μm, 30 m) for CH4, and with an electron capture detector (μ-ECD) and HP-MolSiv megabore column for SF6, using
two 0.5-cm3 loops coupled to two 6-way valves, as the method described by Johnson, Huyler, Westberg, Lamb, and Zimmerman (1994). The canisters were pressurized with nitrogen 5.0 (White Martins, Praxair Inc) until reaching a pressure of approximately 1.2 atm. Pressure readings were obtained with a digital pressure meter. The calibration curves were constructed, using gas standards certified by White Martins (Praxair Inc), as described by Westberg, Johnson, Cossalman, and Michal (1998). The methane emitted by the animal was calculated from the release rate of SF6, correlating the results with the known release rate of
the tracer in the rumen and subtracting basal methane concentrations (Westberg et al., 1998):
in which: QCH4 = rate of methane emission by the animal; QSF6 = known release rate of SF6; [CH4]Y= methane
concentration in the canister; [CH4]B= methane concentration in the blank, and [SF6] = SF6 concentration in
the canister. Methane expressed as gram was converted to unit of energy using the conversion factor proposed by Holter and Young (1992).
Evaluation of the equations developed
A completely randomized design was used. Simple correlations between the intake variables and CH4 emission (MJ d-1) were calculated as an indicator of the relationship between CH4 emission and
the intake variables used to develop the prediction equations. Regression equations were developed with the PROC MIXED procedure (Statistical Analisys System, [SAS], 2013), starting with the inclusion of one variable each and progressing to a combination of two or more variables according to literature data, which showed that, for example, DMI and metabolizable energy intake are good predictors of methane emission (Axelsson, 1949; Johnson & Johnson, 1995; Mills et al., 2003). The sex of the animals was included in the model as a random effect.
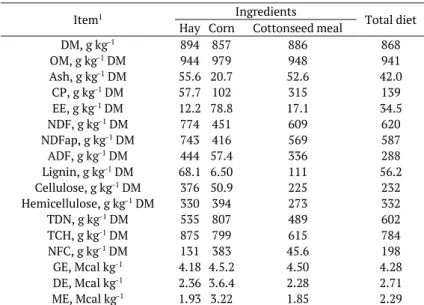
Table 1. Chemical composition of the diet.
Item1 Ingredients Total diet
Hay Corn Cottonseed meal
DM, g kg-1 894 857 886 868
OM, g kg-1 DM 944 979 948 941 Ash, g kg-1 DM 55.6 20.7 52.6 42.0 CP, g kg-1 DM 57.7 102 315 139 EE, g kg-1 DM 12.2 78.8 17.1 34.5 NDF, g kg-1 DM 774 451 609 620 NDFap, g kg-1 DM 743 416 569 587 ADF, g kg-1 DM 444 57.4 336 288 Lignin, g kg-1 DM 68.1 6.50 111 56.2 Cellulose, g kg-1 DM 376 50.9 225 232 Hemicellulose, g kg-1 DM 330 394 273 332 TDN, g kg-1 DM 535 807 489 602 TCH, g kg-1 DM 875 799 615 784 NFC, g kg-1 DM 131 383 45.6 198 GE, Mcal kg-1 4.18 4.5.2 4.50 4.28 DE, Mcal kg-1 2.36 3.6.4 2.28 2.71 ME, Mcal kg-1 1.93 3.22 1.85 2.29
1DM: dry matter; OM: organic matter, CP: crude protein; EE: ether extract; NDF: neutral detergent fiber; NDFap: neutral detergent fiber devoid of ash and
protein; ADF: acid detergent fiber; TDN: total digestible nutrients; TCH: total carbohydrates; NFC: non-fiber carbohydrates; GE: gross energy; DE: digestible energy; ME: metabolizable energy.
observation is left out of the training data and is then used for the test. The method is repeated until all observations are removed and consequently used as test for each of the equations evaluated. Thus, the sum of the mean square prediction error was calculated for each equation as:
,
in which: Oi = value of CH4 emission of the observation left out of the training data, in MJ d-1, Pi =
value of methane emission predicted with the equation tested (without observation Oi), in MJ d-1.
The prediction error obtained by the square root of MSE (RMSPE) is expressed as a proportion of the observed mean. The best equations were chosen based on the lowest RMSPE values. The equations were also evaluated by residual regression (observed CH4 emission minus expected CH4
emission) on the prediction centered around its respective means (St-Pierre, 2003). The intercept of the equation was used to estimate mean bias, while linear bias was evaluated by the slope of the regression line.
Evaluation of equations described in the literature
Using the methane emission data obtained with the SF6 tracer gas technique and the nutrient
intake data, equations described in the literature were selected according to the availability of the predictor variables (Table 2). Correlations were estimated between observed methane emission and methane emission predicted with each of the equations tested (PROC CORR) (SAS, 2013). Equations exhibiting the lowest RMSPE, absence of bias (mean and linear) and highest correlation between observed and expected methane emission were considered to best fit the data evaluated.
Results
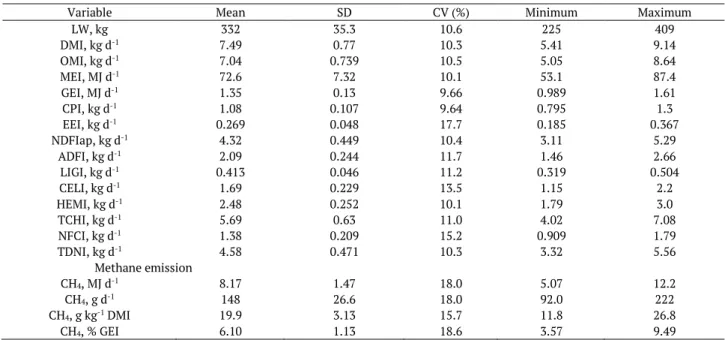
Table 3 shows the descriptive statistics of the variables analyzed. Dry matter intake (DMI) was 2.3% of live weight (LW), similar to the 2.5% reported by Corvino et al. (2011) and Hulshof et al. (2012) for Nellore steers and Nellore x Guzerat crossbreeds, respectively. Average methane emission was 8.17 MJ d-1, corresponding to approximately 20 g CH
4 kg DM-1 consumed, and 6.1% GEI.
Development of prediction equations for methane emission
Except for lignin intake, all intake variables analyzed were positively correlated with methane emission (Table 4).
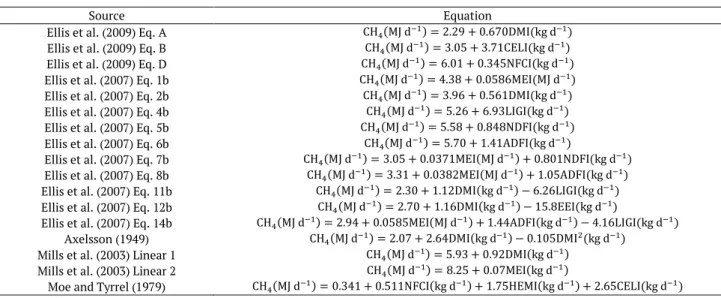
Table 2. Published equations used for the prediction of enteric methane emission from cattle.
Source Equation
Ellis et al. (2009) Eq. A Ellis et al. (2009) Eq. B Ellis et al. (2009) Eq. D Ellis et al. (2007) Eq. 1b Ellis et al. (2007) Eq. 2b Ellis et al. (2007) Eq. 4b Ellis et al. (2007) Eq. 5b
Ellis et al. (2007) Eq. 6b
Ellis et al. (2007) Eq. 7b Ellis et al. (2007) Eq. 8b Ellis et al. (2007) Eq. 11b Ellis et al. (2007) Eq. 12b
Ellis et al. (2007) Eq. 14b Axelsson (1949)
Mills et al. (2003) Linear 1 Mills et al. (2003) Linear 2
Moe and Tyrrel (1979)
detergent fiber intake; ADFI: acid detergent fiber intake; EEI: ether extract intake; HEMI: hemicellulose intake.
Table 3. Descriptive statistics of body weight, nutrient intake and methane emission (n=48).
Variable Mean SD CV (%) Minimum Maximum
LW, kg 332 35.3 10.6 225 409
DMI, kg d-1 7.49 0.77 10.3 5.41 9.14
OMI, kg d-1 7.04 0.739 10.5 5.05 8.64
MEI, MJ d-1 72.6 7.32 10.1 53.1 87.4
GEI, MJ d-1 1.35 0.13 9.66 0.989 1.61
CPI, kg d-1 1.08 0.107 9.64 0.795 1.3
EEI, kg d-1 0.269 0.048 17.7 0.185 0.367
NDFIap, kg d-1 4.32 0.449 10.4 3.11 5.29
ADFI, kg d-1 2.09 0.244 11.7 1.46 2.66
LIGI, kg d-1 0.413 0.046 11.2 0.319 0.504
CELI, kg d-1 1.69 0.229 13.5 1.15 2.2
HEMI, kg d-1 2.48 0.252 10.1 1.79 3.0
TCHI, kg d-1 5.69 0.63 11.0 4.02 7.08
NFCI, kg d-1 1.38 0.209 15.2 0.909 1.79
TDNI, kg d-1 4.58 0.471 10.3 3.32 5.56
Methane emission
CH4, MJ d-1 8.17 1.47 18.0 5.07 12.2
CH4, g d-1 148 26.6 18.0 92.0 222
CH4, g kg-1 DMI 19.9 3.13 15.7 11.8 26.8
CH4, % GEI 6.10 1.13 18.6 3.57 9.49
LW: live weight; DMI: dry matter intake; OMI: organic matter intake; MEI: metabolizable energy intake; GEI: gross energy intake; CPI: crude protein intake; EEI: ether extract intake; NDFIap: neutral detergent fiber intake devoid of ashes and protein; ADFI: acid detergent fiber intake; LIGI: lignin intake;
CELI: cellulose intake; HEMI: hemicellulose intake; TCHI: total carbohydrate intake; NFCI: non-fiber carbohydrate intake, TDNI: total digestible nutrient intake.
Table 4. Pearson correlation between CH4 emission (MJ d-1) and intake variables.
Variable CH4 (MJ d-1) P-value
DMI, kg d-1 0.40 0.005
OMI, kg DM d-1 0.43 0.002
MEI, MJ d-1 0.37 0.010
DEI, MJ d-1 0.37 0.010
CPI, kg DM d-1 0.40 0.005
EEI, kg DM d-1 -0.40 0.005
NDFIap, kg DM d-1 0.36 0.011
ADFI, kg DM d-1 0.50 0.0003
LIGI, kg DM d-1 -0.009 0.952
CELI, kg DM d-1 0.58 <0.0001
HEMI, kg DM d-1 0.35 0.015
TCHI, kg DM d-1 0.47 0.0007
NFCI, kg DM d-1 0.63 <0.0001
TDNI, kg DM d-1 0.41 0.004
DMI: dry matter intake; OMI: organic matter intake; MEI: metabolizable energy intake; DEI: digestible energy intake; CPI: crude protein intake; EEI: ether extract intake; NDFIap: neutral detergent fiber intake devoid of ashes and protein; ADFI: acid detergent fiber intake; LIGI: lignin intake; CELI: cellulose
intake; HEMI: hemicellulose intake; TCHI: total carbohydrate intake; NFCI: non-fiber carbohydrate intake, TDNI: total digestible nutrient intake.
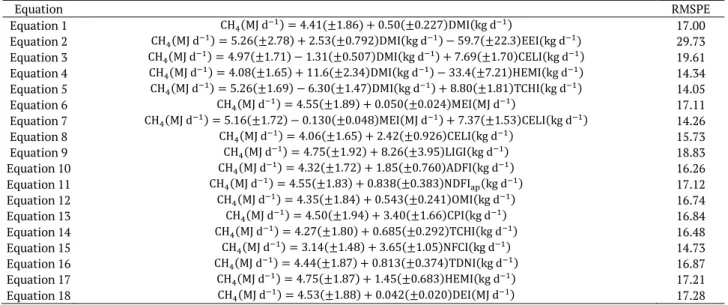
The correlation between methane emission and DMI was similar to the estimate of 0.43 reported by Fitzsimons, Kenny, Deighton, Fahey, and McGee (2013). The equations including DMI and hemicellulose intake (Table 5, Equation 4) or DMI and total carbohydrate intake (Table 5, Equation 5) resulted in the lowest RMSPE values, thus providing the best fit to the dataset analyzed. The same was observed when metabolizable energy intake and cellulose intake were included (Table 5, Equation 7). The equations that included metabolizable energy intake and other variables were not significant in predicting methane emission (data not shown).
When lignin intake was included in the prediction equations, only Equation 9 (Table 5) was significant, with lignin intake being the only variable in the model. The equation developed from acid detergent fiber intake resulted in a low RMSPE value (Table 5, Equation 10).
was observed between ether extract intake and methane emission (Table 4), and the inclusion of ether extract intake in the prediction equations (Table 5, Equation 2) had a negative effect on methane emission.
Evaluation of equations described in the literature
The equations described by Ellis et al. (2007) that exhibited the highest accuracy in predicting methane emission, and thus the lowest RMSPE (Table 6), were Eq. 2b, 4b, 8b, 11b and 14b (Table 2). On the other hand, the equation described by Axelsson (1949), Linear 1 and Linear 2 of Mills et al. (2003) and Moe and Tyrrell (1979) resulted in high RMSPE values and overestimated methane emission from the animals of the present study.
Discussion
The average loss of energy in the form of methane, defined by the percentage of enteric methane produced as a function of gross energy intake, was 6.1%, a value lower than the 6.5 to 7.5% predicted by the IPCC (2006) for cattle raised under tropical conditions. According to Benchaar, Pomar, and Chiquette (2001), methane emission expressed as Mcal d-1 increases when the percentage of concentrate in the diet
increases from 0 to 20% and decreases when the animals are fed high-concentrate diets.
Table 5. Linear equations developed for the prediction of enteric methane based on intake variables.
Equation RMSPE
Equation 1 17.00
Equation 2 29.73 Equation 3 19.61 Equation 4 14.34 Equation 5 14.05 Equation 6 17.11 Equation 7 14.26 Equation 8 15.73 Equation 9 18.83 Equation 10 16.26 Equation 11 17.12
Equation 12 16.74 Equation 13 16.84 Equation 14 16.48 Equation 15 14.73 Equation 16 16.87 Equation 17 17.21 Equation 18 17.28 DMI: dry matter intake; EEI: ether extract intake; CELI: cellulose intake; HEMI: hemicellulose intake; TCHI: total carbohydrate intake; NFCI: non-fiber
carbohydrate intake; MEI: metabolizable energy intake; LIGI: lignin intake; ADFI: acid detergent fiber intake; NDFIap: neutral detergent fiber intake devoid of ashes and protein; OMI: organic matter intake; CPI: crude protein intake; TDNI: total digestible nutrient intake; DEI: digestible energy intake;
RMSPE: root mean square prediction error, expressed as a proportion of the observed mean.
Table 6. Evaluation of equations described in the literature.
Equation Mean bias
1 Linear bias2 RMSPE3 PC4
Exp (MJd-1) P Exp (MJ d-1) P (% Obs)
Ellis et al. (2009) Eq. A 0.861 <0.0001 0.136 0.724 19.42 0.399** Ellis et al. (2009) Eq. B -1.163 <0.0001 -0.003 0.990 20.31 0.579*** Ellis et al, (2009) Eq. D 1.631 <0.0001 11.596 <0.0001 26.85 0.630*** Ellis et al. (2007) Eq. 1b -0.467 0.023 0.250 0.600 17.54 0.366* Ellis et al. (2007) Eq. 2b 0.0086 0.965 0.353 0.446 16.39 0.399** Ellis et al. (2007) Eq. 4b 0.0361 0.866 -1.043 0.127 18.23 -0.009ns Ellis et al. (2007) Eq. 5b -1.072 <0.0001 0.400 0.455 21.21 0.363* Ellis et al. (2007) Eq. 6b -0.471 0.015 1.114 0.047 17.11 0.496** Ellis et al. (2007) Eq. 7b -1.034 <0.0001 -0.149 0.645 20.86 0.365* Ellis et al. (2007) Eq. 8b -0.106 0.585 0.201 0.587 16.11 0.433** Ellis et al. (2007) Eq. 11b 0.071 0.701 0.125 0.652 15.27 0.516** Ellis et al. (2007) Eq. 12b 1.033 <0.0001 -0.019 0.910 18.36 0.662*** Ellis et al. (2007) Eq. 14b -0.304 0.105 0.161 0.576 15.74 0.513**
Axelsson (1949) -3.552 <0.0001 -0.336 0.160 46.59 0.383** Mills et al. (2003) Linear 1 -4.650 <0.0001 -0.176 0.532 59.23 0.399** Mills et al. (2003) Linear 2 -5.167 <0.0001 0.046 0.907 65.38 0.366*
1Mean bias is the intercept obtained by regressing residuals (observed – predicted) on predicted values centered around their respective means. 2Linear
bias is the slope of the line obtained by regressing residuals (observed – predicted) on predicted values centered around their respective means. 3RMSPE is
the root mean square prediction error, expressed as a proportion of the observed mean. 4PC is Pearson’s correlation coefficient between observed CH 4 and
CH4 predicted with the existing equations. ns = non-significant; *p < 0.05; **p < 0.005; ***p < 0.0001.
Development of prediction equations for methane emission
Dry matter intake and metabolizable energy intake are the variables most commonly used to predict enteric methane emission (Axelsson, 1949; Ellis et al., 2007; Johnson & Johnson, 1995; Mills et al., 2003). Although the correlation between these variables and methane emission is of low magnitude (Table 4), the prediction equations including only these variables showed low RMSPE values (Table 5, Equations 1 and 6) and are therefore adequate to predict enteric methane emission. On the other hand, Ellis et al. (2007) observed that the use of DMI in prediction equations for methane emission from cattle resulted in lower RMSPE values than equations developed from metabolizable energy intake. According to the authors, many metabolizable energy intake values were extrapolated from other information provided in the publication and are likely to contain some error compared with DMI values.
The high correlation observed between non-fiber carbohydrate intake and methane emission (Table 4) indicates the potential of this variable to predict the emission of this gas in mathematical models. In fact, the equation based on non-fiber carbohydrate intake provided a low RMSPE (Table 5, Equation 15). According to Moe and Tyrrell (1979) and Mills et al. (2003), the components of this fraction comprising sugars, starch and pectin are good predictors of methane emission since they show a high correlation with the latter. The low RMSPE was also observed when metabolizable energy intake and cellulose intake were included. According to Holter and Young (1992), cellulose and hemicellulose digestibility is highly correlated with methane emission since most ruminal hydrogen derived from carbohydrate fermentation and much of that generated during the conversion of hexoses into acetate or butyrate, via pyruvate, is converted to methane (Benchaar et al., 2001). Thus, factors that contribute to high concentrations of acetate and butyrate, such as high amounts of fiber and fractions with a low passage rate (Hegarty & Gerdes, 1999), result in increased methane emission.
When lignin intake was included in the prediction models, the effect on methane emission was negative. This finding might be explained by the fact that lignin exerts a limiting effect on the digestion of cellulose and hemicellulose, restricting the fermentation of foods by ruminal microorganisms (Ellis et al., 2007). However, Ellis et al. (2007) found no significant correlation between lignin and methane emission. The intake of acid detergent fiber, the portion that contains cellulose, lignin and sometimes silica, was also positively correlated with methane emission (Table 4), corroborating the results of Ellis et al. (2007). In general, diets rich in fibrous carbohydrates have a greater potential of enteric methane emission since the fermentation of these carbohydrates results in greater losses of energy in the form of methane when compared to the fermentation of sugars and starch (Boadi, Benchaar, Chiquette, & Massé, 2004). The positive effect of crude protein intake on the prediction equations revealed that an increase in crude protein intake increases methane emission from the fermentation of amino acids into ammonia, volatile fatty acids, carbon dioxide, and methane (Mills et al., 2003).
The inclusion of ether extract intake in the prediction equations had a negative effect on methane emission. High levels of dietary fat have been shown to depress methane emission due to the biohydrogenation of unsaturated fatty acids that act as a hydrogen sink, reducing the availability of hydrogen for methanogenic bacteria (Dong, Bae, McAllister, Mathison, & Cheng, 1997), as well as due to a reduction in fiber degradation through the formation of a layer that surrounds the fibers and impairs the adhesion of microorganisms (Mathison, 1997). Moreover, fats are not fermented in the rumen, and thus do not produce surplus of hydrogen, consequently methane production could be declined due to production of less hydrogen per unit of feed when higher levels of fats are included in the diets (Patra, 2013).
absence of mean bias in the equations developed here, except for Equations 2 and 9 that showed linear bias (-0.691 MJ d CH4-1, p < 0.0001 and -1.348 MJ d CH4-1, p = 0.017, respectively). These equations tended to
underestimate the predicted values, with the difference between observed and expected methane decreasing as the value predicted with these equations increased.
Evaluation of equations described in the literature
The best equations described in the literature Ellis et al. (2007) included DMI, metabolizable energy intake, acid detergent fiber intake and lignin intake (Table 2, Eq. 11b and 14b). Similar results have been reported by the same authors in a subsequent study (Ellis et al., 2009). The RMSPE of Eq. 2b described by Ellis et al. (2007) and of Eq. A described by Ellis et al. (2009), which included DMI as a single variable, was close to that obtained with the equation developed in the present study based on DMI (Table 5, Equation 1). However, Eq. A of Ellis et al. (2009) underestimated methane emission by approximately 0.861 MJ d-1, which
was not observed for Eq. 2b (Table 6). The high RMSPE values of equation of Axelsson (1949) and Linear 1 of Mills et al. (2003) was also reported by Ellis et al. (2007), evaluating these two equations for a beef and a dairy database and for the two databases combined (37.8 and 55.5%, 40.4 and 33.5%, and 40.9 and 40.7%, respectively). Although showing no systematic error, these equations overestimated methane emission in the present study by 3.55 and 4.65 MJ d-1. Similarly, Wilkerson, Casper, and Mertens (1995) observed that
the equation of Axelsson (1949) overestimated methane emission from lactating and dry cows.
The equations described by Mills et al. (2003), which were developed for dairy cows fed diets formulated for the lactation phase, estimated higher DMI and methane emission than those reported in the present study (12.5 ± 2.8 kg DM d-1 and 16.8 ± 2.8 MJ d-1, respectively), a fact that could explain the overestimation
of methane emission by this equation. The equation described by Moe and Tyrrell (1979), which was based on carbohydrate intake, resulted in a high RMSPE and mean bias, and overestimated methane emission from the animals of the present study by 1.686 MJ d-1. Equation 1b of Ellis et al. (2007) resulted in a lower
RMSPE than Linear 2 of Mills et al. (2003). Both equations were developed based on metabolizable energy intake. However, the two equations overestimated methane emission by 0.467 and 5.167 MJ d-1, respectively.
The equations developed in the present study that included DMI and total carbohydrate intake, metabolizable energy intake and cellulose intake, and DMI and non-fiber carbohydrate intake were the most accurate to predict enteric methane emission. Among the equations described in the literature, the equations proposed by Ellis et al. (2007) that included DMI, metabolizable energy intake, acid detergent fiber intake and lignin intake resulted in the lowest RMSPE when the database of the present study was used. The equations developed in this study showed higher accuracy in predicting methane emission and can be considered more specific for Zebu production systems in tropical climates. The equations developed in the present study can be used for predicting methane emission from cattle under conditions similar to those evaluated here, either to estimate emissions from cattle herds or in national inventories to determine methane emission in beef cattle production systems.
Conclusion
Dry matter and nutrient intake, except for lignin and ether extract intake, are positively correlated with methane emission. The mean error of predicting enteric methane emission with the equations developed in this study based on DMI and nutrient intake is 17% and the most accurate predictions are obtained with equations that include dry matter intake, carbohydrate intake and metabolizable energy intake. Among the equations described in the literature and evaluated using our database, the most accurate predictions are obtained with those that include dry matter intake, metabolizable energy intake, acid detergent fiber intake, and lignin intake.
Acknowledgements
scholarship granted to the first author.
References
Association Official Analytical Chemists [AOAC]. (1990). Official Methods of Analysis (15th ed.). Arlington, VA: AOAC International.
Axelsson, J. (1949). The amount of produced methane energy in the European metabolic experiments with adult cattle. Annals of the Royal Agricultural College of Sweden, 16, 404-419.
Benchaar, C., Pomar, C., & Chiquette, J. (2001). Evaluation of dietary strategies to reduce methane
production in ruminants: A modelling approach. Canadian Journal of Animal Science, 81(4), 563-574. doi: doi.org/10.4141/A00-119.
Blaxter, K. L., & Clapperton, J. L. (1965). Prediction of the amount of methane produced by ruminants.
British Journal of Nutrition, 19(1), 511-522. doi: 10.1079/BJN19650046.
Boadi, D., Benchaar, C., Chiquette, J., & Massé, D. (2004). Mitigation strategies to reduce enteric methane emissions from dairy cows: Update review. Canadian Journal of Animal Science, 84(3), 319-335. doi: 10.4141/A03-109.
Caro, D., Davis, S. J., Bastianoni, S., & Caldeira, K. (2014). Global and regional trends in greenhouse gas emissions from livestock. Climatic Change, 126(1-2), 203-216. doi: 10.1007/s10584-014-1197-x. Corvino, T. L. S., Branco, R. H., Bonilha, S. F. M., Castilhos, A. M., Figueiredo, L. A., Razook, A. G., &
Mercadante, M. E. Z. (2011). Residual feed intake and relationships with performance of Nellore cattle selected for post weaning weight. Revista Brasileira de Zootecnia, 40, 929-937. doi: 10.1590/S1516-35982011000400030.
Dong, Y., Bae, H. D., McAllister, T. A., Mathison, G. W., & Cheng, K. J. (1997). Lipid-induced depression of methane production and digestibility in the artificial rumen system (RUSITEC). Canadian Journal of Animal Science, 77(2), 269-278. doi: 10.4141/A96-078.
Ellis, J. L., Kebreab, E., Odongo, N. E., Beauchemin, K., McGinn, S., Nkrumah, J. D., ... McBride, B. W. (2009). Modeling methane production from beef cattle using linear and nonlinear approaches. Journal of Animal Science, 87(4), 1334-1345. doi: 10.2527/jas.2007-0725.
Ellis, J. L., Kebreab, E., Odongo, N. E., McBride, B. W., Okine, E. K., & France, J. (2007). Prediction of methane production from dairy and beef cattle. Journal of Dairy Science, 90(7), 3456-3466. 10.3168/jds.2006-675. Etheridge, R. D., Pesti, G. M., & Foster, E. H. (1998). A comparison of nitrogen values obtained utilizing the
Kjeldahl nitrogen and Dumas combustion methodologies (Leco CNS 2000) on samples typical of an animal nutrition analytical laboratory. Animal Feed Science and Technology, 73(1-2), 21-28. doi: 10.1016/S0377-8401(98)00136-9.
Fitzsimons, C., Kenny, D. A., Deighton, M. H., Fahey, A. G., & McGee, M. (2013). Methane emissions, body composition, and rumen fermentation traits of beef heifers differing in residual feed intake. Journal of Animal Science, 91(12), 5789-5800. doi: /10.2527/jas.2013-6956.
Goering, H. K., & Van Soest, P. J. (1970). Forage Fiber Analysis. USDA Agricultural Research Service. Handbook number 379 (16th ed). Washington, DC: US Government Printing Office.
Grobler, S. M., Scholtz, M. M., van Rooyan, H., Mpayipheli, M., & Neser, F. W. C. (2014). Methane
production in different breeds, grazing different pastures or fed a total mixed ration, as measured by a Laser Methane Detector. South African Journal of Animal Science, 44(5), 12-16. doi: 10.4314/sajas.v44i5.3. Hegarty, R. S., & Gerdes, R. (1999). Hydrogen production and transfer in the rumen. Recent Advances in
Animal Nutrition in Australia, 12, 37-44.
Holter, J. B., & Young, A. J. (1992). Nutrition, feeding and calves: methane prediction in dry and lactating Holstein cows. Journal of Dairy Science, 75(2165-2175). doi: 10.3168/jds.S0022-0302(92)77976-4. Hulshof, R. B. A., Berndt, A., Gerrits, W. J. J., Dijkstra, J., Van Zijderveld, S. M., Newbold, J. R., & Perdok, H.
B. (2012). Dietary nitrate supplementation reduces methane emission in beef cattle fed sugarcane-based diets. Journal of Animal Science, 90(7), 2317-2323. doi: 10.2527/jas.2011-4209.
Forestry and Other Land Use. Tokio, Japan: IPCC.
Johnson, K., Huyler, M., Westberg, H., Lamb, B., & Zimmerman, P. (1994). Measurement of methane emissions from ruminant livestock using a sulfur hexafluoride tracer technique. Environmental science & technology, 28(2), 359-362. doi: 10.1021/es00051a025.
Johnson, K. A., & Johnson, D. E. (1995). Methane emissions from cattle. Journal of Animal Science, 73(8), 2483-2492. doi: 10.2527/1995.7382483x.
Kebreab, E., Clark, K., Wagner-Riddle, C., & France, J. (2006). Methane and nitrous oxide emissions from Canadian animal agriculture: A review. Canadian Journal of Animal Science, 86(2), 135-157. doi: 10.4141/A05-010.
Mathison, G. (1997). Effect of canola oil on methane production in steers. Canadian Journal of Animal Science, 77, 545-546.
Mercadante, M. E. Z., Caliman, A. P. d. M., Canesin, R. C., Bonilha, S. F. M., Berndt, A., Frighetto, R. T. S., ... Branco, R. H. (2015). Relationship between residual feed intake and enteric methane emission in Nellore cattle. Revista Brasileira de Zootecnia, 44(7), 255-262. doi: 10.1590/S1806-92902015000700004.
Mills, J. A. N., Kebreab, E., Yates, C. M., Crompton, L. A., Cammell, S. B., Dhanoa, M. S., ... France, J. (2003). Alternative approaches to predicting methane emissions from dairy cows. Journal of Animal Science, 81(12), 3141-3150. doi: 10.2527/2003.81123141x.
Moe, P. W., & Tyrrell, H. F. (1979). Methane production in dairy cows. Journal of Dairy Science, 62(10), 1583-1586. doi: 10.3168/jds.S0022-0302(79)83465-7.
Monteiro, A. L. G., Faro, A. M. C. d. F., Peres, M. T. P., Batista, R., Poli, C. H. E. C., & Villalba, J. J. (2018). The role of small ruminants on global climate change. Acta Scientiarum. Animal Sciences, 40(e43124), 1-11. doi: http://dx.doi.org/10.4025/actascianimsci.v40i1.43124.
National Research Council [NRC]. (2001). Nutrient Requirements of Dairy Cattle (7th rev. ed.). Washington, DC: National Academy Press.
Patra, A. K. (2013). The effect of dietary fats on methane emissions, and its other effects on digestibility, rumen fermentation and lactation performance in cattle: A meta-analysis. Livestock science, 155(2–3), 244-254. doi: 10.1016/j.livsci.2013.05.023
Patra, A. K. (2017). Prediction of enteric methane emission from cattle using linear and non-linear statistical models in tropical production systems. Mitigation and adaptation strategies for global change, 22(4), 629-650. doi: 10.1007/s11027-015-9691-7.
Statistical Analisys System [SAS]. (2013). SAS/STAT User guide, Version 9.4. Cary, NC: SAS Institute Inc. Sniffen, C. J., O'Connor, J. D., Van Soest, P. J., Fox, D. G., & Russell, J. B. (1992). A net carbohydrate and
protein system for evaluating cattle diets: II. Carbohydrate and protein availability. Journal of Animal Science, 70(11), 3562-3577. doi: 10.2527/1992.70113562x.
St-Pierre, N. R. (2003). Reassessment of biases in predicted nitrogen flows to the duodenum by NRC 2001.
Journal of Dairy Science, 86(1), 344-350. doi: 10.3168/jds.S0022-0302(03)73612-1.
United States Environmental Protection Agency [USEPA]. (2015). Inventory of U.S. Greenhouse Gas Emissions and Sinks: 1990– 2013. Washington, DC.
Van Soest, P. J., Robertson, J. B., & Lewis, B. A. (1991). Methods for dietary fiber, neutral detergent fiber, and nonstarch polysaccharides in relation to animal nutrition. Journal of Dairy Science, 74(10), 3583-3597. doi: 10.3168/jds.S0022-0302(91)78551-2.
Westberg, H. H., Johnson, K. A., Cossalman, M. W., & Michal, J. J. (1998). A SF6 tracer technique: methane
measurement from ruminants. Pullman, WA: Washington State University.
Wilkerson, V. A., Casper, D. P., & Mertens, D. R. (1995). The Prediction of Methane Production of Holstein Cows by Several Equations1. Journal of Dairy Science, 78(11), 2402-2414. doi: