THISDOCUMENTISNOTANINVESTMENTRECOMMENDATIONANDSHALLBEUSED
M
ASTERS IN
F
INANCE
E
QUITY
R
ESEARCH
After an aggressive acquisitions strategy to consolidate its position in Latin America and Europe outside of Spain, Telefónica is now hard pressed to look into ways of reducing debt from current highs of €59.6 Billion net financial debt in order to avoid further cuts in its current debt rating of BBB. There is increased pressure due to Spain’s and overall Eurozone sovereign debt situation which is still far from a safe resolution and the fact that its shareholders have faced a negative return of 45.5% for the past year.
Telefónica has thus reduced shareholder’s remuneration commitment for 2012 from €1.75 to €1.5 per share with €0.9 being delivered through a scrip dividend. Simultaneously it is actively pursuing the sale of non-core assets and announced on May 30th the beginning of preparations for an IPO of Telefónica Germany. Faced with extremely negative conditions in its home market Telefónica decides to effectively focus on the markets with higher growth potential1, specifically in Latin America. At the same time it is relying on the consistency and stability of results that it has gradually obtained in European markets2, with the objective of growing organically by taking advantage of the strong position it has in many if not all its markets. 3
1
Average market penetration in Telefónica’s Latin American markets was 110.4% at the end of 2011 significantly below average in its European markets of 132.1%. Additionally according to IMF’s “World economic Outlook” released in April 2012 real GDP growth for Advanced Europe is forecasted to be -0.1% and 1.1% in 2012 and 2013, respectively while for Latin America and the Caribbean it is forecasted at 3.7% and 4.1%.
2
In 2011 the company had an organic annual growth in revenues of -7.6% in Spain, -1.6% in Europe and +3.5% in Latin America.
3 Of Telefónica’s 15 main markets the company is the market leader in mobile accesses in 5 and is in second place in 7.
Additionally it offers quadruple play services in 7 markets and three services (including mobile) in 5.
T
ELEFÓNICA
C
OMPANY
R
EPORT
T
ELECOMMUNICATIONS
ERVICES 04JUNE 2012S
TUDENT:
M
ANUELN
UNES[email protected]
Debt matters
Risk averse investors spree away from debt
Recommendation: BUY
Vs Previous Recommendation N/A
Price Target FY12: 15.66 €
Vs Previous Price Target N/A
Price (as of 4-Jun-12) 9.00 €
Reuters: TEF.MC, Bloomberg: TEF:SM
52-week range (€) 8.81-17.05 Market Cap (€m) 4,1417.43 Outstanding Shares (m) 4599.89 Source:Bloomberg
Source: Bloomberg
(Values in € millions) 2011 2012E 2013F Revenues 62,837 62,713 62,786 OIBDA 20,210 21,127 21,092 Net Profit 6,188 4,787 5,156 EPS 1.12 0.92 1.00 P/E 8.07 9.79 9.02 Debt/OIBDA 3.28 2.9 2.97 Net debt/OIBDA 2.95 2.65 2.72 EV/OIBDA 6.8 6.5 6.5 Source: Bloomberg and analyst estimates
“TELEFÓNICA” COMPANY REPORT
THISDOCUMENTISNOTANINVESTMENTRECOMMENDATIONANDSHALLBEUSED
EXCLUSIVELYFORACADEMICPURPOSES (SEE DISCLOSURES AND DISCLAIMERS AT END OF DOCUMENT)
Table of Contents
EXECUTIVE SUMMARY ...3
VALUATION ...3
SPANISH MARKET ... 3
EUROPEAN MARKET (EXCLUDING SPAIN) ... 4
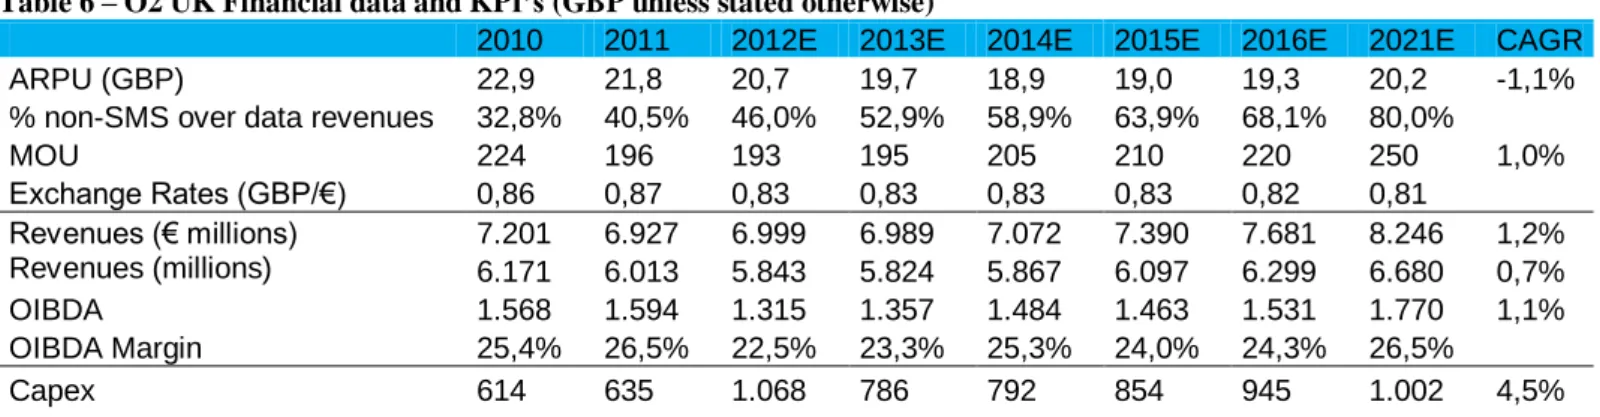
LATIN AMERICA ... 5 COMPANY OVERVIEW ...6 COMPANY DESCRIPTION ... 6 SHAREHOLDER STRUCTURE ... 6 EUROPE...8 EC REGULATION ... 8 SPAIN ... 10 WIRELINE BUSINESS ... 11 WIRELESS BUSINESS ... 15 REST OF EUROPE ... 18 GERMANY ... 18 UNITED KINGDOM ... 21 LATIN AMERICA ...24 BRAZIL ... 24 WIRELINE... 25 WIRELESS... 27 LATAM OPERATIONS... 30 VALUATION ...32 COMPARABLES ... 33
“TELEFÓNICA” COMPANY REPORT
THISDOCUMENTISNOTANINVESTMENTRECOMMENDATIONANDSHALLBEUSED
EXCLUSIVELYFORACADEMICPURPOSES (SEE DISCLOSURES AND DISCLAIMERS AT END OF DOCUMENT)
Executive summary
We value Telefónica using a Sum of the Parts (SOP) approach, with an
explicit Discounted Cash Flow (DCF) valuation for Brazil’s operations,
based on available information. For each country’s unit we forecast Key
Performance Indifcators (KPI’s) as well as revenues and Operating
Income Before Depreciation and Amortization (OIBDA) in local
currencies, which are then converted in euros using forecasted exchange
rates or market forward exchange rates and summed in three regional
units: Spain, Latin America and Europe. These are then integrated in a
global valuation. For Brazil we computed FCF in reais converting to euros
the equity value directly,using market forward rate for the end of 2012.
We look at the main regulatory frameworks as well as current trends in the
industry. Finally we also look very carefully at the debt level evolution in
order to understand the effectiveness of proposed decisions while also
analysing other means at the company’s disposal to avoid further
downward pressure in its credit rating.
Valuation
According to our valuation Telefónica is worth €15.66, which is significantly above current price of €9.00, representing a potential shareholder gain of 73.93%. We believe the market has been especially negative on the company’s stock effectively explaining the loss in value seen in the past year and the underperformance relative to peers and the IBEX 35. We see the strong debt aversion now present in all Europe due to increasing concerns associated with sovereign debt as an explanation for the behavior of Telefónica share price as the company debt increased to above average levels at the worst possible time.
Spanish Market
The valuation of Vivo independently through DCF allows us to look more carefully into the potential for value creation with Vivo.
Besides the announced IPO for Telefónica Germany there are other means at the company’s disposal to address concerns surrounding its debt level.
For the past year not only did Telefónica underperform relative to peers with a negative return of 45.5% compared with an average of -13.06% among comparables and 41.03% for IBEX 35
Figure 1 - Financial and Operational data in 2011 (excl. restructuring charges)
“TELEFÓNICA” COMPANY REPORT
THISDOCUMENTISNOTANINVESTMENTRECOMMENDATIONANDSHALLBEUSED
EXCLUSIVELYFORACADEMICPURPOSES (SEE DISCLOSURES AND DISCLAIMERS AT END OF DOCUMENT)
Home market operations are greatly affected by the current macroeconomic conditions that Spain is going through as a result of both 2008’s financial crisis and the current sovereign debt crisis. Still the country continues to represent a very significant fraction of the company’s cash flow creation (27.5% of Revenues and 33.76% of 2011 Group OIBDA, excluding workforce restructuring plan charges). As the incumbent operator Telefónica has been able to take advantage of its brand recognition and network quality to continously present the highest OIBDA margins in the country and among the highest between comparable companies in their home countries. However stronger competition and a depressed economy has led Telefónica’s revenues to present a negative CAGR (Constant Annual Growth Rate) in the past three years of 6%. For the first time ever in 2011 the company presented negative growth year over year (y-o-y) in accesses of its three main segments (fixed and mobile telephony and internet services). According to our estimates the company’s revenues will show almost no growth as MTR cuts and decreased market share (significantly in fixed line segments) are not compensated by increased data ARPU (0.1% CAGR 2012-2021) while OIBDA will increase at double that rate (0.2% CAGR 2012-2012-2021) as the company takes advantage of its efficiency measures, namely: the workforce reduction program that we expect will reduce in 2012 personnel expenses as % of revenues by 1.3%; and the T-Global Resources division that is concentrating company’s efforts regarding procurement and which the company predicts will allow a €1 billion benefit in 2012. In 2021 Spain is forecasted to represent 22.6% of revenues and 28.2% of OIBDA due to above average OIBDA margin.
European Market (Excluding Spain)
Here the company has been able to somewhat stabilize its results with continous growth in accesses - 3.2% growth in overall accesses for 2011 - while revenues have been down for all countries in both local currency and Euros, except Germany that presented a healthy 4.4% growth in 2011. Overall the revenues were down with a reported 1.3% in 2011, mostly as a result of the competitive landscape, the depressing Irish landscape where revenues were down 14.6%, but also cuts in MTR4 in Czech Republic, the UK, Germany as well as Ireland. OIBDA was up 3.8% for the year, though it is exaggerated by a restructuring charge in Germany in 2010 of €202 million. Without this effect OIBDA would have been down 1.2%. We expect to see growth in revenues starting next year and
4
Mobile Termination Rate – In the European case it is the cost that calling operator has to pay receiving operator to terminate the call (Calling Party Pays)
Source: Companies’ Reports
Figure 2 - OIBDA margins of telecom companies in their home markets
In Europe Germany has presented the best prospects being Telefónica’s only market in Europe presenting growth organically in 2011. This might be an explanation as to why Telefónica while looking for a chance to monetize its assets chose Germany. Otherwise the depressing European landscape might have made the IPO very hard to fulfil.
“TELEFÓNICA” COMPANY REPORT
THISDOCUMENTISNOTANINVESTMENTRECOMMENDATIONANDSHALLBEUSED
EXCLUSIVELYFORACADEMICPURPOSES (SEE DISCLOSURES AND DISCLAIMERS AT END OF DOCUMENT)
forecast 2.17% CAGR from 2012-2021. OIBDA CARG is expected to be 3.37% for the same period driven by a more established position in Germany where the acquisition of HanseNet has allowed Telefónica to be quadruple-play player and in the UK where Telefonica already offers three services. We predict that supply costs as a % of revenues in the region will gradually decline from 2011 levels of 44.3%, compared to 22.3% in Spain or 25.8% in Latin America, being the main contributor to growth in OIBDA. Additionally this effect in OIBDA can be explained by the fact that we estimate 2012 not to be a very good year or that today Telefónica lags in what concerns OIBDA margins, and with the effect already mentioned of T-Global Resources and lower competition and customer acquisition costs, OIBDA can reach higher levels. In 2021 this region shall represent around 25% of Revenues and 20.6% of OIBDA up from 23.6% and 18.3%, respectively.
Latin America
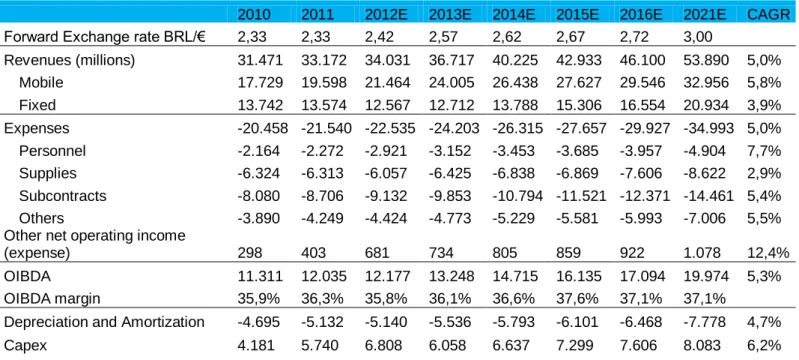
This region is where Telefónica has been showing increasingly better results, driven by growth in accesses with the region representing 45.9% and 47.5% of Revenues and OIBDA respectively and a huge 65.7% of accesses. Total accesses have shown tremendous momentum with 9.6% growth in the 2011, with growth from all segments excluding fixed telephony (-1.8%) with 63.5% of new accesses coming from Brazil, that overall already represents 43.3% of accesses. In 2011 revenues grew a reported 13.5% or 5% organically 5, this growth was also affected by the massive MTR cut in Mexico. For the period from 2012-2021 we expect revenues to increase at a CAGR of 1.55% and 1.85% for OIBDA or 3.89% and 4.12% respectively in local currencies. The main reason for the discrepancy is related with Exchange rate expectations that in most countries are predicted to increase as the inflation differential between the Eurozone and Latin American countries is maintained, however we do not expect this inflation to be totally reflected in ARPU as competitve pressure and MTR cuts from increased regulatory oversee drive down ARPU. Consequently the region shall represent in 2021 47.4% of revenues and 49.5%of OIBDA.
In relation to Brazilian operations we value their equity at $56.325 million Brazilian reais or €22,203 million at current exchange rates which is more than half Telefónica’s current market capitalization despite the fact that it is estimated to represent only 22.9% of 2012 Group revenues or 24.3%% of 2012 Group OIBDA. Our valuation is 6.22% above current market capitalization and implies a
5
In the first 9 months of 2010 Telfónica did not fully consolidate Vivo’s operations.
In May 2011 Mexican telecommunications regulator Cofetel decided to reduce MTR rates from 95 mexican cents to 39.
Negative forecasted evolution for exchange rates in some markets, Increase in competition and the fact that regulators in Latin America are increasingly showing signs of more active regulation in the form of cuts to MTR’s shall prevent a stronger evolution in Latin America
“TELEFÓNICA” COMPANY REPORT
THISDOCUMENTISNOTANINVESTMENTRECOMMENDATIONANDSHALLBEUSED
EXCLUSIVELYFORACADEMICPURPOSES (SEE DISCLOSURES AND DISCLAIMERS AT END OF DOCUMENT)
€26.6 billion Enterprise Value. Being mobile segment (previous Vivo) currently around 60% of Brazilian operations, which would imply around €13.3 billion of overall equity, at first glance the 22.4% stake of Vivo, Telefónica bought from Portugal Telecom in 2010 for €7.5 Billion, represented a very significant premium over the €3.0 billion fair value that these simple computations would suggest. However if we take into account potential losses on fixed operations that indeed were losing ground to competitors we can better justify the premium paid. Telesp, the fixed arm of Telefónica in Brazil had very low awareness (as a result of being restricted until recently only to the São Paulo state) and consequently we created a scenario where market share and ARPU in fixed operations decreased from the levels at which under the more well renowned Vivo brand we believe they will be. This also has to do with the fact that Telesp’s customer satisfaction had suffered some issues in regulator indicators. Under this more drastic scenario valuation for Vivo’s equity would be 49,682 BRL. This means a loss 6,643 million BRL with a loss at Telefónica’s stake of €2,120 million, still below €4.5 billion premium paid but indicating Vivo’s purchase will allow Telefónica to be a more robust operator.
Company overview
Telefónica is a Spanish integrated telecommunications company, providing services all over the world. The company, state-owned until 1999, ranks amongst the top telecommunication companies in the world regarding number of accesses (309.4 million as of March 2012), which is number 4 worldwide behind Vodafone, China Unicom and China Telecom; market capitalization number 7 worldwide; as well as revenues.
Company description
Telefónica provides mobile and fixed telephony, Broadband, Pay-Tv and customer relation management services in over 23 countries.6 Additionally the company also offers wholesale telecommunication services, by taking advantage of its international fiber network. Telefónica is also present in two more countries through significant equity stakes that it holds in Telecom Itália and China Unicom with both full-fledged strategic partnerships.
6
Besides Morocco, the USA and France where Telefónica offers exclusively customer relation management services, the remaining countries where it offers telecommunication services are: Spain, UK, Ireland, Germany, Czech Republic and Slovakia in Europe and Mexico, Brazil, Argentina, Chile, Peru, Colombia, Venezuela, Uruguay, Ecuador, Panama, Nicaragua, Guatemala, El Salvador and Costa Rica.
Figure 3 – 2011 Revenues in billions of euros
Source: Companies’ Reports
Source: Company Reports
Figure 4 - Revenues (millions €) per region over time
“TELEFÓNICA” COMPANY REPORT
THISDOCUMENTISNOTANINVESTMENTRECOMMENDATIONANDSHALLBEUSED
EXCLUSIVELYFORACADEMICPURPOSES (SEE DISCLOSURES AND DISCLAIMERS AT END OF DOCUMENT)
In its home market, Spain, Telefónica’s services are supplied using the Movistar brand and the company, which is the incumbent operator, is the market leader in fixed telephony, broadband services and mobile telephony with market share respectively of 62.6%, 51.5% and 41.0%7 at the end of 2011. Here the company’s revenues have been decreasing with an increasing percentage coming from Latin America.
Telefónica’s most significant market outside Spain is Brazil where the company has consolidated its operations after the acquisition of PT’s stake of Vivo in 2010 for €7.5 billion and subsequent merger of its fixed and mobile segments under the Vivo brand where the company now has a stake of 73.9%. Vivo is the mobile market leader with market share of 29.8% by the end of 1st Quarter (Q) 2012 and 74.784 million accesses8. In the remaining significant Latin American countries, from a revenue perspective, specifically Argentina, Chile, Peru and Venezuela, Telefónica is the market leader in Chile and Peru, 2nd player in Venezuela and 3rd in Argentina. In Europe (except Spain) Telefónica works under the O2 brand that holds strong market shares in key countries such as Germany and the UK. It is important to mention that Telefónica only holds 69.4% of Telefónica Republica Checa.
In September 2011 the company announced an organizational structure revamp with three main outcomes:
The integration of Spanish operations under the European region, therefore creating only two geographical blocks – Europe and Latin America. The fact that operations in Spain have deteriorated for the past quarters due to very negative macroeconomic conditions, with unemployment above 24.4%, as well as fierce competition, justifies the company’s decision to move its home market operations under the European umbrella in an attempt to solidify its position and image as an international company. Another perspective is the desire for the company to stray from its incumbent role associated with Spanish operations.
The creation of a new business unit designated Telefónica Digital that consolidates Telefónica’s operations in the innovation and digital development areas by merging the company’s current resources. This new business unit will be responsible to create an environment prone to fostering innovative ideas. Two important services it will be responsible for are cloud
7
According to Spanish telecommunications’ regulator CMT.
8
Company reports and information from Brazilian telecommunications’ regulator Anatel
With the merger between Vivo and Telesp finalized in September 2011, Telefónica started using exclusively the Vivo brand for all its commercial services in Brazil in April 2012 with Telesp stores becoming Vivo stores and bundling in product offers.
Gilli Coston, head of M2M at Telefónica expects M2M to grow 25% per year driven mostly by the utilities and automotive sectors.
With only two regions Telefónica is also looking into drifting from incumbent image sometimes associated to a slower and less driven company. However in practical terms we do not perceive significant value creation (or destruction) from such a move.
“TELEFÓNICA” COMPANY REPORT
THISDOCUMENTISNOTANINVESTMENTRECOMMENDATIONANDSHALLBEUSED
EXCLUSIVELYFORACADEMICPURPOSES (SEE DISCLOSURES AND DISCLAIMERS AT END OF DOCUMENT)
computing and machine-to-machine (M2M), that are seen as potential growth drivers in the near future with the first expected to generate revenues of €35 billion in Europe by 20149, while the latter is expected to represent €900 billion in revenues for mobile operators in 202010. However, due to lack of information and the deployment of these technologies still in their early stages it is not easy to predict their impact in terms of revenue per operators.
And the creation of a Global Resources unit to take advantage of the company’s leverage in a global scale. This, according to Telefónica, is expected to allow through economies of scale significant savings from the acquisition of devices. Specifically in 2012 the company predicts that it could lead to benefits of 1 billion euros.
Shareholder structure
Telefónica currently does not have very significant shareholders except BBVA and La Caixa that hold respectively 6.279% (of which 6.273% is a direct stake) and 5.05% (of which 5.025% is an indirect stake). Those shareholders are otherwise the only ones with a total shareholding above 5%, besides these companies other stakes worth mentioning are Blackrock, Inc with 3.884% and China Unicom with 1.37%. Telefónica Board of Directors (BoD) has 5 directors appointed at the proposal of its shareholders, 2 from BBVA, 2 from La Caixa and 1 from China Unicom that started its functions only in May of 2011.
Europe
EC Regulation
The ICT market in Europe has been subject to increased scrutiny from regulators as they find that the industry is an essential determinant to increased productivity and a sustainable economic growth. Although until the last decade of the 20th century most countries had a state-owned monopoly telecommunication company, the regulation started to change and become increasingly pro-competition leading to the privatization of these so called incumbent and the openness of the industry to new entrants.
9
According to EC’s estimates:
http://europa.eu/rapid/pressReleasesAction.do?reference=IP/11/575&format=HTML&aged=0&language=EN&guiLang uage=en
10
According to a panel of industry executives from AT&T, Vodafone, among others gathered by the GSM Association.
The cross-shareholding and board seats shared between Telefónica and China Unicom are a clear indicator of the strategic partnership that both parties are seeking. The stability of significant shareholders can also be seen in the fact that the La Caixa board members are the ones with an older date of first appointment of 1994 and 1995.
Source: BEREC “MTR Benchmark Snapshot”
“TELEFÓNICA” COMPANY REPORT
THISDOCUMENTISNOTANINVESTMENTRECOMMENDATIONANDSHALLBEUSED
EXCLUSIVELYFORACADEMICPURPOSES (SEE DISCLOSURES AND DISCLAIMERS AT END OF DOCUMENT)
In Europe the more common approach to MTR is Calling Party Pays, in other words, the network from which the call is made has to pay the interconnection rate. Consequently, EC established in May 7th 2009 a guidance that national regulators have to take “the utmost account” of. They recommend that interconnection rates should be based on real costs (the general approach is the LRIC11) so that customers utility is increased and companies have the motivation to be more efficient in their operations. Termination rates should according to the EC recommendation reach a value between 1.5 and 3 eurocents per minute in 2012. Additionally they recommend that NRA’s12 should eliminate asymmetries between mobile and fixed networks termination services. Currently there is still a lot of variability in what concerns MTR’s in the EU.
We thus expect to continue seeing in all Telefónica’s European markets decreases in MTR’s negatively affecting ARPU and thus mobile revenues folowing recent trends. However it is important to take into account that the weight of interconnection revenues in ARPU is gradually decreasing and thus continued decreases in this source of revenues will undoubtedly become less and less significant. Despite the effect in revenues, MTR’s decrease also positively affects telecommunication companies’ cost structure, by decreasing interconnection costs. Consequently depending on the number of off-net and on-net calls made and received by its customers MTR cuts can even have a positive or neutral effect on OIBDA. For Telefónica we forecast that ARPU will be affected by MTR cuts and consequently revenues however the increased importance of mobile data and inflation to some degree shall in most markets revert the decreasing ARPU trend midway through our forecast period. OIBDA on the other hand will face different effects depending on the market and the company’s competitive position. New entrants or the smaller operators will face two opposing effects, while on one hand they will have to pay lower interconnection rates, allowing them to charge less for off-net calls, they will not be able to take advantage of asymmetric MTR’s where higher MTR’s are imposed for these smaller companies thus in a way subsidizing their operations because these are being abolished by regulators.
11
Long-Run incremental cost – A method to determine what is the incremental cost to a company of providing a service, similar to marginal cost but avoids issues related with the fact that marginal costs can be very different depending on whether usage is close or far from installed capacity, in which case marginal cost would be very high or very low respectively. LRIC measures the long-term increment taking into account that long-term costs can be both fixed and variable in the short-run.
12
National Regulatory agency
The French communication’s regulator ARCEP goes even further estimating efficient mobile termination rates (the ones that increase the economy’s utility by the most) at around 1 and 2 euro cents per minute.
Source: BEREC and companies financial reports
Figure 7 - Average MTR and ARPU in Europe
Source: Telefonica financial reports Figure 6 - Interconnection revenues in Spain (€)
“TELEFÓNICA” COMPANY REPORT
THISDOCUMENTISNOTANINVESTMENTRECOMMENDATIONANDSHALLBEUSED
EXCLUSIVELYFORACADEMICPURPOSES (SEE DISCLOSURES AND DISCLAIMERS AT END OF DOCUMENT)
Another significant source of regulation for Telefónica (and telecommunication’s industry in general) are roaming rates. The reason for the need of regulation according to EC is that there is lack of competition in roaming services thus if left unregulated will lead to asymmetries and loss in well-being for the economy. According to a report published in 2010 the EC has the goal of having the difference between roaming and national tariffs approach zero by 2015. The regulation takes the form of price caps both at wholesale and retail level. Table 1 shows that currently the average Eurotariff13 is very near the regulated cap in most EU member states, except for wholesale data. This empirical evidence shows that the regulation has not been able to create the structural changes desired and increase competition which would be reflected in further decreases in roaming prices below the price caps’ levels. On the basis of such arguments the EC has proposed new regulation to be effective on June 201214, while continuing with price caps. The proposal plans to increase competition through two main venues: first by making it easier for MVNOs
15
to enter roaming markets; second by letting customers choose an alternative provider for roaming services, independently of their national operator and without the requirement to change their SIM mobile card.In relation to the price caps we do not believe they will have a very significant effect on Telefónica’s ARPU. For example roaming revenues in Spanish operations represented less than 2% of mobile service revenues in 2011. On the other hand the increased competition resulting from the two proposals will force some of the prices down and we expect to see a faster approach of retail data prices to the wholesale caps. However we believe that as the goal of roaming prices equal to domestic prices is fulfilled traffic will significantly increase with data roaming becoming increasingly significant. Thus we forecast only a minor decrease in roaming ARPU in the short-term and in the long-term we expect it to rise fueled by the still more expensive data roaming and increased traffic.
Spain
In order to try to reverse the negative trend in accesses while minimizing the effect of commercial efforts on OIBDA Telefónica has put into place a new
13
Eurotariff is the regulated tariff to which the EC price caps apply. Operators are able to offer different tariffs though they are forced to also offer the Eurotariff.
14
The new regulation proposed in July 2011 will continue with the current approach of price caps (until 2016) for the same services though it will introduce a new price cap on retail data, which was not previously covered to prevent situations where users pay €1.6 per megabyte while operators pay, according to latest available data around €21 cents.
15
(mobile virtual network operators those that use other operator’s network to offer their services
Source: BEREC
Table 1 - Roaming Prices in Europe end of 2011
The updated EC regulation on roaming will require “network operators from other Member States to give MVNO’s access to their network at regulated wholesale prices”;
While increased competition will drive ARPU from roaming down we expect to see traffic increase especially in the data segment. Consequently roaming ARPU shall revert decreasing trend after the more significant decreases in price caps happen.
Average Price Cap Making Call €/min 0,32 0,35 Receiving Call €/min 0,10 0,11 SMS sent €/SMS 0,10 0,11 Wholesale data €/MB 0,21 0,5 Retail Data €/MB 1,60 N/A
“TELEFÓNICA” COMPANY REPORT
THISDOCUMENTISNOTANINVESTMENTRECOMMENDATIONANDSHALLBEUSED
EXCLUSIVELYFORACADEMICPURPOSES (SEE DISCLOSURES AND DISCLAIMERS AT END OF DOCUMENT)
workforce reduction program. The company proposed the lay-off of 6500 employees of its Spanish division. The cost per worker was estimated at around €415000 which means a total cost of 2.671 billion euros which were accounted as a personnel expense in 3Q 2011. The company expects to start beneffiting from the program starting in 2012 through 2013 with around 3,149thousand employees already out by the end of Q1 2012. Additionally the company committed to the creation of 650 new jobs in Spain from 2011 to 13. Using an average cost per worker in Spain of €6677216
per year, associated with the fact that workers that entered into the redundancy program were generally older with (average age of 55) which means 12 years of savings we value the benefit from this program at €1.99 billion. Yearly if the company maintains current level of employees the reduction will have a positive effect in OIBDA margin, allowing a decrease of personnel expenses from current levels of 14.6% to 12% of revenues when the program is completed. This decision comes on the heels of the increased weight of personnel expenses on costs mostly as a result of the fact that they have not followed the decrease observed in revenues. However, faced with increased competition from companies with less cumbersome cost structures17 Telefonica can use the lower personnel costs to increase its commercial efforts, to more effectivelly compete, while also offering lower prices without hurting OIBDA, in an effort to reduce churn and turn around the decrease in accesses. Simultaneously the company is focused on maintaining high customer satisfaction levels. According to government demanded publication on quality of service for fixed and mobile telecommunications, Telefonica has been able to present better quality of service among its peers for key issues18.
Our forecasts for the Spanish market (as well as any other market) are greatly influenced by the evolution of the economy for which we use three main macroeconomic factors: GDP growth, inflation and unemployment.
Wireline Business
In the wireline business Spain has gradually seen a decline in fixed retail lines and market penetration as well as a decrease in prices. On the other hand fixed broadband (FBB) accesses have consistently grown albeit gradually at a slower
16
Based on Spanish personnel costs for fiscal year 2011.
17
Though Ono is faced in a somewhat similar position in terms of negative growth in its cable related operations Jazztell is however facing significant growth which justify the rapid decrease in personnel expenses as % of revenues.
18
For both publications issues looked into are: time to restore service; percentage of breakdowns per line; time to repair breakdown; frequency of complaints; time to resolve complaints; percentage of failed calls; time to establish calls among others.
Source: Companies Reports Figure 8 Personnel expenses % of Revenues for Spanish Players
Source: Ministerio de Industria, Energia Y Turismo
Figure 9 - Quality of service report on Fixed (up) and Mobile (down)
Telecommunications
Source: IMF and analyst estimates Figure 10 – Spanish Macroeconomic indicators
“TELEFÓNICA” COMPANY REPORT
THISDOCUMENTISNOTANINVESTMENTRECOMMENDATIONANDSHALLBEUSED
EXCLUSIVELYFORACADEMICPURPOSES (SEE DISCLOSURES AND DISCLAIMERS AT END OF DOCUMENT)
rate. We expect that over our explicit time-frame market penetration per 100 people for FBB will reach 30.8% of by 2021 a middle value between the current highest market penetration rates (in Denmark and Netherlands) and the current EU average. This target might seem too pessimistic though it can be explained from two perspectives: first that historically Spain has presented some of the highest broadband prices in OECD countries which, though we expect to decline with competition, they will remain high and maybe drive off some of the adoption; second and probably the more important factor has to do with mobile broadband which is picking up in most countries and in Spain already presents a 7.5% market penetration, which will ofsett some of the growth in fixed broadband. Despite being above the EU average of 6% Spain’s mobile broadband market is still significantly below Finland levels of 21.4% so there is still a lot of room to grow at a rapid pace.
According to a study conducted by the Spanish telecommunication regulator (CMT) on the substitution effect between fixed and mobile broadband 76.4% of the people with a mobile broadband (MBB) connection did not have previously a fixed connection which supports the fact that up to this point a significant majority of MBB users were not stolen from FBB. However with increased MBB throughput rates19, even if always below fixed ones, FBB users may start finding MBB more attractive and consequently there might be a transition. With LTE20 development in Spain still in its first stages and due to spectrum shortages, MBB prices are not expected to decrease to FBB levels, so this transition effect may take some time to happen21. Consequently in the long-run, even if small, the differences in prices and speed won’t lead to a full transition between mobile to fixed broadband supporting our 30.8% market penetration.
Fibre to the home in Spain is not very developed yet, when compared with other European countries with accesses still below 200 thousand accesses and thus not making the European ranking composed of 20 countries that have at least 1% of households as FTTH/B subscribers. It is however important to mention that in the 2nd half of 2011 Spain added 70 thousand new FTTH accesses closing in
19
Speed of data transmission. LTE technology is expected in its first stages to reach 30 Mbps but can reach 100/150 Mbps. FTTH on the other hand while initially expected to reach around 100 Mbps has already speed of 1Gbps commercialized.
20
Long Term Evolution – Mobile 4th Generation
21
While 4G services are not yet commercialized in Spain current mobile broadband packages for 2Gb are selling for €25 per month with speed up to 7.2Mbps. FBB are offering services without download caps that go from €20 for 30Mbps to €40 for speeds of 50Mbps or 100Mbps in cases where the customer is also a mobile client for the company. In Portugal where LTE is already available prices go for €25, representing a 50% discount with no traffic limit and speeds up to 100Mbps.
Figure 12 - Broadband prices per megabits per second 09/11 - USD
Source: OECD
According to the CMT study on FBB and MBB, the internet connection characteristics that increase users utility more are prices while velocity is not as significant.
Figure 11 – FTTH/B market in Europe end of 2011
“TELEFÓNICA” COMPANY REPORT
THISDOCUMENTISNOTANINVESTMENTRECOMMENDATIONANDSHALLBEUSED
EXCLUSIVELYFORACADEMICPURPOSES (SEE DISCLOSURES AND DISCLAIMERS AT END OF DOCUMENT)
on 171 thousand. With a little over 1 million houses passed Spain presents a take-up rate of 17.1% in line with EU 27 average of 17.5%. Telefónica’s fibre to the home (FTTH) deployment started in 2008 by the end of 2011 coverage reach approximately 1 million homes with 163 thousand accesses. Right now in Spain 74.5% of internet users have speeds below 10 Mbps which are easily achieved with ADSL or cable technologies. Consequently there is no incentive for Telefónica to invest heavily in the very short term in FTTH instead of in a gradual way as the take up rate increases. Additionally the fact that the two other significant Spanish fixed operators Ono and Jazztel, as almost exclusively Spanish operators, are facing a difficult environment mostly competing through prices, in our view does not bode well for the chances that they will try to launch any large scale FTTH investments. They will probably be focusing on local deployments or buying Telefónica’s wholesale services. FTTH deployment is not expected to be pursued by multinational operators Orange and Vodafone due to the very low margins they have consistently presented in this segment.
Regarding Pay-TV, CMT predicts that by 2023 there will be 8.3 million accesses representing 46% of households. For 2021 we estimate that there will be 7.7 million accesses. This would mean an increase of 3.3 million accesses (or a CAGR of 5.8%). Even though this value is below current European average of around 50% we have to take into account that free and state TV in Spain are still very much relevant.
Telefónica maintains a strong foothold in both fixed telephony (FT) and broadband with market shares, according to CMT of 51.5% in broadband and 62.6% for fixed lines. Figure 9 shows the evolution of Telefónica’s market share (MS) of accesses and total revenues in both segments. We can see that since March 2010 both market shares have declined. However it is still interesting to see that even though MS in terms of fixed telephony accesses and traffic is 66.7% and 55.4% respectively revenues MS (in the retail segment) is above 75.3%. This can imply either that Telefónica’s competitors are offering more attractive and cheaper offers that allow users to have unlimited minutes at small flat rates thus explaining the more rapid decrease in traffic market share then in revenues or that customers are acquiring competitors bundled broadband offers. Both justify the increased market share for all competitors.
Regarding internet accesses Telefónica’s revenues are more in line with accesses and the decline in market share of 4% over the last year came at the expense of increase market shares for Vodafone and Jazztel. Once again the
With Spanish internet users still favoring speed below 10Mbps FTTH is not a good value proposition in the difficult environment Spanish people are going through.
Source: CMT
European average of Pay-TV market penetration is incredibly inflated by huge penetration rates in Belgium and Netherlands of around 90%.
Figure 13 - Telefónica FBB and FT Market
“TELEFÓNICA” COMPANY REPORT
THISDOCUMENTISNOTANINVESTMENTRECOMMENDATIONANDSHALLBEUSED
EXCLUSIVELYFORACADEMICPURPOSES (SEE DISCLOSURES AND DISCLAIMERS AT END OF DOCUMENT)
decline can be attributed to price concerned customers that were able to find in Jazztel or Vodafone for the same or even higher speeds a lower tariff. However it is worth mentioning that the decrease in market share of revenues more significantly implies that Telefónica has already reduced its prices, which associated with the fact that Telefónica will be able to start to take advantage of its fibre optic network with higher quality and speeds will lead to a stabilization of market share for the medium to long-term.
The pay-tv market is stabilized in regards to the major players: Ono, Sogecable and Telefónica excluding Pay-Tv offers from digital tv22. Figure 15 shows the evolution of this segment, which is the only place where Telefonica has been able to continue growing. We expect Telefónica to be able to increase its market share as FTTH services are rolled-out throughout Spain and triple-play bundles become increasingly popular.
Table 2 gives our estimations financial indicators related with fixed telephony broadband and pay-tv where we anticipate that Telefónica in the short term to keep up with competition will have to lower prices, thus reducing ARPU in both fixed lines and broadband. This will also be the result of the negative GDP growth in 2012 and the high unemployment rates Spain is expected to continue facing. Fixed Line ARPU is expected to present continuous declines as traditional accesses revenues and voice services revenues lag from increased usage of mobile telephones and the lower perceived value of holding a fixed line that will make people less prone to pay a monthly fee to have it. Broadband ARPU will prove more resilient as the FTTH rollout is consolidated. Data and IT services revenues should continue growing as a result of higher demand for cloud computing or e-health services. We expect to see Telefónica’s market share decrease to 55% in fixed telephony and to 43% in broadband while increasing to 21% for pay-tv at the end of our forecast period.Table 2 - Fixed Line Operating and Financial Data (Revenues in millions of euros)
Table 2 – Spanish Fixed Line Operating and Financial Data (€ millions)
2010 2011 2012E 2013E 2014E 2015E 2016E 2021E CAGR
Traditional Access 2.426 2.170 1.965 1.869 1.792 1.676 1.559 1.200 -6,2% Traditional Voice Services 3.549 3.230 2.976 2.863 2.725 2.536 2.396 1.680 -6,6% Internet Broadband Services 5.421 5.231 5.275 5.369 5.480 5.474 5.644 6.353 1,5%
Broadband 2.914 2.766 2.721 2.712 2.781 2.820 2.898 3.287 1,1% Data and IT Services 2.507 2.465 2.554 2.657 2.699 2.654 2.745 3.065 1,8% Total operating revenues 11.396 10.631 10.216 10.101 9.997 9.685 9.599 9.233 -1,9%
22
GolTV is a sports channel that is available as a payed channel directly from digital tv without the requirement to contract services from a Pay-tv provider.
Source: CMT
Figure 15 - Pay-Tv market shares
Source: CMT
Figure 14 - Bundled offers in Spain (K)
CMT announced that for 2012 the Wholesale Prices exercised by Telefónica for ADSL will decline by 14%.
Figure 16 – ARPU evolution
Source: Company Reports and Analyst Estimates
“TELEFÓNICA” COMPANY REPORT
THISDOCUMENTISNOTANINVESTMENTRECOMMENDATIONANDSHALLBEUSED
EXCLUSIVELYFORACADEMICPURPOSES (SEE DISCLOSURES AND DISCLAIMERS AT END OF DOCUMENT)
With reduced market share in broadband, wholesale accesses are also expected to increase as other operators use Telefónica’s network either through local loop unbundling or bitstream access service23, which should drive growth in this segment. Overall nominal fixed line revenues (as are any other revenue in this report unless otherwise stated) are expected to invert growth in 2016 and to be down from 2010 at the end of our forecast period though due to stabilization in the decline of revenues from traditional access and voice services we forecast a mild terminal growth of 0.3% in fixed line services driven by data and IT services and inflation to some degree.
Wireless Business
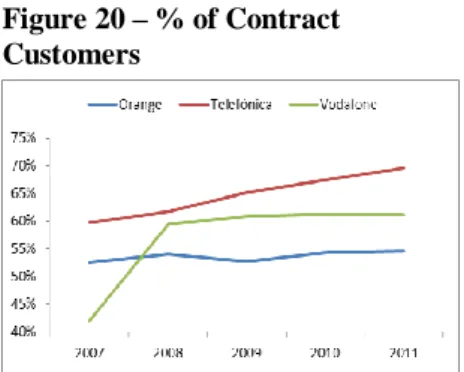
In Spain wireless telephony is already reaching maturity with year over year growth over the past 8 quarters between 0.5% and 2% except in 4Q 2011 where it was significantly above those levels at 3.5%. This growth is mainly driven by growth in the contract segment which already accounts more than 61% of all customers. In prepay there has been some quarters with declines for the same timeframe. However in the wireless segment in general there are two main sources of growth: datacards, associated with mobile broadband and M2M lines. These have been growing heavily and are expected to be the main drivers of future growth in wireless accesses in Spain. At The end of our explicit period market penetration is expected to be around 149.1% from today’s 147.8% in line with the highest current mobile penetration rates in Luxembourg or Portugal. This happens as the result of people having more than one SIM card even if from the same operator for mobile broadband with datacards or tablets.
Telefónica has maintained a strategy of directing its efforts to contract customers that have on average higher ARPU and lower churn rates. Even though from an OIBDA perspective it has contributed to the company being able to achieve high OIBDA margins over the years as discussed, under current economic conditions Telefónica’s market share has decreased. Not only Telefónica but also Vodafone (the two market leaders) have lost market share mostly at the expense of Yoigo and to a lesser extent Orange. Here we are once again faced with a situation where the 45.3% revenues market share in 2011 is higher than the 38.8% traffic
23
With local loop unbundling (LLU) operators install their physical equipment on telephone exchanges and then rent from Telefónica the local loops (the physical wire connection that runs between the local exchange and the customer). With wholesale bitstream access service the competitors do not need to install their own equipment and instead rent Telefónica’s own product, this was mainly used in rural areas where the investment of unbundling local loops was not feasible.
Source: CMT
Figure 19 - Mobile Accesses Market Share
Source: CMT
Figure 18 - Mobile Accesses Growth Figure 17 – Fixed Accesses (K)
Source: Company Reports and Analyst Estimates
“TELEFÓNICA” COMPANY REPORT
THISDOCUMENTISNOTANINVESTMENTRECOMMENDATIONANDSHALLBEUSED
EXCLUSIVELYFORACADEMICPURPOSES (SEE DISCLOSURES AND DISCLAIMERS AT END OF DOCUMENT)
market share or the accesses market share that was between 41.4% and 39.7% in 2011. In relation to datacards Telefónica has had a pretty stable 40% market share over the past year and a half. Telefónica will be able to take advantage of its 3G network coverage that will drive smartphone and datacard adoption, which associated with the deployment of the LTE24 mobile generation will lead to further increases in mobile data consumption and contribute positively to ARPU. The fact that Telefónica has always pushed for the acquisition of higher end customers will pay-off as mobile data consumption continues to increase taking into account that it is this type of customer that will continue driving growth in data related revenues. Additionally the increased smartphone adoption, reaching in European operations 30% of mobile accesses in the first quarter of 2012, bodes well for the growth of data that is done mostly in these devices as well as tablets.
On the other end pushing ARPU further down are MTR rates regulation. According to a proposal issued by CMT on March 30th the regulator proposes to continue imposing a glide path on mobile termination rates that would lead to a decrease in price cap from the current €4 cents to €1.09 cents in July 2013. Additionally it plans to eliminate the current asymmetry that exists in favor of Yoigo who is able to demand a higher charge for terminating calls due to its very low market share. This proposal would put Spain in compliance with EC recommendations regarding lower and more symmetric (in relation to fixed rates) MTR’s. With MTR charges currently representing 8% of mobile ARPU in the last quarter of 2011 after the last decrease, this glide path should depress our expected ARPU by 1.78% for 2012, 3.18% for 2013 and 2.9% for 2014.25 After this period and at the 1.09 eurocents per minute level we do not expect MTR’s to continue decreasing.
We expect in general that market share will continue decreasing for the next two years though with better macroeconomic conditions in Spain in terms of GDP and gradual reduction of unemployment we expect market share to stabilize at 35% and ARPU recuperating in 2014, after the effect from decrease in MTR’s has already been totally incorporated. ARPU should grow mostly driven by data. We do not expect however ARPU to get back to levels above 2010 which were
24
Long-term Evolution (4th generation)
25
Taking into account the current level of interconnection revenues (around 8% of total) that should be maintained if there were no changes in MTR’s we conclude that in the first year our expected ARPU of €27would decrease to €26.59 with the decrease in MTR’s from 4 cents to an average of 3.57 for the 2012 with interconnection charges decreasing to only 7.1% of mobile revenues. The process was repeated on the expected adjusted (by the decrease that had already happened) ARPU’s for 2013 and 2014.
Source: Companies’ Reports MTR’s will decline from €4cents to €3.42 cents in April 2012, to €3.16 cents in October 2012, to €2.76 cents in March 2012 and to €1.09 cents in July 2012.
Figure 21 – ARPU €
Source: Companies’ Reports Figure 20 – % of Contract Customers
“TELEFÓNICA” COMPANY REPORT
THISDOCUMENTISNOTANINVESTMENTRECOMMENDATIONANDSHALLBEUSED
EXCLUSIVELYFORACADEMICPURPOSES (SEE DISCLOSURES AND DISCLAIMERS AT END OF DOCUMENT)
inflated by higher MTR’s and higher costs per minute that we do not forecast will reverse its decreasing trend. Additionally we forecast growth in Minutes of Use (MOU) per month from increased relevance of plans of minutes at fixed rates. Regarding wholesale accesses we expect them to continue to increase as competition intensifies and Telefónica loses market share to other operators that require the usage of Telefónica’s network to service their customers. In mobile this is the case of MVNO’s whose market share though small almost doubled in the past year from 3.46% in September 2010 to 6.1%.
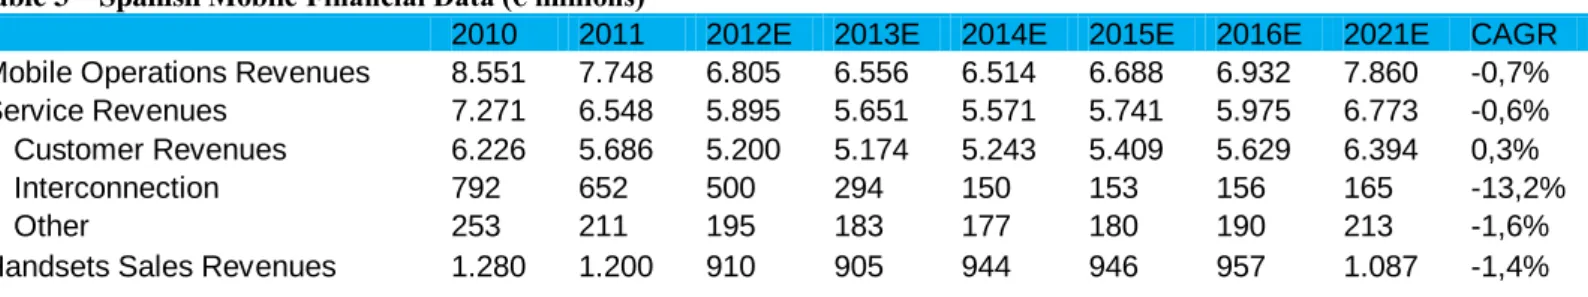
Table 3 – Spanish Mobile Financial Data (€ millions)
2010 2011 2012E 2013E 2014E 2015E 2016E 2021E CAGR
Mobile Operations Revenues 8.551 7.748 6.805 6.556 6.514 6.688 6.932 7.860 -0,7% Service Revenues 7.271 6.548 5.895 5.651 5.571 5.741 5.975 6.773 -0,6% Customer Revenues 6.226 5.686 5.200 5.174 5.243 5.409 5.629 6.394 0,3%
Interconnection 792 652 500 294 150 153 156 165 -13,2%
Other 253 211 195 183 177 180 190 213 -1,6%
Handsets Sales Revenues 1.280 1.200 910 905 944 946 957 1.087 -1,4%
Revenues are expected to grow in mobile starting in 2015 after Spain’s economy reaches a trough and MTR effects are internalized. Interconnection is predicted to be the main negative contributor to growth while customer revenues driven by mobile broadband should grow at the same pace as the economy. We forecast for mobile operations a terminal growth of close to 0.9% growing below the economy due to the maturity of the market already reached in 2021.
Another important aspect is related with 4th generation services. On June 2011 there was the auction in Spain for the Digital Dividend (DD) spectrum26 in which only the three main operators (Telefónica, Vodafone and Orange) had successful bids. This means that Yoigo was left out and it will create difficulties for the small operator to deploy LTE in its own network probably requiring the usage of the others operators’ networks. From Germany’s experience of LTE deployment we do not expect a very significant impact in Capex from LTE due to a gradual approach to the deployment. Y-o-Y growth in Germany’s capex was down 17.8% in 2011, even excluding the effect of the spectrum acquisition (that happened in 2010). Additionally in the USA, the country with higher LTE subscriptions, AT&T last year at the peak of LTE deployment saw an uptick in Capital expenditure of 7.3% in the first 3 quarters of the year ($14.7B compared with $13.7B).
26
The Digital Dividend spectrum is the radio spectrum that was used for TV broadcasting and becomes available with the switchover from analogue to digital TV. This spectrum in the 800 MHz band due to its specific characteristics is ideal for LTE services, with lower costs than deploying LTE in other bands.
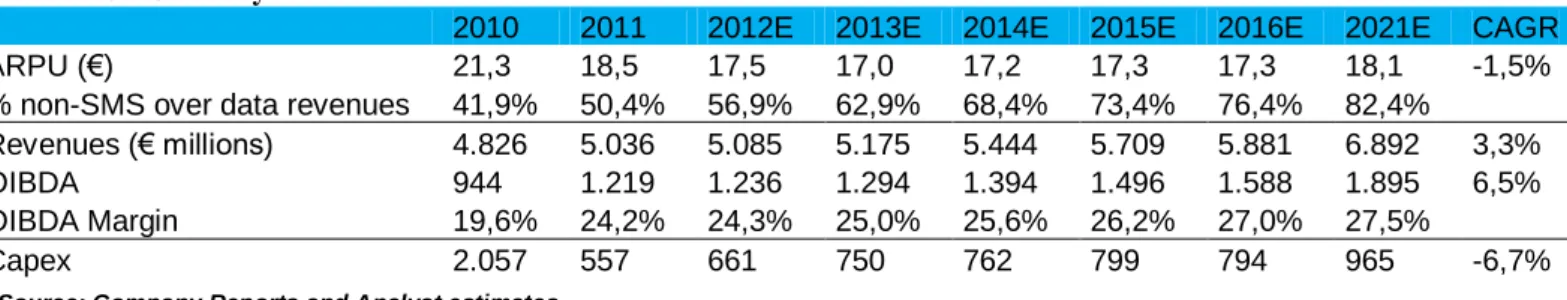
Figure 22 - Accesses and ARPU
Source: Company Reports and Analyst estimates Spain is one of several
countries that have already auctioned 4G spectrum. In Germany where Telefónica was one of the successful bidders LTE deployment has already started.
In Spain the increase in mobile Capex for 2012 should be around 3% as the efforts of deployment should only peak in 2013 based on the current mobile environment.
Source: Company Reports and Analyst Estimates
“TELEFÓNICA” COMPANY REPORT
THISDOCUMENTISNOTANINVESTMENTRECOMMENDATIONANDSHALLBEUSED
EXCLUSIVELYFORACADEMICPURPOSES (SEE DISCLOSURES AND DISCLAIMERS AT END OF DOCUMENT)
Overall revenues for Spain should be down from 2010 levels due in great part to the negative pressure from fixed revenues. OIBDA margin is expected to get worse in 2012 and 2013 due to high competition and low prices, however it should then increase with economic recovery though it should stabilize at 43.0% below historical levels. Specifically we forecast supplies and personal expenses to present lower growth than revenues and subcontracts to grow above revenues due to competition staying high and Telefónica’s lower market share and power in Spain.
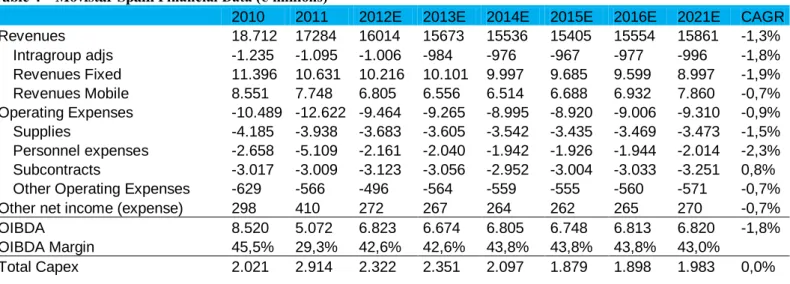
Table 4 – Movistar Spain Financial Data (€ millions)
2010 2011 2012E 2013E 2014E 2015E 2016E 2021E CAGR
Revenues 18.712 17284 16014 15673 15536 15405 15554 15861 -1,3% Intragroup adjs -1.235 -1.095 -1.006 -984 -976 -967 -977 -996 -1,8% Revenues Fixed 11.396 10.631 10.216 10.101 9.997 9.685 9.599 8.997 -1,9% Revenues Mobile 8.551 7.748 6.805 6.556 6.514 6.688 6.932 7.860 -0,7% Operating Expenses -10.489 -12.622 -9.464 -9.265 -8.995 -8.920 -9.006 -9.310 -0,9% Supplies -4.185 -3.938 -3.683 -3.605 -3.542 -3.435 -3.469 -3.473 -1,5% Personnel expenses -2.658 -5.109 -2.161 -2.040 -1.942 -1.926 -1.944 -2.014 -2,3% Subcontracts -3.017 -3.009 -3.123 -3.056 -2.952 -3.004 -3.033 -3.251 0,8% Other Operating Expenses -629 -566 -496 -564 -559 -555 -560 -571 -0,7% Other net income (expense) 298 410 272 267 264 262 265 270 -0,7%
OIBDA 8.520 5.072 6.823 6.674 6.805 6.748 6.813 6.820 -1,8%
OIBDA Margin 45,5% 29,3% 42,6% 42,6% 43,8% 43,8% 43,8% 43,0%
Total Capex 2.021 2.914 2.322 2.351 2.097 1.879 1.898 1.983 0,0%
Capex is expected to be significantly higher than average in 2012 and 2013 (2011 is inflated by the cost of spectrum acquisition of €669 million) due to FTTH and LTE rollout though the company will probably even out Capex to avoid having the bulk of it in 2012 at the same time as it faces debt restrictions. Capex as % of revenues is close to average of comparable companies in similar positions; specifically Portugal Telecom and Deutsche Telekom have both LTE and FTTH deployments underway.
Rest of Europe
Telefónica has operations in 5 more countries in Europe: Germany, UK, Ireland, Czech Republic and Slovakia. Additionally operations in Europe also include TIWS27, which are the wholesale services Telefónica provides outside of Spain. The two more significant are the UK and Germany both in terms of Revenues as well as OIBDA. ARPU has been decreasing as a result of fierce competition in all markets and has been driven further down by constant and gradual decreases in
27
Telefónica International Wholesale Services
Source: Company Reports and Analyst estimates
Source: Companies’ Reports Figure 23 - OIBDA margin in Spanish operations
Source: Companies’ Reports
Figure 24 - Capex % revenues in domestic operations
Source: Company Report 2011
“TELEFÓNICA” COMPANY REPORT
THISDOCUMENTISNOTANINVESTMENTRECOMMENDATIONANDSHALLBEUSED
EXCLUSIVELYFORACADEMICPURPOSES (SEE DISCLOSURES AND DISCLAIMERS AT END OF DOCUMENT)
MTR’s with double digit declines in Telefónica’s markets.28
Additional cuts are anticipated as the current MTR’s are still above EC’s recommendation in all countries. On the other hand data traffic explosion has helped to smooth some of the decline in ARPU especially in Germany where data ARPU has taken advantage of LTE rollout.
Germany
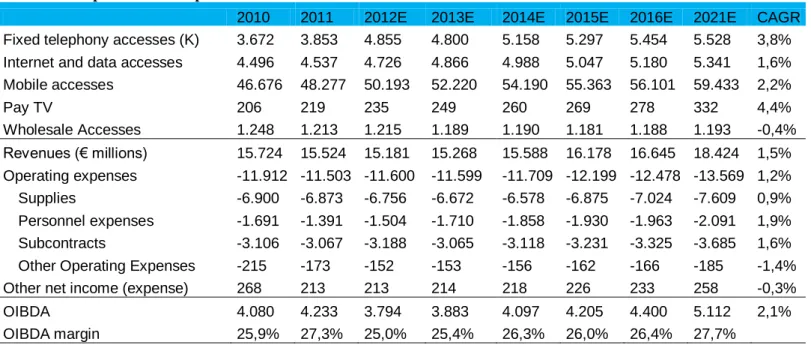
In Germany, where macroeconomic indicators paint a very stable and low growth picture, Telefónica uses O2 brand and has operations in all segments: fixed and mobile telephony, internet and pay-tv and represented 8% of total revenues and 5.3% of OIBDA in 2011. The fixed telephony market in Germany is stagnant, as generally seen in most countries nowadays, with decreases y-o-y of around 0.5%, and we expect number of subscribers to stabilize based on triple play offers. O2 has a 4.6% market share at the end of 2011 and has seen accesses grow in the previous year at a significant rate of 7.2% that increased to 20.2% in the first quarter of 2012 taking advantage of the acquisition of Hansenet29. We see this strong momentum as indicator that O2 will continue to gain market share driven by adoption of its fixed broadband offers though growth should slow down in the short to medium term until accesses stabilize at an 8.5% market share. Fixed broadband services should be the main drivers of adoption of not only fixed telephony but also pay-tv with increased bundling by operators. We expect an increase in broadband market share from the current 9.7% to around 11.5% at the end of our explicit period mainly driven by the lower prices offered compared to competition in the short term. Right now O2 is offering DSL services at significantly lower rates than Deutsche Telekom with €14.99 offer for basic DSL and fixed telephone if made with a contract of 24 months otherwise for €24.99. Deutsche Telekom (DT) on the other hand is offering similar service for €29.99, which gives an idea of the price competition Telefónica is pursuing and might explain the low OIBDA margin seen in the market.
In the mobile business Germany currently presents a high market penetration of 138.9% and growth in accesses of 4.8% for 2011. We expect this growth to gradually decrease leading to market penetration of 165.1% by 2021 driven by the adoption of broadband offers. Regarding O2 that held at the end of 1st quarter 2012 16.4% market share from 12.9% in 2006 is expected to continue increasing its market share from rival KPN (E-Plus) who was the operator left out in the
28
Over the last 2 years MTR showed double digit declines between 15.4% in Slovak Republic and 50.2% in Germany.
29
Hansenet was a fixed line German operator acquired by Telefónica in 2010.
The macroeconomic indicators for European markets show signs that consumers will either spend more or stabilize their telecommunication consumption
Source: Bundesnetzagentur
Growth in broadband market share shall not be more significant as Deutsche Telekom FTTH infrastructure quality starts allowing the incumbent operator to price above competitors.
Figure 27 - FT and FBB accesses in Germany (K)
Figure 26 – German Macroeconomic indicators