THIS REPORT WAS PREPARED BY MANUEL MEDEIROS, A MASTERS IN FINANCE STUDENT OF THE NOVA SCHOOL OF BUSINESS AND ECONOMICS, EXCLUSIVELY FOR ACADEMIC PURPOSES.THIS REPORT WAS SUPERVISED BY ROSÁRIO ANDRÉ WHO REVIEWED THE
M
ASTERS IN
F
INANCE
E
QUITY
R
ESEARCH
Exhibiting commercial momentum – NOS added 138k mobile users in 3Q14 vs. 100k the previous quarter and also reduced Pay TV losses from 22.7k in 2Q14 to only 8.9k this quarter, despite Vodafone’s aggressive pricing, which I show to be unfeasible
Growing in a €2bn corporate market – NOS has won in
the past months flagship large corporate accounts from the market incumbent like CGD and BPI, but it can keep building that backlog further as an integrated player in a segment where it only had 15% market share as of 2013
Potential for substantial shareholder remuneration –
with no significant M&A in sight, there is potential to pay-out €0.27 per share in dividends (6% dividend yield) without breaking the 2.0x Net Debt/EBITDA barrier in 2016
Refinancing deals as a catalyst – by placing privately €275m in bonds, NOS reduced its average cost of debt by 50bp in just 9 months. With €327m in debt maturing in 2015, the consequently lower risk of debt should be a catalyst for the shares in 2015
Company description
NOS is a cable and telecommunications company that offers Pay-Tv, broadband, fixed voice and mobile services in the Portuguese market. Its activities also include the cinema distribution and exhibition as well as content creation and sale through NOS-owned Pay-Tv channels.
NOS
SGPS
C
OMPANY
R
EPORT
T
ELECOMMUNICATIONS
7
THJ
ANUARY2014
S
TUDENT
:
M
ANUEL
M
EDEIROS
[email protected]
Converging their way to the upside
Recommendation: BUYPrice Target FY15: 6.46 €
Price (as of 7-Jan-15) 4.95 €
Bloomberg: NOS PL
52-week range (€) 3.90-5.83
Market Cap (€m) 2560
Outstanding Shares (m) 512.2
Source: Bloomberg
Jan-14 Apr-14 Jul-14 Oct-14 Jan-15
NOS PSI20
Source: Bloomberg
(Values in € millions) 2013 2014E 2015E
Revenues 990 1401 1426
EBITDA 318 533 565
Net Profit 10 96 135
EPS 0.03 0.19 0.26
NOSSGPS CONVERGING THEIR WAY TO THE UPSIDE
PAGE 2/32
Manuel Medeiros
Table of Contents
EXECUTIVE SUMMARY ... 3
MAIN ASSUMPTIONS ... 4
ZAP... 6
SENSITIVITY ANALYSIS ... 9
COMPANY OVERVIEW ...10
BRIEF HISTORY ... 10
BUSINESS UNITS ... 10
Telco ... 10
Cinema and Audiovisuals ... 12SHAREHOLDER STRUCTURE ... 13
THE SECTOR ...14
MARKET OVERVIEW ... 14
COMPETITION ... 17
M&ACONTEXT... 18
COMPARABLES ... 20
FINANCIAL FORECASTS ...22
REVENUES – ENJOYING CONVERGENCE ... 22
Consumer Telco ... 22
Business Telco ... 24
Cinema and Audiovisuals ... 25EBITDA–SYNERGIES SHOULD ALLOW MARGIN IMPROVEMENT ... 26
CASH FLOW GENERATION ... 27
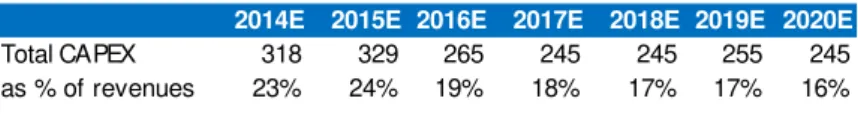
CAPEX stabilization from 2017 onwards ... 27
What to do with the cash – substantial shareholder remuneration on the horizon ... 27LOWER COST OF DEBT AS A TRIGGER ... 28
SCENARIO ANALYSIS ...29
APPENDIX ...30
FINANCIAL STATEMENTS ...30
NOSSGPS CONVERGING THEIR WAY TO THE UPSIDE
Executive Summary
I initiate coverage of NOS SGPS with a BUY recommendation and a fair value of 6.46€, including a cash in from dividends in 2015, with a 30.5% upside to its current price of €4.95, as of January 6th.
Since the Zon-Optimus merger, NOS became a fully integrated player in the Portuguese Telecommunications market, offering services of broadband, fixed voice, Pay TV and mobile both separated and in a convergent manner. NOS has shown significant commercial momentum in recent quarters, both illustrated by increasing its market share in the mobile sector, adding over 138k subscribers in 3Q14 but also by losing Pay TV customers in a gradually slower rate.
My view is that if NOS displays this commercial strength when in a context where there is Vodafone’s very aggressive pricing – 3P bundle at €24.99 a month for 2 years – then there is great potential for NOS to up-scale even more of its wide base of Pay TV customers to higher value bundles that include broadband and mobile as well, when the competitive landscape smoothens. I am confident that Vodafone will ease its pricing policy after 2015 on back of two main reasons. Firstly, Altice winning bid will make the market shift from 4 players to only 3, thus diminishing competitive pressure. Secondly, I show below that network and programming costs alone make Vodafone lose money on each customer it adds at its current price of €24.99, be it through satellite or fibre.
Lastly, I consider that given the consolidated picture of the Portuguese Telco market going forward and the statement by NOS management that it’s not in their objectives to spend further money in Africa through ZAP or any other player, than the cash flow generated will not be used to pursue any major M&A activity. Thus, the cash will most likely be distributed to shareholders. NOS could distribute up to €0.27/share in dividends in 2016 without breaking the 2x Net Debt/EBITDA barrier, thus maintain a stable level of leverage.
NOSSGPS CONVERGING THEIR WAY TO THE UPSIDE
PAGE 4/32
Manuel Medeiros
Valuation
The valuation method used was a Sum-of-Parts valuation, valuing separately NOS’
operations and its 30% stake in ZAP. Both parts were valuated using a Discounted Cash Flows Model. Under this methodology I reached the target price of €6.46, and accordingly I have a BUY recommendation for the stock, with a 31.5% upside to be materialized by the end of 2015. Note however that this target price does include the expected cash-in from a dividend payment to occur in 2015 as well as a probability weighted scenario analysis.
Main Assumptions
My DCF valuation is subject to be discounted at the weighted average cost of capital, under the current market weights of debt and equity in the firm, respectively 30% and 70%. In order to obtain the expected return on these two sources of capital I will use a CAPM approach, and all the accordingly needed inputs.
Starting with risk-free, although the 10y German Bund yield is usually used as a proxy for a risk-free long-term investment in Europe, I believe today’s environment of unprecedentedly
low interest rates biases down that rate considerably, as it currently stands at 0.9%, and three/four years for now that will no longer hold. So, as rates go up a couple of years from now I would end up with a very ill representation of a risk-free investment for the major part of the time frame involved in my valuation, as I likely could re-invest without risk again at a higher rate, 10 years from now. Given this unprecedented low-rate period we are currently in, I took instead the last ten year average of that same 10y German Bund yield, which generated a risk-free rate of 2.6%. Alternatively, I could have used the current yield on the 30y German Bund as the risk-free rate, 1.32%1 on my model. However, that rate has considerably lower trade volumes, making it less liquid and therefore a poorer choice as a proxy for the risk-free rate. Hence, despite using the last ten year average of the weekly 10y German bund yields as the risk-free rate in my base case scenario, I acknowledge the possibility of using the alternatives in the table to the left, by matching separately each risk-free rate hypothesis with the corresponding discount rate.
Also, by regressing the returns of NOS on the MSCI World Index I obtained a Beta on the stock of 0.90 for the last 3 years. Notice that prior to the NOS stock, I am taking the ZONOP and prior to the merger the ZON Multimédia stock, as considering only the company after the merger effectively translated into a new stock would be too few observations, thus yielding a statistically non-robust Beta. Alternatively, I looked at the Beta of comparables in the Portuguese market, Portugal Telecom and Sonaecom. Their Betas against the MSCI World Index were 1.21 and 0.84, respectively. However, I have chosen not to factor in this
Betas in my cost of equity calculation for NOS. This is because both companies’ excess
returns in the later stages of my samples have very little to do with the perceived risk NOS will have going forward as a cable/telecom carrier company in Portugal – Portugal Telecom
1 As of January 2nd, 2015
Table 1 – Risk-free rates and the correspondent WACC (%)
Risk-free
WACC
Base Case Scenario
2.63%
8.70%
Current 10Y Bund Yield
0.50%
4.98%
Current 30y Bund Yield
1.32%
6.42%
Source: NOVASBE Research; Bloomberg
NOSSGPS CONVERGING THEIR WAY TO THE UPSIDE
listed in the PSI20 since the Oi-PT merger is a holding-like company that holds 25.6% of Oi.
The behaviour of its price is driven by Oi’s performance (thus tied with Brazilian telecom
market) and more importantly by evolution of bid’s made by Mrs. Isabel dos Santos. As for
Sonaecom, once the owner of Optimus which is now a part of NOS, ever since the merger took place is a company much more directed at the IT consulting and media publishing businesses. Thus, both cases would fare a poorer estimation of NOS’ systematic risk.
Considering the historical market risk premium since 1946 according to Siegel (2005) of 6.27%, I obtained a cost of equity of 8.38%.
As for the cost of debt, I started off by estimating a credit rating for NOS through Moody’s
credit rating methodology for the telecommunications industry2 and applied to NOS, as NOS does have public trading bonds but not only are they a scarce sample (only two bonds), they are also not graded by any credit rating agency. My estimations yielded a rating of Baa3 (the lowest of investment-grades, equivalent to BBB- on S&P’s scale). However, as NOS’ cash
flows are generated in excess of 90% in Portugal, they are undoubtedly subject to a sovereign risk as well, that is not entirely taken into account in Moody’s methodology3. Thus,
by equalling weighing NOS’ estimate and the Portuguese Sovereign credit rating (Ba1), I obtained NOS overall credit rating of Ba1, the first grade to fall under the non-investment category. Then I associate the credit rating with the average market implied credit spread on the Ba1 rating, 3%. The rating is also associated with an historic probability of default (0.67%4) that I equally weight against the European telecommunication industry default rate
forecasted for 2014 by Moody’s (0.9%4). Considering also Moody’s historical recovery rates by debt types, I get an overall amount-weighted recovery rate of 66.3%. Adding that to the risk-free stated above (2.62%), I arrived at a cost of debt of 5.61%, which consequently yields a WACC of 8.70%. The inputs taken for the WACC are stated on the table to the left. The cash flow I project for the firm are the following:
2Moody’s Investor Service (2010) Rating Methodology - Global Telecommunications Industry
3Moody’s factors for the estimation of NOS’ credit rating and the score attributed to those same factors are detailed in the appendix
4 Annual Default Study: Corporate Default and Recovery Rates, 1920-2013, Moody’s
Table 2 –Inputs for the WACC
Risk-free 2.63%
Beta 0.905
Market Risk Premium 6.27%
Target D/EV 31%
Target E/EV 69%
Re 8.30%
Rd 5.61%
WACC 8.70%
Source: NOVASBE Research
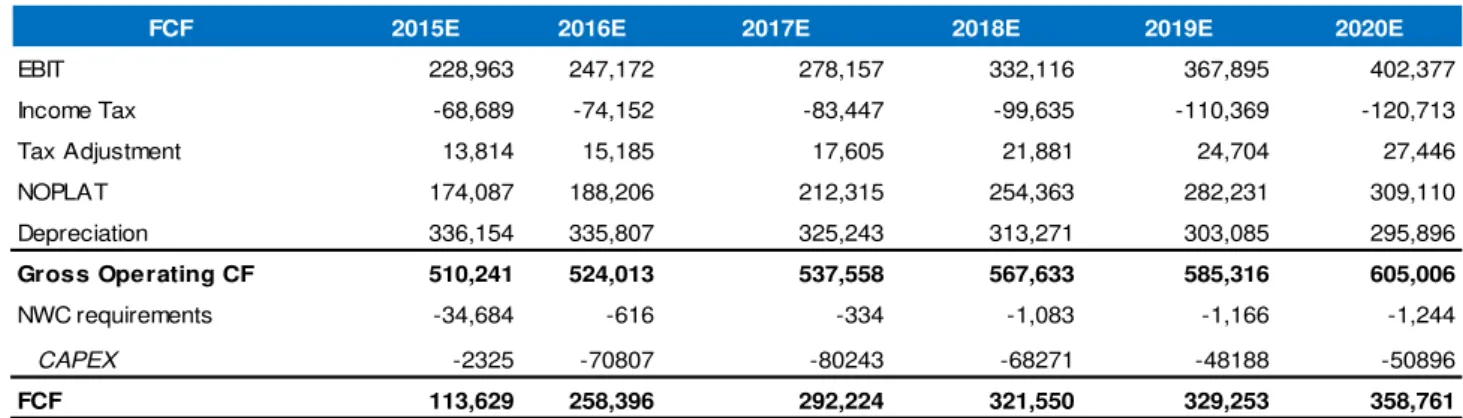
Table 3– NOS Forecasted Cash-Flows (Under Base Case Scenario) in €000’
Source: NOVASBE Research
FCF 2015E 2016E 2017E 2018E 2019E 2020E
EBIT 228,963 247,172 278,157 332,116 367,895 402,377
Income Tax -68,689 -74,152 -83,447 -99,635 -110,369 -120,713
Tax Adjustment 13,814 15,185 17,605 21,881 24,704 27,446
NOPLAT 174,087 188,206 212,315 254,363 282,231 309,110
Depreciation 336,154 335,807 325,243 313,271 303,085 295,896
Gross Operating CF 510,241 524,013 537,558 567,633 585,316 605,006
NWC requirements -34,684 -616 -334 -1,083 -1,166 -1,244
CAPEX -2325 -70807 -80243 -68271 -48188 -50896
NOSSGPS CONVERGING THEIR WAY TO THE UPSIDE
PAGE 6/32
Manuel Medeiros -10.0%
-5.0% 0.0% 5.0% 10.0% 15.0%
2009 2010 2011 2012 2013
Portugal Telecom Sonaecom
Zon Multimédia/ ZONOP
Regarding the Terminal Value, I project the free cash flow generated in perpetuity, growing at my estimated long-term sustainable growth rate g. The long-term growth rate I have chosen is 1.5%. I have chosen this growth rate as I believe in a country like Portugal with very modest growth expectations going forward, even if I would take the expected long-term inflation rate to be maintained by the ECB at 2%, that would still represent an overestimation, since the Telcom market overall is a declining market as I show in the
“Market Overview” section of this report. Ultimately, I do not believe Portugal will keep the inflation rate in-line with the Euro-zone as whole, as it has been the case recently. Notice I have left out the sustainable growth rate. This is mostly because, historical speaking the sustainable growth rate for telecom companies in Portugal has not been a good proxy for their ability to growth in the very long-term (as they should grow the least at inflation forecasted for the following periods), as shown by the erratic top line illustrated on the left. Also, looking at the ROIC of Portuguese competitors, we can confirm that NOS (former ZON and ZONOP) has had for most years the superior ROIC. This is particular relevant to ensure value creation in the perpetuity (growing at least at the inflation rate) – ROIC is more resilient than growth. Thus, since NOS exhibits higher ROIC than its peers, it is more likely to create value in the long-term than they are.5
As for the Terminal Value cash flow per say, I firstly I make the revenues from the last projected year 2023 grow at g stated above and practice the long-term EBITDA margin I have
projected for the company of 41%. Afterwards, I estimate Depreciation as 97% of CAPEX, since I have a guidance for a steady state CAPEX for the company of 17% of Revenues and Depreciation has been in my model on average 97% of CAPEX. I also factor in the net working capital requirements growing at the sustainable growth rate, take out the CAPEX estimated as just mentioned in the end get the first FCF of my perpetuity. Table 4 on the left summarizes the estimations mentioned above.
ZAP
As I mentioned above, I value separately the 30% stake NOS has in African Telcom company ZAP. ZAP is a joint venture, held 30% by NOS and 70% by SOCIP – Sociedade de Investimentos e Participações, S.A. (wholly controlled by Mrs. Isabel dos Santos) which offers satellite Pay TV in Angola. ZAP has a leadership in terms of Portuguese-spoken content in the Angolan market, and has its own home produced shows. ZAP has innovated in the market also through the improvement of its set top boxes and the introduction of HD contents. Also, ZAP is the exclusive operator of sports premium channel, SportTV Africa.
ZAP has seen its customers grow 70% in 2013, along with EBITDA growing 257% to
€47.39m at end of the year exchange rates and for the first year turning a profit. Given
ZAP strong presence in a considerably undeveloped telcom market, I expect subscribers growth rate to be very high, backed both by population growth in Angola as well as significant (still a very undeveloped market in this front) growth of Pay-Tv penetration,
5Bing Cao, Bin Jiang, and Timothy Koller (2006) Balancing ROIC and growth
Table 4– Terminal Value Cash Flow (Post-2023)
Source: NOVASBE Research Source: Company Information; Bloomberg
Chart 1 –Sustainable growth rates and ROIC for Portuguese Telco Operators (%)
EUR m
Revenues 2,004
EBITDA Mg 41%
EBITDA 822
Depreciation 334
EBIT 488
EBIT*(1-t) 366
Depreciation 334
NWC Req. -2
CAPEX 341
FCF 361
1% 3% 5% 7% 9%
2009 2010 2011 2012 2013 ZONOP/Zon Multimédia Sonaecom
NOSSGPS CONVERGING THEIR WAY TO THE UPSIDE
which below 4.2% in 2012. This customer base growth affects revenues on two parallel sources, one the usual monthly fee associated with providing Pay-Tv services; the other which differs from the usual business model – the sale of set-top boxes to its clients. Notice however that this should be a one-off revenue, selling the set-top box once, as they become new clients of ZAP.
However, this growth should be accompanied with corresponding growth both in NWC capital requirements and CAPEX. I estimate the former to be 5% of yearly increase in revenues. As for CAPEX, according to information provided by NOS, it amounted to 6% and 8% of sales in 2012 and 2013. Although I recognize this number should increase as customer base grows, it should never reach a steady state that NOS CAPEX will, for example, the mentioned 17% of revenues. This is because ZAP business is a satellite based one, therefore the CAPEX it incurs in is driven by the rental of satellite “space”, in
other words paying for the capability of sending out a signal out to more homes. It does not, however require any physical investment in network like the fibre in Portugal does, for instance. Therefore, I estimate CAPEX never to surpass 10% of sales. The margin of ZAP should tend in the long-run to the EBITDA margin of close to 40%, as this is the low-end average for satellite Pay-Tv providers in the market. All in all, in the following table I summarize my projections for the proxy cash flow to be generated by ZAP in the future:
In order to discount them to the present, I firstly take the same risk-free rate as for NOS, the average yield on German 10-year Bunds, 2.63%. I consider the same rate because I am projecting the cash flows based on Euro-denominated inputs, therefore they should be subject to the return for a risk-free investment in that same rate; after translating future cash flows at the EURUSD forward curve (later in this topic, I will explain the additional exchange rate risk implied in this reasoning). Afterwards I estimate the cost of equity, through the CAPM, estimating a levered Beta for ZAP. For doing so, I took 6 listed African telecommunication stocks – Econet Wireless, Telekom Networks Malawi, MTN Group, Safaricom, Vodacom Group and Sonatel and graphed their excess returns against the MSCI World Index. After excluding the outliers based on the judgement of a 95% confidence interval on the Betas obtained, I de-levered those Betas at the respective
company’s market debt-to-equity ratio and then re-levered the average Beta at ZAP’s target
capital structure – 80% Equity, 20% Debt, as quoted by NOS’s guidance. This process yielded an equity Beta for ZAP of 0.83.
Table 6 - Levered Betas against MSCI World Index
Source: Bloomberg
* Betas taken from weekly returns in the past 3 years
Africa
MTN Group 0.632
Safaricom 0.462
Vodacom 0.795
Europe
Telefonica 1.307
Orange 1.273
Numericable 0.87
Source: NOVASBE Research
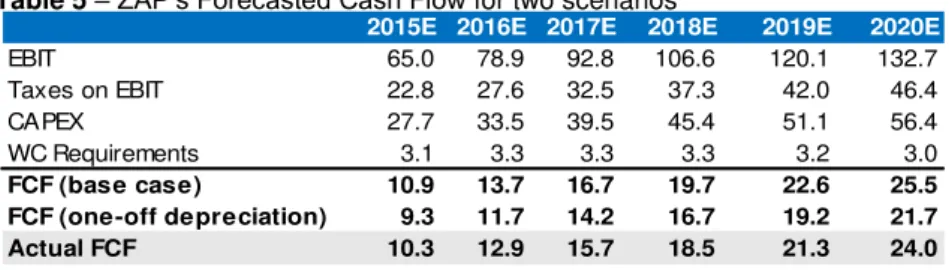
Table 5–ZAP’s Forecasted Cash Flow for two scenarios
2015E 2016E 2017E 2018E 2019E 2020E
EBIT 65.0 78.9 92.8 106.6 120.1 132.7
Taxes on EBIT 22.8 27.6 32.5 37.3 42.0 46.4
CAPEX 27.7 33.5 39.5 45.4 51.1 56.4
WC Requirements 3.1 3.3 3.3 3.3 3.2 3.0
NOSSGPS CONVERGING THEIR WAY TO THE UPSIDE
PAGE 8/32
Manuel Medeiros
This Beta should include any form of systematic risk ZAP, be it originating from the cyclicality of their businesses or from their operational leverage. When looking at European telecoms counter-parts, they have on average a higher Beta against the MSCI World Index, as shown on the table to the right. This evidence of lower systematic risk for African telecoms can, in my opinion, be explained two distinct factors. Firstly, the fact that the African Telecoms listed do not have fiber-to-the-home services included in their Pay-Tv offers, instead they services are offered via satellite or they are just mobile operators. The former businesses have a smaller need for capital expenditure and a lower share of costs are fixed as they do not need to invest as much infrastructure, which would account for the lower operational leverage. On the other end, as I obtained the Beta against the MSCI World Index, it may be that African telecoms are subject to the different business cycles than the markets which are more relevant to the that index – U.S., United Kingdom and Japan make up 74% of the index – being the former more affected by commodities shocks and Chinese imports than the latter, for instances. Therefore, I am comfortable with the lower systematic risk inputted in to my valuation of ZAP. For a market risk premium equal
to the one used in NOS’ valuation of 6.27%, I obtained a cost of equity of 7.9%.
As for the cost of debt, given the scarcity of rating information and the shortage of comparables, I took Bloomberg’s market value derived cost of debt estimates for the same
comparables I used to estimate the Beta – MTN Group, Safaricom and Vodacom – and obtained an average cost of debt 7.7%. All in all I obtained a WACC of 7.9%. This rate seems too low for a cable company in a frontier market, but the issue here is that the low market-driven risk of the company can be justified by the factors listed above: lower operational leverage and distinct business cycles than the ones captured by MSCI World Index; this makes up for a low systematic risk for a holder of a geographically diversified portfolio. However, in order to ensure the full capture of the risk of the company (and not exclusively the systematic one), I factored in a scenario into my cash flow projection of a specific risk of the company – a one-off depreciation of the Kwanza against the dollar. Although the company incurs in costs both in Angola Kwanzas (AOA) and in dollars6, the Angola Kwanza is pegged to the USD by the National Bank of Angola (BNA), which usually ensures a stable value of the Kwanza. Currently, the currencies trades at 103 Kwanza’s per
USD. However, we have witness a in the past, namely in 2008-2009 when the oil price dropped approximately 60% between July and December 2008, a loosening of the currency peg that allows the Kwanza to depreciate against the dollar - the Kwanza depreciated close to 15% in the first 9 months of the year. Given the currently low oil prices - Brent is at $56 from $108 just 5 months ago - one must factor in the likelihood of a similar devaluation happening again. The charts to the left show how the Kwanza is yet to make a sizable devaluation to match the Brent price collapse.
However, data suggest Angola is more resilient to oil price drops than it was in 2009. I base my assumption firstly on lower oil price expectations in public budgets (budget for 2015, currently being discussed in Parliament assumes an $81-year average for the Brent vs. $98 in 20147). Secondly, the economy is more diversified, as oil sector accounts for 40% of the
6The trend has been a decrease of the payments made in USD, as the BNA have been enacting “de
-dollarization” policies in the Angolan economy since 2010; encouraging the use of Kwanza’s 0.005 0.007 0.009 0.011 0.013 0 20 40 60 80 100 120 140 Brent Kwanza/USD 0.010 0.011 0.011 0.012 0.012 0.013 0.013 0.014 0.014 0 20 40 60 80 100 120 140 160 Brent Kwanza/USD Source: Bloomberg
Chart 2– Brent Price ($) and Kwanza/USD FX rate in
’08 and ‘09
Source: Bloomberg
NOSSGPS CONVERGING THEIR WAY TO THE UPSIDE
country’s GDP, whereas it was 60% in 2008. Lastly, Angola’s FX reserves are, given last
data available, at $28bn, which according to the Deutsche Bank should cover more than 6 month of import. In 2008, they were below $20bn. Still, I factor in a scenario of a 15% cash flow devaluation, with 50% probability, as I do not have a particular view on oil prices going forward, and this depreciation was the yearly adjustment the Kwanza suffered against the dollar for a similar magnitude price drop in the Brent in 2008.
I am, however, confident that this does not hurt my buy recommendation on NOS, has even for a virtually impossible scenario of a 50% depreciation of the cash flows originating from ZAP (one in equal degree as the adjustment verified in the last 6 months in the oil price), NOS’s fair value would decrease €0.05/share compared to my base case; still with an upside to its current price comfortably in excess of 15%. Assuming a long-term growth rate of 3.5% - quite conservative given that even in 2023 Pay TV market will hardly be mature in Angola the very least due to population growth; and that inflation rate has not been below 4% since 1990. I obtained an equity valuation of ZAP of €470m. Therefore, I
value NOS’ 30% stake in ZAP at €141.1m or €0.28/share. I am also excluding from ZAP’s
valuation a project that will sure be value-creating for NOS –ZAP’s announced investment
in broadband network in Angola. I am confident it will be NPV-positive for NOS because it is exclusively financed with ZAP’s funds; and because the network investment will be
made only in selected regions of Luanda, not in a widespread manner across country, which creates room for a region-on-region appreciation of the value-creation.
Sensitivity Analysis
In this sub-section of my report I conduct a synthetic sensitivity analysis to the two most value-impacting inputs of my valuation on NOS, the weighted-average cost of capital and the long-term growth rate of my perpetuity for the terminal value.
The conclusions that this table allows to draw is that only under a scenario where the average cost of capital is above 10% and NOS grows in perpetuity at 0.5%, substantially inferior to the expected long-term inflation rate for a Euro-zone country does the target
price of NOS for the end of 2015 falls below its current price of €4.95. This evidence
further strengths my buy recommendation, as it suggests only in a scenario of very-long term stagnation for Europe and permanently high sovereign/cyclical risk associated with Portugal would NOS fail to produce a upside for its holder.
7Deutsche Bank Research
7.0% 8.0% 8.7% 9.5% 10.5% 0.5% 7.43 6.47 5.94 5.44 4.92 1.0% 7.81 6.74 6.16 5.60 5.05 1.5% 8.27 7.05 6.39 5.79 5.19 2.0% 8.82 7.41 6.68 6.00 5.34 2.5% 9.48 7.84 7.00 6.25 5.52 Table 7– Sensitivity analysis for the WACC and long term g
Source: NOVASBE Research
NOSSGPS CONVERGING THEIR WAY TO THE UPSIDE
PAGE 10/32
Manuel Medeiros
Company overview
NOS is a cable and telecommunications company that offers Pay-Tv, broadband, fixed voice and mobile services in the Portuguese market. Its activities also include the cinema distribution and exhibition as well as content creation and sale through NOS-owned Pay-Tv channels.
Brief History
NOS’ origins date back to 2007, when the market incubent Portugal Telecom spinned-off its subsidiary PT Multimédia, which included the called TV Cabo operations and overall was the
main materalization of Portugal Telecom’s effort to implement multi-media strategies. Since its inception and renaming as Zon Multimédia in 2008 as a completely independent body from the incumbent firm that NOS has been the leader in the Pay-Tv market. It also became the first internet operator to offer broadband services to its costumers. More recently, in 2013, Zon Multimédia merged with Optimus to form Zon Optimus which was one year later re-named NOS.
Optimus was a mobile, broadband and voice operator of telecom and media company Sonaecom. When Optimus integrated Clix in 2010 it became the first operator to fully integrate all the fixed services, including Pay-Tv.
Business Units
Telco
The Telco business is the core activity of NOS. This business unit includes the Pay-TV, Internet and voice services, both fixed and mobile, offered by NOS in Portugal.
NOS offers bundles of the services above that range from duple play “NOS Dois” with Pay -Tv and 1 mobile SIM card for €29.99, to its premium offer “NOS Cinco”, priced at €79.99
since July in a promotional manner that includes not only mobile, Pay-Tv, fixed voice and broadband but also 5GB of mobile broadband. However, the offer that most likely contributed to the commercial performance of NOS in the Telco sector this past quarter was the creation of a lower pricing point convergent offer – “NOS Quatro Light”. For €49.99,
customers get a lower end Pay-Tv package (126 channels), 30 Mbps in fixed internet, unlimited fixed voice and a single SIM card. Overall, NOS has a portfolio of offers for wide range of customers, from premium to discount (distinguished by amount of channels, internet speed and number of SIM cards8).
Still, NOS’ Pay-Tv offer has some differentiation power over its competitors since the IRIS service was the first to have a “time-warp” function that automatically records the
NOSSGPS CONVERGING THEIR WAY TO THE UPSIDE
337 342 343 337 324 330 332
131 132 129
107 120 125 124 38.9% 38.5% 37.7%
31.8%
37.2% 37.8% 37.3%
-5% 5% 15% 25% 35% 45%
0 50 100 150 200 250 300 350 400
1Q13 2Q13 3Q13 4Q13 1Q14 2Q14 3Q14
Revenues EBITDA Margin
programming from the past 7 days. NOS’ IRIS and Kanguru (Optimus mobile broadband
service prior to the merger) were also awarded product of the year in their categories by an independent entity.
NOS had, as of 3Q14, approx. 300 thousand convergent customers, representing already 24% of its Pay-TV subs. As for mobile, NOS has approx. 3.5 million subscribers.
Note however that the Telco business unit includes the business segment as well, both for small and medium enterprises and for large corporate accounts. Business RGUs as a whole grew over 6% on year-on-year basis in 3Q14, totalling 1023 thousands RGUs. This can be mostly attributed to a higher commercial spending on this front, a better integrated offer and an increasing geographic coverage. As far as large corporate clients are concern, as I mentioned in my 3Q results preview and post-view, NOS has made a considerable progress by snatching from the incumbent Portugal Telecom the larger accounts in the market –
Caixa Geral de Depósitos, BPI and the Ministry of Health are some examples of NOS achievement in this sector. In a further section of this report I discuss the profitability
potential impact of these contract on NOS’ financial performance. The graph below summarizes this business unit in the past quarters.
As shown above, in most recent quarters NOS has struggled with revenue growth, essentially due to the aggressive pricing by Vodafone in its fixed bundle offers. However, as NOS becomes increasingly more integrated, the EBITDA erosion effect has been mitigated in the last 2 quarters. The numbers that better illustrate NOS commercial rebound is the decrease in Pay-Tv customer losses, as well as the gain in market share in mobile services in 2014. Overall, these provides a better outlook going forward, as NOS convergent offer is paying off.
Chart 4– Telco Business Unit quarterly Revenues, EBITDA (€m) and Margin (%)
Vodafone’s aggressive
pricing hurt NOS Telco
performance…
NOS has 300k convergent customers in 3P&4P offers
And over 1 million business RGUs
NOSSGPS CONVERGING THEIR WAY TO THE UPSIDE
PAGE 12/32
Manuel Medeiros
Cinema and Audiovisuals
The cinema and audio-visuals business unit includes the cinema exhibition and distribution in Portugal, Spain and Mozambique; the sale of Pay-Tv and video-on-demand content rights.
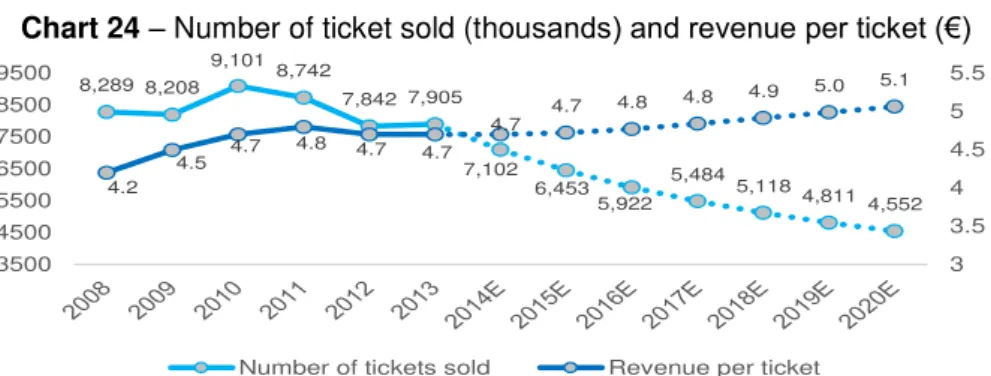
Currently, NOS has a 63% share of box office revenues in Portugal, according to the Portuguese Institute for Cinema and Audiovisuals, selling close 2 million tickets in 3Q14 at
an average revenue per ticket of €4.7. NOS cinema exhibition segment has now 214
screens in total, with the addition 5 screens in Forum Algarve. Noteworthy is also the opening of the first IMAX screens in NOS cinema in 2Q13, which has 148k customers to date. Still, this is a segment in clear decline with revenues falling 20% on year-on-year basis in 3Q14. As for the audiovisuals segment, NOS has a home video market share of 59% and 57% for the cinema distribution. The leadership NOS holds in the cinema distribution market is further illustrated by NOS having distributed 6 out of the 10 most successful screenings in 3Q14. Also, the movie & series channels that NOS offers as a content seller have over 500k subscribers, 60% of which in Africa. The audiovisuals segment was flat this quarter, continuing this no-growth trend already exhibited in past quarters. The table below summarizes the recent performance of this unit. The company attributes the 20% y-o-y decline this past quarter to the absence of blockbusters - in 3Q13
the movie “The Gilded Cage” was being displayed. This movie was a great success,
selling over 2x times the tickets sold on 3Q14 most viewed movie, “Lucy”. Yet this is evidence of a structural decline in this sector as I will showcase in our market overview section below. Also, if we take into account the volume added from the 5 new screens added, then total ticket sales actually declined 25% y-o-y in 3Q14.
… But there is evidence
of commercial rebound in 2014
10.1 12.8 22.1 27.4 26.4 22.7 8.9
-57.6 -59.9
28.3 -9.5 26.5 100.5
138.1
-100 -50 0 50 100 150
1Q13 2Q13 3Q13 4Q13 1Q14 2Q14 3Q14
Pay-Tv Net Losses Mobile Net Adds
NOS Cinema exhibition revenues declined 20% Y-o-Y in 3Q14
26.7 26.5
29.8 30.6
24.9 24.9 26.8
7 8.8
10.5 10.9 9.5
8.8 9.6 26%
33% 35% 36%
38% 35% 36%
-5% 5% 15% 25% 35% 45%
0 5 10 15 20 25 30 35
1Q13 2Q13 3Q13 4Q13 1Q14 2Q14 3Q14
Revenues EBITDA Margin
Chart 5– Pay-Tv Net Losses and Mobile Net Additions, in thousands of subscribers
Source: Company Information
Chart 6– Audiovisuals Business Unit quarterly Revenues, EBITDA (€m) and Margin (%)
NOSSGPS CONVERGING THEIR WAY TO THE UPSIDE
Shareholder structure
The most prominent shareholder is the ZOPT holding that owns a majority stake of 50.01%. ZOPT is a qualified holding that resulted from an agreement of its three controlling shareholders, Kento Holding Limited, Unitel International Holdings, both directly controlled by Mrs. Isabel dos Santos, and Sonaecom at the time of the Zon-Optimus merger. Therefore, Sonaecom holds an indirect share of 25% in NOS, along with a direct stake of 2.14%. The other reference shareholder currently holding a qualified stake in NOS is BPI, with 4.52% voting rights. The following summarizes the main stakes in the company.
H H
Here it is also important to highlight the recent reduction in stakes by historically important shareholders for the company. In the past weeks, Controlinveste reduced its stake in NOS from 2.90% to 1.36%, having sold over 4.7 million shares. This is quite relevant because these shares are attributable to Joaquin Oliveira, a reference shareholder and board member not only for NOS but overall a major stakeholder in the Portuguese Pay-Tv business as a whole. This disposal of shares are in my view positive because the shares owned by
Controlinveste created an overhang risk for NOS’ shares, as the intention by Mr. Oliveira to reduce his stake in NOS was fairly known in the market. The same risk was present in Joe
Berardo’s stake, which he disposed of last summer, another very relevant shareholder in company’s history. I believe that these two disposals have been contributing to the positive
performance of NOS shares this past weeks, since they face a much lower overhang risk.
50.01%
4.52% 2.14%
2.02% 1.36%
39.95%
ZOPT SGPS SA
Banco BPI, SA
Sonaemcom SGPS, SA
Morgan Stanley
Controlinveste
Free Float
Chart 7 – NOS’ Shareholder Structure (1)
Source: ANACOM; NOVASBE Research
NOSSGPS CONVERGING THEIR WAY TO THE UPSIDE
PAGE 14/32
Manuel Medeiros
The Sector
Market Overview
The telecommunications market has experienced a significant reduction in the past years, going from a €7.56bn market in 2009 to a €6.27bn market in 20139, which translates into a compounded annual growth rate (CAGR) of -3.7% across that period. This is a particularly negative picture if we consider the telecommunications market fell at a faster rate than the GDP, which had a -1.5% CAGR for the same period, making the telecommunications sector weight in the GDP decrease. Yet, according to ANACOM, approximately a third of the decrease in the telcom market was due to regulatory reasons, that is, difference in what counts as telecommunications expenditure. However, that would yield a net CAGR of -2.4% for the sector, which is still worse than the performance for the economy as a whole. The following table summarizes the context described above as well as my forecasts.
9 ANACOM
Chart 9– Telecommunication Expenditure as % of GDP in 2013
Source: Eurostat 7.56 7.60
6.53 6.62 6.27
6.08 5.93 5.79 5.65 5.53 5.40 5.28 4.5% 4.4%
3.7%3.9%3.7%
3.5% 3.4%
3.2% 3.1%
3.0% 2.9%2.8%
2.00% 2.50% 3.00% 3.50% 4.00% 4.50% 5.00%
2.0 3.0 4.0 5.0 6.0 7.0 8.0
Telecom Market (EURbn) as % of GDP
Source: ANACOM; NOVASBE Research
NOSSGPS CONVERGING THEIR WAY TO THE UPSIDE
2127 2243 2391 2563 3547 3635 3676 3680
0 1000 2000 3000 4000
2010 2011 2012 2013
Fixed Broadband access (k) Fixed Voice (k)
Going forward, I expect the telecom to continue its downward trend, although at a much less steep rate than in past years, dependent on overall economic recovery. My belief stems from the fact that the more developed economies in the EU, have lower figures for telecom expenditure as % of GDP than Portugal, as shown in the following table. We can see that for instance, Spain, France and Italy, already in 2010 had fallen below the 3% threshold. And looking at the richer economies, the Scandinavian countries, for example, they actually are around the 2% mark. Therefore I believe the trend for the not-as-developed players in the EU, such as Portugal, is to see that weight of telecom expenditures in GDP decreasing. Overall, that would translate in a Portuguese telecom market experiencing a decrease of roughly 2% CAGR for the 14-20E period.
On a more bottom-up approach, however, there are still some opportunities for a telco carrier to grow in Portugal, at least in terms of subscribers. In terms of fixed broadband penetration, for example, there has been a significant increase in subscribers in the Portuguese market - between 2008 and 2013, fixed broadband subscribers registered an 8.6% CAGR, as shown on the left. And, looking at a European picture, penetration of fixed access to broadband still lags behind not only main European players and the EU-27 average considerably, but also peripheral economy peers. Greece is the only from selected countries that had a lower Pay-Tv penetration. This suggests that telecom operators in Portugal may continue to benefit from this increase in subscribers. Regarding Pay-Tv, the Portuguese market has also been experiencing growth in terms of subscribers. Since 2008, Pay-Tv subscribers grew at a 7.2% compounded annual growth rate.
Note however, that although Portugal Telecom is the telecom incumbent in the Portuguese market, NOS origins are TV Cabo, which at the time was the only Pay-Tv subscriber. Thus, NOS is the historically leader in this market, where it has a 45% market share as of this 3Q14, according to ANACOM. Therefore, this increase in size of the market does not benefit NOS directly, and its focus should be more on up-scaling Pay-Tv subscribers to higher priced bundles for increase Pay-Tv subscribers in terms of volume, as elaborate in later stages of this report.
As far as mobile sector is concerned, the penetration rate in Portugal are very high – according to Eurostat, Portugal as more than 1.5 mobile SIM card per inhabitant since 2010, but it continues to grow at approx. 1.7% annual rate in the past 3 years. Seen as they are already much more SIM cards that habitants, there is not growth opportunity in terms of volume for this sector.
2244 2487
2733 2936
3122 3171
0 500 1000 1500 2000 2500 3000 3500
2008 2009 2010 2011 2012 2013
Pay-Tv Subscribers
Chart 11– Pay-Tv Subscribers in Portugal (thousands)
Source: ANACOM
Chart 10– Portugal Fixed BB
and Voice users (thousands)
NOSSGPS CONVERGING THEIR WAY TO THE UPSIDE
PAGE 16/32
Manuel Medeiros
In spite of that, there is a more relevant trend in the mobile market according to ANACOM. That is the increasing preference of consumers for pre-paid “all-you-can-eat” contracts, with
free calls and messages and higher levels of internet data. Pre-paid contracts were 29% of consumer mobile services in 3Q13 vs. 40% in 3Q14. Therefore, this represents an opposing force to the pricing pressure from Vodafone that could potentially drive ARPU down.
Also, it is important to mention that there has been a significant chance in the way the Pay-Tv service arrives at consumer’s homes. Cable and satellite and loosing subscribers, and being
increasingly substituted by fiber (FTTH, or fiber-to-the-technology). For example, this past quarter, subscribers for Cable and satellite decreased -2.9% and -5.8% on a year-on-year, respectively; whereas DSL and Fibre grew 11.2% and 29.8%, respectively. As of 3Q14, Fibre already represented 17.8% of total Pay-Tv subscriptions. The graph above better illustrates this trend.
All in all, telecommunication sector in Portugal should experience modest decrease rates going forward, even under the assumption that the recovery in the economy as a whole is verified. Still, there are particular sectors, namely fixed and mobile broadband, where there is still room to grow in volume. Clearly, NOS financial performance will not be driven by an overall sector expansion. I believe NOS story going forward is more an issue of who better addresses the convergence trend in the market. According to ANACOM, in 5 years, convergence should represent over 30% of the telecom market, therefore leadership in convergence will most likely define a new market leader in this sector.
75% 43% 24% 19% 16% 1% 22% 0% 10% 20% 30% 40% 50% 60% 70% 80% 1Q 08 2Q 08 3Q 08 4Q 08 1Q 09 2Q 09 3Q 09 4Q 09 1Q 10 2Q 10 3Q 10 4Q 10 1Q 11 2Q 11 3Q 11 4Q 11 1Q 12 2Q 12 3Q 12 4Q 12 1Q 13 2Q 13 3Q 13 4Q 13 1Q 14
ADSL Cable Fibre xDLS
Chart 12– Pay-Tv Access Technology (weight on total subscribers, %)
NOSSGPS CONVERGING THEIR WAY TO THE UPSIDE
30.5%
54.9% 8.8%
5.3% 0.5%
NOS PT Vodafone Cabovisão Others
37.8%
46.3% 10.0%
5.8%
NOS PT Vodafone Cabovisão Others
44.5%
42.1% 6.7%
6.5% 0.2%
NOS PT Vodafone Cabovisão Others 34.8%
49.3% 9.8%
5.8% 0.3%
NOS PT Vodafone Cabovisão Others
Competition
NOS origins go back to once monopolist TV Cabo in the Pay-Tv segment, so naturally NOS is the dominant player in that market with a market share of 44.5%. However, in the recent segments for Fixed Voice and Broadband, the incumbent Portugal Telecom and its MEO-named services take the leadership as shown below. Note that all the market shares below are as of 3Q14 according to ANACOM.
However, going forward, I believe that the most important market share to look at, is the one referent to bundle offers, as the trend in this market is to observe an increasing convergent offer (300k subscribers increase from 3Q13 to 3Q14). In graph to the left I show market shares for the bundles offers together (from 2 play to quintuple play). The incumbent once again takes the lead, but here it is also important to mention that PT was the first one to launch triple play and quadruple play offers (M4O), the latter in January 2013. At the time, the offer was clearly the most competitive in the market, and it translated into 172k convergent subscriptions in its first 7 months of activity, 40% of which were new customers.
In terms of pricing, there is clear distinction in the triple play bundle offering Pay-Tv, Broadband and Fixed Voice. On one side, the two players who have been in these markets the longest (Pay-Tv, BB and Fixed Voice), PT (MEO) and NOS; and on the other side the companies which are still trying to gain scale, Vodafone and Altice-owned Cabovisão. The former price the
mentioned triple play bundle at €39.99 during the first 24 months of their contract, whereas the
latter priced them at respectively €25.99 and €24.99. Notice however that the length of that pricing offer for Cabovisão is only 6 months, as opposed to the 24 month length its competitors
practice. This represents a 35% cheaper service offered by Vodafone.
Vodafone’s (and Cabovisão’s) should not be interpreted, however, as an attempt to make overall prices go down via a war price. As identified above, there is a strong trend in the market towards convergence (offering all services, mobile and fixed, under a bundle). Looking
at Vodafone’s client structure as illustrated above, there is a significant imbalance between mobile customers and fixed customers for Vodafone – market shares above provided by
Chart 13 – Market share in Portuguese Fixed Voice
Chart 16– Market Share in bundle offerings in Portugal, %
Source: ANACOM
Chart 15 – Market share in Portuguese Pay-Tv Chart 14 – Market share in Portuguese Broadband
Source: ANACOM Source: ANACOM Source: ANACOM
Chart 17– Market Share in mobile service, %
NOSSGPS CONVERGING THEIR WAY TO THE UPSIDE
PAGE 18/32
Manuel Medeiros
ANACOM translate that bundle clients are only 5% of mobile customers for Vodafone, vs. 17% for Portugal Telecom and 39% for NOS. Market share in bundle offerings stated above on its
own illustrates Vodafone’s weakness in this sector. This constitutes a disadvantage to Vodafone, as it is a smaller player in the service to which the market should converge to in the future (bundle subscribers grew 10% y-o-y in 3Q14). Therefore, I believe Vodafone should only keep this aggressive pricing until it reaches a number of subscribers or market share (how many/much is the million dollar question) in this service that makes it a stronger player in the bundle market as well. Especially because, as I illustrate in the “Revenues – enjoying
convergence” section of this report, Vodafone’s pricing is unviable for a triple play bundle.
Still, Vodafone has, in December 1st 2014, introduced a caveat in their pricing. In order to take advantage of the 7-day automatic rewind service (called time-warp), a customer needs to pay
an additional €4 a month for the rental of the set-top box that has that functionality. Thus, in order to enjoy the same services as a given customer would in MEO or NOS, a Vodafone
customer as to pay now €30.99. This reduces the price difference from 35% to 23%. Still a material difference for the average Portuguese household. This adds up to the €1 increase in their headline price from €24.99 registered in July. Overall, in less than 6 months Vodafone
offers the same services for €5 more, which can give some indication of future change to the actual headline price. I elaborate on the feasibility of Vodafone’s pricing in the section
“Revenues –enjoying convergence” section of this report. In the other bundled offerings, that further include mobile services and mobile broadband, the pricing is very much in line across competitors. There are changes however in the number of channels and high-definition channels included in the packages as well as internet speed. The table below summarizes the pricing picture for the sector.
M
M&A Context
Portuguese Telecom has been a very active sector in terms of deal flow this recent years. Following the Cabovisão-Oni deal and the Zon-Optimus merger in 2013, we have seen
currently an intense speculation and concrete bids for Portugal Telecom’s business (which is
currently an asset of Oi). Recently, there has been a breakthrough – Oi announced it accepted
Altice’s bid for PT on December 5th, leaving the Apax/Bain consortium out of the race.
In my perspective, this news should have a positive read across for NOS. Assuming the
regulator approves Altice’s purchase of Portugal Telecom, we would see a shift in the
competitive landscape of the Portuguese telecom market, as the number of player would go
Bundle/Operator NOS MEO (PT) Vodafone Cabovisão
Triple Play ( TV+ Broadband + Fixed Voice) € 39.99 € 39.99 €25.99 (1) €24.99 (2)
Quadruple Play € 49.99 € 49.99 € 49.80
-Quadruple Play (2 SIM cards) € 59.99 € 59.99 € 59.70 -Quintuple Play (4P + Mobile BB) € 79.90 € 79.99 -
Table 8–Bundle Pricing for each operator, in €/month, as of December 1st
Source: ANACOM
NOSSGPS CONVERGING THEIR WAY TO THE UPSIDE
down from 4 to 3. This should prove positive for NOS as it strengths the likelihood of Vodafone easing its aggressive pricing policy in the near future as competitive pressure decreases. As I further elaborate below, the easing of pricing by Vodafone after 2015 is a key assumption implicit in my BUY recommendation and the Altice bid does make it more likely in my view. Especially in the scenario that is considered more likely by market participants – a regulatory enforcement of Altice to sell Cabovisão to Vodafone. As I argued in the sub-section
“Competition” above, Vodafone needs scale in order to forgo its aggressive pricing. If it were to add Cabovisão’s customers, Vodafone would be closer to a subscriber base comfortable enough to a profit-making pricing - 14.1% share in pay-tv; 15.6% in fixed voice and 15.8% in broadband. Still, I consider that any outcome from Altice/PT deal is positive for NOS when compared to the competing bid of the private equity consortium by Apax/Bain were to win, the picture would be different as you still keep a market with four players and thus the same competitive landscape in the sector.
Note however, due to the mentioned above or any other caveat imposed on the deal by the regulator, it should take at least 6 months for the deal to go through. For instances, Optimus/Zon deal had less overlap, as the first was essentially a mobile operator and the second an essentially fixed one and there were still regulatory interventions, especially as far as the network was concerned (Optimus was forced to honour its deal with Vodafone). The PT/Cabovisão deal has a higher overlap in terms of services – together, PT and Cabovisão would have 60.2% share in fixed voice, 55.2% in Pay-Tv; 52.1% in bundles and 48.6% in broadband. Thus, we should expect the deal to go through before July 2015.
On a parallel note, although closely related, there is the bid of Mrs. Isabel dos Santos, via the Terra Peregrin holding, to buy PT SGPS that is quoted in the Portuguese Stock Exchange. Before further developing this subject, it is relevant to make a distinction – PT SGPS, the company listed on PSI20 is a company which is not the same as the actual Portugal Telecom, Portuguese telcom market incumbent. The latter is at this stage viewed as a business unit of Oi (or the ex-future Corp Co.), whereas the former is simply a company with a 25.6% stake in Oi, awarded once the merger terms were renegotiated and the Rio Forte debt10, the precise security that lead to that re-negotiation of the terms of the merger. In that sense, what Mrs. Dos Santos is doing in practice is bidding for a 25.6% stake in Oi, and a possibility to prevent Oi to sell Portugal Telecom. Mrs. Dos Santos imposed a series of contingencies in her bid, being the main ones that PT SGPS would see its capital in the new merged company increase 10% and also that Oi would stop its asset disposal program, involving the sale of the Portugal Telecom business and the stake in Unitel, an African Telecom company. However, as of last December 23rd, Mrs. Isabel dos Santos has withdrawn her offer for PT SGPS. The withdrawal
was on back of the request by Portuguese securities’ regulator CMVM that Mrs. Dos Santos
should match her offer with the last 6 months VWAP11, €1.94. The bid stood at the time at
€1.36, and Mrs. Dos Santos decided to withdraw her offer.
10Rio Forte Debt refers to a approx. €900m debt that PT contracted with the Rio Forte
company/holding, a member of the failing Espírito Santo Group
11 Volume weighted average price
Pay-Tv Fixed Voice Broadband
NOS
30.5%
34.8%
37.8%
Altice
54.8%
49.3%
46.3%
VOD + CBV 14.1%
15.6%
15.8%
Table 9–Market Share per segment (%) if Altice wins and is forced to sell Cabovisão to VODNOSSGPS CONVERGING THEIR WAY TO THE UPSIDE
PAGE 20/32
Manuel Medeiros
Comparables
Presently, there is a scarcity of comparable firms for NOS that operate in the same market. Altice is publicly traded but there are no multiples exclusive to its Portuguese assets, and the same story goes for Vodafone. And PT, as explained in the section above, is listed but it is holding-like company that controls 25.6% of Oi. Thus, and it should not be valued according to what it does not include, Portugal Telecom’s Portuguese business. Therefore I take instead comparables across Europe to provide a better comparison.
Note, however, that NOS lies somewhere in the middle of what are considered (and valued
as) Cable companies and Telecom Carriers. In the sense there are the firms that have the
network that make broadband and TV arrive to each people’s house, firms like Ziggo or Kable
Deutschland; and then there the classical Telco Carriers that provide mobile and fixed voice services. The issue here is that NOS is a mix of both, even more so since the Zon-Optimus merger. Although there has been a trend towards convergence on both sides in Europe as well, there are still relevant discrepancies. Therefore, in order to create a really comparable market multiple for NOS I created an equally weighted blended multiple between cable
companies and Telco’s. The figures for all companies other than NOS are based on Bloomberg consensus.
As it is observable, NOS trades at a considerable discount both in Price-to-Earnings and EV/EBITDA. Still, I would be reluctant to call out the cheap valuation of NOS. Firstly, NOS suffers from a Portuguese market discount – less coverage, less liquidity and ultimately a discount give the recent events in the economy such as the Espirito Santo Group ruin. Secondly, the discount is justified when you look at nearer-term growth expected for NOS vs. the blended compositor. NOS EBITDA compounded annual growth for 15E-16E is 3% vs. Table 10 –NOS Comparable Multiples Analysis [Prices as of January 6th]
Source: Bloomberg; NOVASBE Research
Last Market Cap EPS CAGR EBITDA CAGR Div Yield
Com pany Price EURm 2015e 2016e 15e-16e 2015e 2016e 15e-16e 2015E
Cable
Kabel Deutschland 112.2 9,930 39.1 30.9 26% 13.5 12.1 9% 3%
Ziggo 38.5 7,713 22.462 21.6 4% 1139% 10.8 3% 5%
Altice 61.2 15,148 593.7 92.7 541% 745% 7.0 9% 0%
Numericable 37.9 18,464 39.5 29.6 34% 11.4 11.0 1% 1%
Cable Median 39.3 30.2 30% 11.4 10.9 6% 2%
Telco
Telefonica 11.37 52,952.4 12.9 12.3 5% 5.9 5.7 3% 6%
Telecom Italia 0.8575 15,667.2 12.1 11.9 1% 5.0 4.7 -1% 2%
Orange 13.37 35,415.6 13.9 13.4 4% 5.3 5.2 0% 5%
Jazztel 12.58 3,227.7 30.5 21.1 44% 12.9 10.2 24% 0%
Iliad 193.8 11,323.7 27.4 21.6 27% 8.2 7.0 14% 0%
Telco Median 13.9 13.4 4.9% 5.9 5.7 8% 3%
Blended Multiple 26.6 21.8 17% 8.7 8.3 7% 2%
NOS 4.95 2535 18.8 17.1 10% 6.4 6.2 3% 2%
Premium/Discount -29% -22% -26% -25%
NOSSGPS CONVERGING THEIR WAY TO THE UPSIDE
Source: Bloomberg Source: Bloomberg
(1) ZON Multimédia prior to ZONOP/NOS Stock
blended of 7%. As far as EPS growth is concerned, difference is equally significant 17% in blended composite vs. 10% for NOS.
This proves to be more reasonable if we simply focus on the Telco companies. Looking at the latter, NOS actually trades at an 8.5% premium on EV/EBITDA 15E, despite higher growth prospects for the denominator. In the case of P/E, NOS does trade at a premium against the Telco carrier composite selected, but it seems to be justified on the back of higher expected EPS growth. Therefore, multiple wise, NOS is not far from being fairly priced. The issue is here is the lack of truly comparable firms – the Portuguese market is not represented on the comparables; and most firms are not a fully convergent company across mobile, broadband, Pay TV and fixed voice as NOS is since the merger. Thus, multiple valuation is rather limited in this case.
Alternatively, we can look at the historical multiples of Zon (only Zon-Optimus since the 3Q13) and assess whether the stock it at a reasonable entry point or not. What we may conclude when looking for a 3-year period is that the stock is expensive, given it is 23% above its average EV/EBITDA for the period and 19% above its average P/E. However, this is ignoring the shift from a more cable-like company, seen also as a distributor of content; to a fully convergent player once the merger took place, offering both mobile and fixed services. This is evidence by that fact that if only consider multiples since the time of the merger approval, September 4th 2013, then its only 1% above its average P/E and actually 8% above its average EV/EBITDA, and most of this was gain in the last two weeks where the stock show
considerable resilience when compared with the market’s performance. Therefore, we can
conclude that from a multiple stand point, NOS is somewhat fairly priced.
Chart 18– NOS Multiples in the last 3 years (1) Chart 17– NOS Multiples since September 2013 (Merger)
PER average: 23.40 Last PER 23.13
EV/EBITDA Average: 6.35 Last EV/EBITDA: 6.67 3 4 5 6 7 8 9 5x 10x 15x 20x 25x 30x S ep -1 3 O ct -1 3 N ov -1 3 D ec -1 3 Ja n-14 F eb-14 Mar -1 4 A pr -1 4 Ma y-14 Ju n-14 Ju l-1 4 A ug -1 4 S ep -1 4 Oc t-14 N ov -1 4 PER EV/EBITDA
Last PER: 23.13 PER Average:19.46
Last EV/EBITDA: 6.67 Average EV/EBITDA 5.39
NOSSGPS CONVERGING THEIR WAY TO THE UPSIDE
PAGE 22/32
Manuel Medeiros Source: ANACOM; Company Information
Financial Forecasts
Revenues
–
enjoying convergence
Consumer Telco
I believe that NOS will continue to benefit from its success in placing its convergent
quadruple play offer in the market, despite Vodafone’s aggressive pricing. Firstly because there is evidence that NOS is performing better in its convergent offer in most recent quarters, as I illustrated in a graph above – Pay-Tv have decrease significantly in past two quarters, and Mobile net additions have increase from negative in 4Q13, to over 138k in just 3 quarters. This figure translated into a 70 bp basis point gain in overall mobile
subscribers’ market share according to ANACOM.
Source: Company Data
Also, mobile portability request in favour of NOS have been net positive al throughout 2014, as shown on the figure to the left, which means there is a taking-up of the quadruple play bundle.
As I explained in the market overview section, the telecom market is not in for a growth story going forward in Portugal. Therefore, the issue here is who will emerge as a dominant player as the market shows a clearly trend towards convergence. Although Vodafone is
making considerable progress in terms of subscribers due to its pricing (€25.99 for its
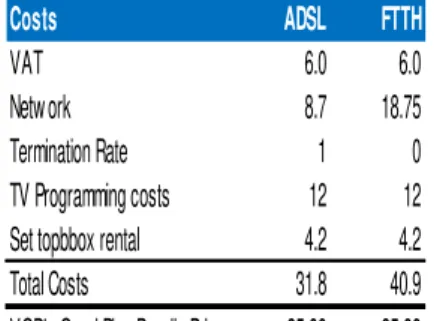
quadruple play bundle, recently increased from €24.99) I estimate that Vodafone actually loses money in each new customer they earn at that price.
The network payment under ADSL is regulated by ANACOM and makes Vodafone pay PT
for the use of its network €8.7 per household, whereas for Fibre (FTTH, that is, Fibre-to-the-home) it is Vodafone which has to incur in the investment – not only the fibre cabling to get to a certain area but then also the OTH equipment needed to make the fibre reach the floors above ground, which I estimate to add up to €450 per customer, divided by the
24 month duration of the contract I arrive to the €18.75 on the following table. Although the
Chart 19– Pay-Tv Net Losses and Mobile Net Adds (Thousand subscribers)
Chart 20– Net Mobile Number Portability (Thousands/Week)
10.1 12.8 22.1 27.4 26.4 22.7 8.9
-57.6 -59.9
28.3 -9.5 26.5 100.5
138.1
-100 -50 0 50 100 150
1Q13 2Q13 3Q13 4Q13 1Q14 2Q14 3Q14
NOSSGPS CONVERGING THEIR WAY TO THE UPSIDE
Source: NOS; NOVASBE Research Source: ANACOM; NOVASBE Research
fiber represents an investment that is then reusable for possible extension of the contract, unlike the network rent to be paid to PT, it must be made upfront, therefore takes a more
material toll in Vodafone’s cash flows than the latter. Also, programming costs are the
content and setting costs for the channels given on a quad play bundle to a customer. The number I came up with is on the low range of NOS’ estimations of said costs. For
Vodafone, the number is likely significantly higher because Vodafone should have a lower bargaining power on this end, since it is only approximately 150k fixed customers. Lastly, there are termination fees on the case of the ADSL network, but for both cases one must consider also the rental of set top boxes (which Vodafone offers in its contract) which should account for at least €4.2 per customer. Overall, a broad picture for Vodafone’s
triple play bundle cost structure is explicit on the figure to the right.
Overall, we have that Vodafone actually loses almost €6 on every new customer served via ADSL and close to €15 via FTTH. This is a rough estimate but excludes other material
costs such as sales commissions or incremental costs for call centres (more customers, more calls, and higher headcount) so I am confident of the conclusion that this pricing is not viable for Vodafone, regardless of the euro-large margin for error. Also, there has been further evidence of the indication that Vodafone will increase its headline price from
the current €25.99. Vodafone recently introduced a caveat into its pricing, where in order
to enjoy the 7-day time-warp service, you must pay separately the rental of the set-top box that allows that function, costing €4/month. If you add that to the price 1€ price increase verified in July, it fair to argue that Vodafone charges €5 more for the same services than
it did 6 months ago. This supports my case of a headline normalization after 2015.
Therefore, I consider that Vodafone will not be able to practice this price at beyond 2015. Even if customers stay locked in these terms for 2 years for the quadruple play bundle, from 2017 onwards the competitive landscape should change. This translate into my projections of a loss in Pay-Tv market share by NOS until 2017, at increasing smaller rates given the trend already demonstrated in chart 15, but afterwards a stabilization of the same. The same reasoning can be applied to the implied ARPU on fixed customers. Once competitive pressure eases, NOS ARPU on each fixed subscriber may revert its trend and conservatively grow at the expected inflation rate.
Even throughout the coming two years, in a context of loss of market share in the Pay-Tv market, because NOS is the Pay-Tv leader a current market share of 45.3% it still as a considerable base of customers for which it can up-sell towards fixed and mobile bundles. Table 11– Vodafone Fixed
Service Bundle Cost Structure,
€
25.4 25.9 21.3
19.9 19.3 18.7 18.1 18.4 18.7 19.1
0.0 5.0 10.0 15.0 20.0 25.0 30.0
Costs
ADSL
FTTH
VAT
6.0
6.0
Network
8.7
18.75
Termination Rate
1
0
TV Programming costs
12
12
Set topbbox rental
4.2
4.2
Total Costs
31.8
40.9
VOD's Quad Play Bundle Price
25.99
25.99
Chart 21– Pay-Tv Market Share, % Chart 22– ARPU per Fixed Customer,
€ 72%
64% 57%
53% 50% 48% 45%
42% 39%36% 36% 36% 36%
0% 10% 20% 30% 40% 50% 60% 70% 80%

![Table 10 – NOS Comparable Multiples Analysis [Prices as of January 6 th ]](https://thumb-eu.123doks.com/thumbv2/123dok_br/15736678.635425/20.892.181.884.612.983/table-nos-comparable-multiples-analysis-prices-january-th.webp)