ACPD
15, 27087–27136, 2015NOx control over
ammonium nitrate
S. E. Pusede et al.
Title Page
Abstract Introduction
Conclusions References
Tables Figures
◭ ◮
◭ ◮
Back Close
Full Screen / Esc
Printer-friendly Version
Interactive Discussion
Discussion
P
a
per
|
Discussion
P
a
per
|
Discussion
P
a
per
|
Discussion
P
a
per
|
Atmos. Chem. Phys. Discuss., 15, 27087–27136, 2015 www.atmos-chem-phys-discuss.net/15/27087/2015/ doi:10.5194/acpd-15-27087-2015
© Author(s) 2015. CC Attribution 3.0 License.
This discussion paper is/has been under review for the journal Atmospheric Chemistry and Physics (ACP). Please refer to the corresponding final paper in ACP if available.
On the e
ff
ectiveness of nitrogen oxide
reductions as a control over ammonium
nitrate aerosol
S. E. Pusede1,a, K. C. Duffey1, A. A. Shusterman1, A. Saleh1, J. L. Laughner1, P. J. Wooldridge1, Q. Zhang2, C. L. Parworth2, H. Kim3, S. L. Capps4, L. C. Valin5, C. D. Cappa6, A. Fried7, J. Walega7, J. B. Nowak8, R. M. Hoff9, T. A. Berkoff10, A. J. Beyersdorf10, J. Olson10, J. H. Crawford10, and R. C. Cohen1,11
1
Department of Chemistry, University of California Berkeley, Berkeley, CA, 94720, USA
2
Department of Environmental Toxicology, University of California at Davis, Davis, CA, 95616, USA
3
Center for Environment, Health and Welfare Research, Korea Institute of Science and Technology, Seoul, Korea
4
Department of Mechanical Engineering, University of Colorado Boulder, Boulder, CO, 80309, USA
5
Lamont-Doherty Earth Observatory, Columbia University, Palisades, NY, 10964, USA
6
Department of Civil and Environmental Engineering, University of California at Davis, Davis, CA, 95616, USA
7
Institute of Arctic and Alpine Research, University of Colorado, Boulder, CO, 80309, USA
ACPD
15, 27087–27136, 2015NOx control over
ammonium nitrate
S. E. Pusede et al.
Title Page
Abstract Introduction
Conclusions References
Tables Figures
◭ ◮
◭ ◮
Back Close
Full Screen / Esc
Printer-friendly Version
Interactive Discussion
Discussion
P
a
per
|
Discussion
P
a
per
|
Discussion
P
a
per
|
Discussion
P
a
per
|
8
Aerodyne Research, Inc., Billerica, MA, 01821, USA
9
Department of Physics, University of Maryland Baltimore County, Baltimore, MD, 21250, USA
10
NASA Langley Research Center, Hampton, VA, 23681, USA
11
Department of Earth and Planetary Science, University of California Berkeley, Berkeley, CA, 94720, USA
a
now at: Department of Environmental Sciences, University of Virginia, Charlottesville, VA, 22904, USA
Received: 23 August 2015 – Accepted: 15 September 2015 – Published: 7 October 2015
Correspondence to: R. C. Cohen ([email protected])
ACPD
15, 27087–27136, 2015NOx control over
ammonium nitrate
S. E. Pusede et al.
Title Page
Abstract Introduction
Conclusions References
Tables Figures
◭ ◮
◭ ◮
Back Close
Full Screen / Esc
Printer-friendly Version
Interactive Discussion
Discussion
P
a
per
|
Discussion
P
a
per
|
Discussion
P
a
per
|
Discussion
P
a
per
|
Abstract
Nitrogen oxides (NOx) have fallen steadily across the US over the last fifteen years. At the same time, due to patterns diesel truck activities, NOx concentrations decrease on weekends relative to weekdays, largely without co-occurring changes in other gas-phase emissions. These trends taken together provide two independent constraints on 5
the role of NOx in the nonlinear chemistry of atmospheric oxidation. In this context, we interpret interannual trends in wintertime ammonium nitrate (NH4NO3) in the San Joaquin Valley of California, a location with the worst aerosol pollution in the US and where a large portion of aerosol mass is NH4NO3. Here, we show that NOx reductions
have simultaneously decreased nighttime and increased daytime NH4NO3 production 10
over the last decade. We find a substantial decrease in NH4NO3 since 2000 and
con-clude that this decrease is due to reduced nitrate radical-initiated production at night in residual layers that are decoupled from fresh emissions at the surface. Further reduc-tions in NOx are imminent in California, and nationwide, and we make a quantitative
prediction of the response of NH4NO3. We show that the combination of rapid
chemi-15
cal production and efficient NH4NO3loss via deposition of gas-phase nitric acid implies high aerosol days in cities in the San Joaquin Valley air basin are responsive to local changes in NOx within those individual cities. Our calculations indicate that large de-creases in NOxin the future will not only lower wintertime NH4NO3concentrations, they will also cause a transition in the dominant NH4NO3 source from nighttime to daytime
20
chemistry.
1 Introduction
Aerosol abundances are decreasing across the US, improving air quality and affecting climate. These decreases have been broadly attributed to regulatory controls on the emissions of gas-phase precursors; however, it has proven difficult to link precursor 25
ACPD
15, 27087–27136, 2015NOx control over
ammonium nitrate
S. E. Pusede et al.
Title Page
Abstract Introduction
Conclusions References
Tables Figures
◭ ◮
◭ ◮
Back Close
Full Screen / Esc
Printer-friendly Version
Interactive Discussion
Discussion
P
a
per
|
Discussion
P
a
per
|
Discussion
P
a
per
|
Discussion
P
a
per
|
reductions to observed changes in aerosol concentration via specific chemical mecha-nisms. Thus, there is little knowledge of how impacts will scale in the future.
We present an analysis to identify driving chemical mechanisms and to quantify the effects of large reductions in nitrogen oxides (NOx) (Russell et al., 2012; McDonald et al., 2012) on secondary aerosol chemistry. We take advantage of decreased NOx
5
emissions on weekends compared to weekdays, which occur mostly without changes in other gas-phase emissions (Dallmann et al., 2012), and couple these weekday-weekend patterns to long-term NOx reductions (Pusede and Cohen, 2012). The effect
is that weekday NOx levels equal weekend NOx years earlier in the record (Fig. 1). We use this NOx constraint to interpret trends in observed wintertime ammonium ni-10
trate (NH4NO3) concentrations over the last decade in the San Joaquin Valley (SJV) of California.
The SJV experiences the most severe aerosol pollution in the US (American Lung Association, 2014). From 2001–2013 there were on average 44 exceedances each winter (November–March) of the 24 h national ambient air quality standard (NAAQS) 15
of 35 µg m−3 in Bakersfield and Fresno, with as many as 70 per winter early in the record. High aerosol in the SJV is generally limited to the winter months, with few exceedances occurring in other seasons. In the SJV, 30–80 % of wintertime aerosol mass is NH4NO3 and the remaining portion is largely organic material (Chow et al.,
2006; Chen et al., 2007; Ge et al., 2012). Characteristics of the wintertime SJV that 20
are conducive to high aerosol abundances include: shallow boundary layers (Bianco et al., 2011); prolonged periods of stagnation (Smith et al., 1981); and large emissions of NOx(NOx≡NO+NO
2), ammonia (NH3) (Goebes et al., 2003; Clarisse et al., 2010),
and organic aerosol (Ge et al., 2012). These conditions pose challenges to accurately simulating secondary aerosol in the region, as models need to represent bidirectional 25
NH3exchange (Gilliland et al., 2006; Flechard et al., 2010; Pleim et al., 2013), variable local meteorology, complex airflow, and vertical stratification in the rates of NO2
ACPD
15, 27087–27136, 2015NOx control over
ammonium nitrate
S. E. Pusede et al.
Title Page
Abstract Introduction
Conclusions References
Tables Figures
◭ ◮
◭ ◮
Back Close
Full Screen / Esc
Printer-friendly Version
Interactive Discussion
Discussion
P
a
per
|
Discussion
P
a
per
|
Discussion
P
a
per
|
Discussion
P
a
per
|
In this paper, we take an observational approach, combining the decade-long record of speciated aerosol concentrations and of gas-phase precursors in the region with detailed measurements collected during the DISCOVER-AQ experiment (Deriving In-formation on Surface Conditions from COlumn and VERtically resolved observations relevant to Air Quality, 14 January–14 February 2013). We show that wintertime NO−3, 5
which we treat as a measured surrogate for NH4NO3, has been dependent only on the
NO2concentration over the last twelve years. We calculate observationally-constrained
nighttime and photochemical NO−3 production rates and show that measured trends in wintertime NO−
3 can be explained by decreased nitrate radical-initiated production in
nocturnal residual layers, which are unmonitored layers of the atmosphere that are ef-10
fectively separated from surface emissions at night. We test the impacts of forthcoming NOx emission controls on the probability of future NAAQS exceedances, showing that NOx reductions will not only decrease the frequency of high aerosol days, but will also switch both the timing and the oxidation mechanisms that drive NH4NO3production.
2 Results from observations
15
Trends in wintertime (November–March) 24 h NO−3 vs. daytime (10 a.m.–3 p.m. LT) NO2
are shown in Fig. 2 in the cities Fresno and Bakersfield on weekdays and weekends for the period 2001–2013. The source of these observations, the methods used for collection, and measurement biases are discussed in Appendix A. Weekdays are de-fined as Tuesday–Friday and weekends are Saturday–Sunday. We expect carryover to 20
have some effect on the interpretation, as concentrations of NO2 and aerosol are not only influenced by present day processes but also have some memory of processes occurring on the preceding day, especially in the winter when surface winds are slow and disorganized and horizontal transport is weak. We exclude Monday from weekdays for this reason but retain Saturdays to improve weekend statistics. As a result, week-25
end medians reported here might be slightly higher than would be observed due to weekend emissions alone. We define the day as beginning and ending at sunrise since
ACPD
15, 27087–27136, 2015NOx control over
ammonium nitrate
S. E. Pusede et al.
Title Page
Abstract Introduction
Conclusions References
Tables Figures
◭ ◮
◭ ◮
Back Close
Full Screen / Esc
Printer-friendly Version
Interactive Discussion
Discussion
P
a
per
|
Discussion
P
a
per
|
Discussion
P
a
per
|
Discussion
P
a
per
|
nighttime NO−3 production builds from reactants present in the atmosphere during the preceding daytime hours. On any individual winter day, air stagnation and the planetary boundary layer (mixing) height are the dominant controls over gas and aerosol concen-trations; however, considering the data separately by weekday and weekend and then comparing year-to-year changes, instead draws attention to the effects of emissions 5
and subsequent chemistry.
The NO−3 mass concentration is observed to depend explicitly on the previous day’s daytime NO2 concentration, with a sensitivity of 0.5 µg m
−3
ppb−1NO2 in Fresno and
0.64 µg m−3
ppb−1
NO2in Bakersfield (slopes in Fig. 2). Since NO2has also decreased over the last decade, there is a corresponding interannual decrease in NO−3. Uncer-10
tainties in the NO−3 concentration are computed as counting errors, withN as the total number of wintertime data points (3 year average), and are±20 % on weekdays and ±30 % on weekends. Errors in NO2are computed in the same way and are less than ±9 % on weekdays and±13 % on weekends in both Fresno and Bakersfield. One ppb
NO2corresponds to 2.56 µg m−3NO−3 after oxidation (at 25◦C and 1 atm), thus the ob-15
served correlation corresponds to a decrease in NO−3 mass that is 20 % of the NO2
decrease. We interpret the positivex-intercept in Fig. 2 as consistent with the known low bias in NO−3 measurements (Appendix A) and the shorter wintertime atmospheric lifetime of NO−3 than NO2 (Sect. 4). Uncertainty estimates, including a low
measure-ment bias of 25 % NO−3, are µg m−3ppb−1NO2on weekdays and µg m −3
ppb−1NO2on
20
weekends.
The key mechanistic information observed in Fig. 2 is that present day NO−
3
concen-trations on weekdays are equal to what were observed on weekends a decade ago, i.e. the NO2dependence of NO
−
3 is unchanged with time. From this, we conclude that the
only source of NO−
3 in the atmosphere is oxidation of NO2and that agreement of NO − 3
25
in different years at identical NO2suggests there has been little change in the chemical
ACPD
15, 27087–27136, 2015NOx control over
ammonium nitrate
S. E. Pusede et al.
Title Page
Abstract Introduction
Conclusions References
Tables Figures
◭ ◮
◭ ◮
Back Close
Full Screen / Esc
Printer-friendly Version
Interactive Discussion
Discussion
P
a
per
|
Discussion
P
a
per
|
Discussion
P
a
per
|
Discussion
P
a
per
|
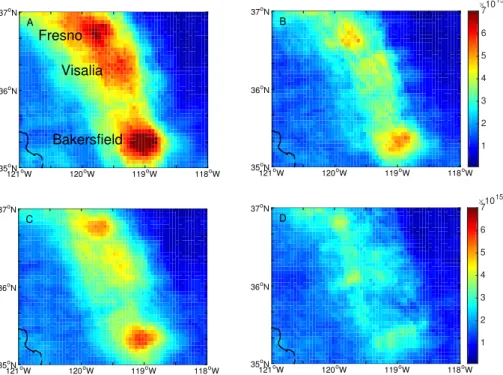
Additional insight comes from observations made during DISCOVER-AQ, in which the sum of gas-phase nitric acid and aerosol-phase NO−3 (NO−3 (g+p)) was measured onboard the NASA P-3B on six research flights with almost identical flight patterns (Fig. 3a). See Appendix A for a description of the NO−3 (g+p) measurements and for the DISCOVER-AQ experiment. A comparison of the spatial distribution of NO−
3 (g+p)
5
within the fully developed (afternoon) boundary layer (see Appendix A for the bound-ary layer filtering procedure) and that of NO2 observed from the satellite (Fig. 1) and
NOx from onboard the P3-B (Fig. 3b), suggests that NO−3 (g+p) better follows spatial patterns in NO2 than gas-phase NH3 (Fig. 3c), which is the precursor of
particulate-phase NH+4. As is evident from Fig. 3a, urban-rural gradients in NO−3 (g+p)are steep. For 10
example, in Bakersfield, NO−3 (g+p) was on average 18–20 µg m−3 near the city center, which was twice as high as just 20 km to the northeast. Also inconsistent with ob-served spatial patterns is the transport of NH4NO3from outside the central SJV.
Typi-cal daytime (10 a.m.–3 p.m. LT) winter wind speeds are∼2–3 m s−1; morning (6 a.m.–
10 a.m. LT) winds are slower at∼1–2 m s−1and nighttime winds are near zero. An air
15
parcel moving at 3 m s−1would require approximately∼20 daytime h (multiple days) to
reach Fresno from the upwind cities of Stockton or San Jose or travel from Fresno of Bakersfield.
We infer from Figs. 2 and 3 that the oxidation of locally emitted NOx is the single
largest term affecting the production of NH4NO3and that transport and mixing are too
20
slow to homogenize the aerosol throughout the wintertime SJV.
3 Chemistry in the dynamic near-surface atmosphere
Under the high NH3, low sulfur dioxide, and high aerosol surface area conditions found
in the SJV, NH4NO3 abundances are driven by NO−
3 production (PNO −
3) and
temper-ature. During the winter, it is cold enough that most NO−3 is aerosol bound in the 24 h 25
ACPD
15, 27087–27136, 2015NOx control over
ammonium nitrate
S. E. Pusede et al.
Title Page
Abstract Introduction
Conclusions References
Tables Figures
◭ ◮
◭ ◮
Back Close
Full Screen / Esc
Printer-friendly Version
Interactive Discussion
Discussion
P
a
per
|
Discussion
P
a
per
|
Discussion
P
a
per
|
Discussion
P
a
per
|
average; thus,PNO−3 is rate limiting.PNO−3 occurs by distinct nighttime and daytime mechanisms, each of which is a nonlinear function of NO2.
Nitrate radical (NO3) is the most important nighttime oxidant (Brown and Stutz,
2012). It is formed via reaction of NO2with O3(Reaction R1).
NO2+O3→NO3 (R1)
5
NO3-initiated chemistry occurs mainly at night because NO3photolyzes rapidly to NO2. After sunset, large NO emissions can titrate O3, altering the relative amounts of NO2
and O3, but conserving odd oxygen (Ox≡NO2+O3). NO3radical production is a
non-linear function of NO2 for a given O3 concentration, increasing with NO2 at low NOx, maximizing when NO2 is equal to O3 at constant Ox, and decreasing at higher NOx,
10
shown as NO2(Appendix B, Fig. B1a).
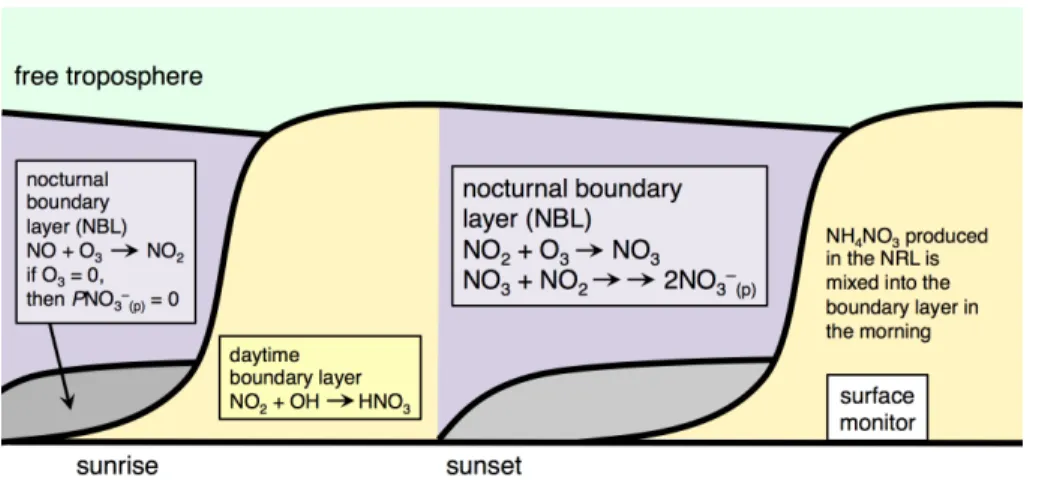
In the evening, reduced sunlight diminishes the heating of the Earth’s surface, lead-ing to strong suppression of vertical mixlead-ing and the formation of a shallow nocturnal boundary layer (NBL). Between the NBL and the free troposphere, in the nocturnal residual layer (NRL), mixing is weak and further layering may occur (Brown et al., 15
2007). The initial concentrations of species in the NRL are determined by the concen-trations observed at the point when the residual layer decouples from the NBL, around sunset. Afterwards, the strong surface inversion keeps fresh emissions from entering the NRL. The NRL is seen by surface monitors in the morning when solar heating and turbulent mixing reincorporate what was the NRL into the growing daytime boundary 20
layer (Fig. 4), a process that also alters the NRL composition. On nights when NO3 rad-ical production in the NBL is zero due to high NO emissions, NO3chemistry may still
be active in the dynamically decoupled NRL. Figure A1 (Appendix A) shows an exam-ple of at least two elevated NO−3 (g+p)residual layers observed during DISCOVER-AQ. Loss from the atmosphere is likewise affected by this vertical structuring, as deposition 25
ACPD
15, 27087–27136, 2015NOx control over
ammonium nitrate
S. E. Pusede et al.
Title Page
Abstract Introduction
Conclusions References
Tables Figures
◭ ◮
◭ ◮
Back Close
Full Screen / Esc
Printer-friendly Version
Interactive Discussion
Discussion
P
a
per
|
Discussion
P
a
per
|
Discussion
P
a
per
|
Discussion
P
a
per
|
Nitrate radical reacts with NO2 to form dinitrogen pentoxide (N2O5) and generally in the atmosphere N2O5≫NO3(Brown et al., 2009; Brown and Stutz, 2012). The lifetime
of N2O5 back to thermal decomposition to NO2 and NO3is∼10 min at 270 K. NO3is
also lost to reaction with certain organic species, especially compounds with unsatu-rated carbon-carbon bonds. When reaction times are long, for example during long, 5
dark winter nights, and when unsaturated hydrocarbon emissions are low, the most important loss of NO3is via N2O5uptake onto aerosols (e.g., Dentener and Crutzen, 1993; Macintyre and Evans, 2010; Wagner et al., 2013), whereupon N2O5 reacts
het-erogeneously with aerosol-phase water to give two NO−3. The heterogeneous loss rate of N2O5is a function of the total aerosol surface area and of the fraction of gas-particle 10
collisions resulting in N2O5 uptake, which is composition dependent, being inversely proportional to NO−3 and dependent on the amount of organic aerosol (Brown et al., 2007; Bertram et al., 2009; Bertram and Thornton, 2009).
During the daytime, nitric acid (HNO3) is the gas-phase reaction product of the oxida-tion of NO2and the hydroxyl radical (OH) (Reaction R2). The production rate of HNO3
15
increases rapidly with increasing NOx at low NOx and converges at a limit set by the primary HOx (HOx≡OH+HO
2+RO2) production rate at higher NOx. The functional
form of the dependence of HNO3 production on NO2 (Fig. B1b) arises from the
non-linear effects of NOx on the OH abundance, as NOx both propagates and terminates the HOx catalytic cycle. Under the high NOxconditions of the wintertime SJV, HNO3is 20
the dominant daytime HOx termination product. Combined with high NH3, partitioning
to the aerosol phase is a function of ambient temperature and humidity.
NO2+OH+M→HNO3+M (R2)
Trends in calculated wintertimePNO−3 for the nighttime and daytime mechanisms, as constrained by the observations (calculations and data are described in Appendix B), 25
show thatPNO−3 in the NRL is the only chemistry that matches trends in NO−3 (Fig. 2). Specifically,PNO−3 in the NRL is the only chemistry that exhibits identical NO2
depen-dence as observed in the NO−
3 measurements – both over time and from weekday
ACPD
15, 27087–27136, 2015NOx control over
ammonium nitrate
S. E. Pusede et al.
Title Page
Abstract Introduction
Conclusions References
Tables Figures
◭ ◮
◭ ◮
Back Close
Full Screen / Esc
Printer-friendly Version
Interactive Discussion
Discussion
P
a
per
|
Discussion
P
a
per
|
Discussion
P
a
per
|
Discussion
P
a
per
|
to weekend. In Fig. 5, the calculated annual wintertime daily-integrated PNO−3 in the NRL is shown vs. daytime NO2on weekdays and weekends in Fresno and Bakersfield. We compute thatPNO−
3 in the NRL has decreased by ∼1 µg m −3
day−1
ppb−1
NO2 in both cities, approximately twice the trend observed in NO−3 vs. NO2. The total daytime
source (R2) has, by contrast, not significantly changed as a function of NO2. PNO − 3
5
attributed to the HOx sources O(1D)+H2O and formaldehyde (CH2O) has slightly in-creased (∼5 %) since 2001 and that attributed to the HOxsource nitrous acid (HONO)
has decreased almost equivalently (Appendix B, Fig. B2). In the NBL (not shown), as a result of reduced titration of O3 at sunset, PNO−
3 has increased from<1 to 5–
8 µg m−3day−1 on weekdays and to 10–13 µg m−3day−1 on weekends, that said, this 10
increase has occurred within a volume only a fraction of the size of the NRL or of the daytime boundary layer.
4 Discussion
4.1 Relating concentration and production
The concentration of NO−3 (g+p)is a function ofPNO−3, as well as loss and mixing. While 15
high aerosol days in the SJV are in part attributed to persistent and severe stagnation, controls over the portion of aerosol mass that is NH4NO3are far more dynamic (Pandis
and Seinfeld, 1990; Vayenas et al., 2005). In this section we show that the effects of loss and mixing on the NO−3 concentration are consistent with observed NO−3 trends over time, differences by day-of-week, accumulation rates during stagnation, and differences 20
between Fresno and Bakersfield.
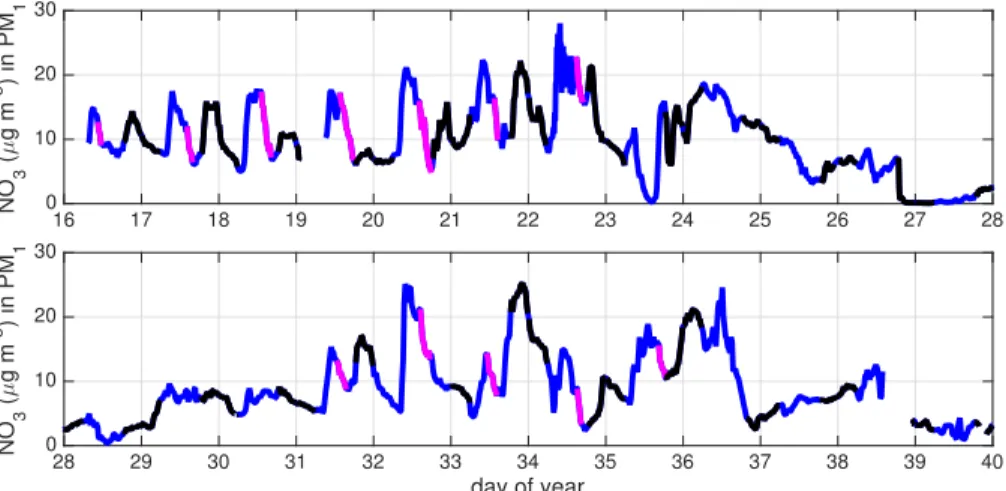
On days when NH4NO3 exceeded 20–30 µg m−3
, as measured from the ground in Fresno during DISCOVER-AQ, and as was typical during stagnation periods, the diur-nal variability of NO−3 at the surface was characterized by a steep and substantial in-crease in NO−
3 in the morning, a slow decline through midday, and a rapid decrease in
ACPD
15, 27087–27136, 2015NOx control over
ammonium nitrate
S. E. Pusede et al.
Title Page
Abstract Introduction
Conclusions References
Tables Figures
◭ ◮
◭ ◮
Back Close
Full Screen / Esc
Printer-friendly Version
Interactive Discussion
Discussion
P
a
per
|
Discussion
P
a
per
|
Discussion
P
a
per
|
Discussion
P
a
per
|
the afternoon (Fig. 6). On these mornings, the rate of the rise in NO−3 is consistent with reincorporation of high-NO−
3 NRL air into the boundary layer. At midday, OH-initiated
PNO−3, atmospheric loss, and daily maximum winds all play upon [NO−3]. In the af-ternoon, OH-initiatedPNO−3 is minimal due to attenuated evening radiation (nocturnal PNO−
3 is then∼zero). On days exhibiting this pattern, the NO −
3 concentration was
ob-5
served to decrease at a rate equal to 3.0±1.3 µg m−3h−1(1σvariability), with individual
rates determined as the slopes of linear fits through the magenta data and identified as periods of steady decrease at least 3 h long. Time windows were allowed to vary, and the average window was 1:25 p.m.–4:05 p.m. LT, spanning 10:30 a.m.–6:30 p.m. LT. In what follows, we use this afternoon rate of change (when loss dominates production 10
and mixing) to derive the atmospheric NO−3 lifetime (τNO−
3).
The atmospheric lifetime of aerosol in the boundary layer is determined by wet and dry deposition of aerosol, the wet and dry deposition of gases in equilibrium with aerosol, and mixing to the free troposphere where concentrations are much lower. Wet deposition occurs by interaction with rain, which scavenges aerosol and soluble 15
gases, and leaves the valley relatively clear. Multiday fog is common in the winter in the SJV (Holets and Swanson, 1981), enhancing NH4NO3removal when fog leads to
rain or drizzle (Jacob et al., 1986a, b), as inorganic ions readily partition into aqueous fog droplets (Waldman et al., 1982; Munger et al., 1983), but having little effect if fog dissipates. Fog has not been seen to accelerate the conversion of NO2to NO−
3 in the
20
SJV (Jacob et al., 1984).
There are few direct measurements of deposition rates of aerosol, HNO3, and NH3.
HNO3 is theorized to deposit at a transport-limited rate, NH3 exchange is dependent on surface and meteorological conditions, and aerosol, especially smaller particles, to deposit slowly. PM1to PM2.5deposition velocities (υd) have been reported to be 0.01 to
25
0.1 cm s−1(Sehmel, 1980; Slinn, 1982), too slow to account for the observed afternoon loss rates in Fig. 6. To compute NO−3 loss by deposition of gas-phase HNO3, HNO3(g)
was modeled with ISORROPIA II (Nenes et al., 1998; Fountoukis and Nenes, 2007) run
ACPD
15, 27087–27136, 2015NOx control over
ammonium nitrate
S. E. Pusede et al.
Title Page
Abstract Introduction
Conclusions References
Tables Figures
◭ ◮
◭ ◮
Back Close
Full Screen / Esc
Printer-friendly Version
Interactive Discussion
Discussion
P
a
per
|
Discussion
P
a
per
|
Discussion
P
a
per
|
Discussion
P
a
per
|
in forward mode, an approximation that was reasonable as (a) during the wintertime, temperatures were low and humidities were high and (b) NO−3 was shown to be limiting to NH4NO3 (Fig. 2). ISORROPIA II was initialized as [NO
−
3+HNO3]=[NO −
3]AMS and
[NH+4+NH3]=[NH+4]AMS. Calculated HNO3(g)was added back to [NO−
3+HNO3], while
NH3(g)was added as 1.1 HNO3(g) (by mole) to ensure NH3was in excess. ISORROPIA
5
II was solved iteratively until daytime HNO3(g) changed by<2 % by mass. The phase
state was set as metastable (e.g., Rood et al., 1989; Zhang et al., 2003; Vayenas et al., 2005). We assume that gases and aerosol are in equilibrium, that aerosols are homogenous and internally mixed, and that unaccounted-for factors do not influence the thermodynamics of the system (Vayenas et al., 2005). Calculated HNO3 mixing 10
ratios were greatest in the afternoon (12–4 p.m. LT), at which time they were 2 ppb on average for the DISCOVER-AQ time period and up to 4–6 ppb on the warm days only. In the 24 h average, HNO3(g) was 15 % of [NO−3+HNO3] by mass and was 40 % (median) in the afternoon. High HNO3(g)was generally simultaneous with the
magenta-highlighted NO−
3 data (Fig. 6).
15
To compute theυd of HNO3, the equation ∂NO−
3
∂t = υd
hC was solved, with ∂NO−
3
∂t equal
to the observed afternoon loss rate on designated (magenta) days,Cequal to the daily mean HNO3(g) over the same time windows, andh equal to the maximum boundary layer height (i.e. the afternoon height) visually estimated according to aerosol backscat-ter estimates by a micro-pulse lidar supplemented with a wide-field receiver system 20
(Appendix A). In this way, we derivedυd equal to 5±2 cm s−1, which was in line with
previous direct measurements of 1–10 cm s−1 (e.g., Huebert and Robert, 1985; Mey-ers et al., 1989; Sievering et al., 2001; Volpe Horii et al., 2005; Farmer et al., 2006) and constrained estimates of 6 cm s−1 (Vayenas et al., 2005). Given a υd of 5 cm s−1 (assumed constant), the hourly ∂NO
−
3
∂t was computed for every hour of the day, with
25
C equal to the time-varying HNO3(g) and h equal to the time-varying boundary layer
ACPD
15, 27087–27136, 2015NOx control over
ammonium nitrate
S. E. Pusede et al.
Title Page
Abstract Introduction
Conclusions References
Tables Figures
◭ ◮
◭ ◮
Back Close
Full Screen / Esc
Printer-friendly Version
Interactive Discussion
Discussion
P
a
per
|
Discussion
P
a
per
|
Discussion
P
a
per
|
Discussion
P
a
per
|
was fully developed at 11 a.m., and the evening (6 p.m.) collapse (also linear) took only 2 h.
With respect to surface deposition alone, τNO−
3 was calculated to be only 3 h
(0.1 days) under daytime conditions. As a lower bound, if the trueυdwas at the slowest
end of previous observations (1 cm s−1), then τNO−
3 would be 14 h under daytime
con-5
ditions. Lifetimes in this range are shorter than typical stagnation periods, observed to be 5±1.5 days (1σ variability) in both Fresno and Bakersfield (decadal average). By
comparison, PM1–PM2.5 υd yield τNO−
3 of 6–58 days. Such long lifetimes indicate the
frequency of frontal passages controls the PM lifetime. Because the loss of NH4NO3, via HNO3 deposition, is rapid and PNO
−
3 is relatively large, high aerosol days are
ex-10
pected to be more responsive to changes in emissions than expected if one considered loss only through particle deposition.
There are other observational constraints that any account of aerosol NO−3 in the SJV should explain. Median NO−3 (2001–2013) is 25 % higher in Bakersfield than Fresno (Fig. 2). However, the observationally-constrained calculated totalPNO−3 (NRL 15
plus OH-initiated) is 25 % lower in Bakersfield than Fresno (Fig. 5). We find that win-tertime stagnation events, defined as continuous days with increasing 24 h PM2.5,
are more severe in Bakersfield than in Fresno, i.e. there is a greater increase in PM2.5day−1
over each individual event. The median increase in PM2.5 day−1
event−1
over the last decade was 15 % greater in Bakersfield (7.9 µg m−3day−1event−1) than 20
Fresno (6.7 µg m−3day−1event−1) leading to 23 % larger increases in PM2.5event−1 in Bakersfield (32.5 µg m−3event−1) than Fresno (25.1 µg m−3event−1). PM2.5 on the
first day of the event was also 20 % higher in Bakersfield (8.6 µg m−3event−1 vs. 6.9 µg m−3
event−1
). These differences between Bakersfield and Fresno are attributed to the former’s location in the southern end of the SJV, where the city is enclosed 25
on three sides by the mountains, resulting in reduced losses to advection and mixing than in Fresno. An enhanced influence of stagnation over the NO−
3 concentration in the
ACPD
15, 27087–27136, 2015NOx control over
ammonium nitrate
S. E. Pusede et al.
Title Page
Abstract Introduction
Conclusions References
Tables Figures
◭ ◮
◭ ◮
Back Close
Full Screen / Esc
Printer-friendly Version
Interactive Discussion
Discussion
P
a
per
|
Discussion
P
a
per
|
Discussion
P
a
per
|
Discussion
P
a
per
|
southern SJV is reflected in the looser observed correlation (r2) in Fig. 2 in Bakersfield (0.6) than in Fresno (0.9).
4.2 Impacts of future NOx reductions
California has committed to additional, sizable controls on NOx emissions, with
de-creases of at least 50 %, and potentially up to 75 % NOx, imminent over the next 5
decade. California has implemented a retrofit/replacement program to accelerate im-pacts of federal rules on diesel engines, affecting weekday NOx(Dallmann and Harley, 2010), and has both tightened standards on gasoline-powered vehicles and required one in seven new cars sold in the state be zero-emission or plug-in hybrids for model years 2017–2025 (CARB, 0.2012), affecting weekday and weekend NOx.
10
Currently, average wintertime NOx concentrations are low enough that reductions of 50 and 75 % are calculated to decreasePNO−3 in the NRL in Bakersfield on weekends by 40 and 70 %, respectively (Fig. 7a), with similar results in Fresno and Visalia. Recall, the NO3 radical production is nonlinear vs. NO2 and, for a fixed Ox concentration,
production is described by a single curve in Fig. B1a. When Oxis variable, NO3radical
15
production is described by multiple curves, and is most sensitive to changes in O3 at NO2 concentrations which are at and/or greater than peak NO3 radical production.
At low NOx (and high NOx), PNO−3 that is limited by NO3 radical production is more
sensitive to changes in NO2. Figure 5 suggests that a direct result of decreases in NO2, the chemical sensitivity ofPNO
−
3 on NO2has been altered such that future NOx
20
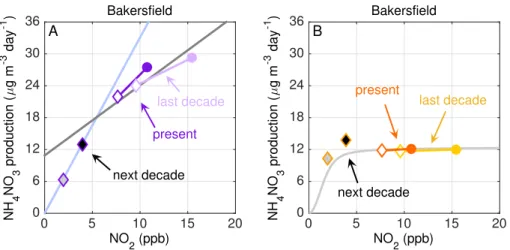
controls are poised to more effective at slowing PNO−3 in the next decade than they have over the last. We computed that NOxreductions of 50 and 75 % are large enough that changes in the average wintertime NH4NO3are quantified via 2.56 : 1 line, which is
the stoichiometric NO−3 response to NO2, meaning the O3feedback from reduced NOx
on PNO−
3 is minimal. Our calculation also implies greater decreases in PNO − 3 have
25
occurred in lower-NOx rural environments than in cities since 2001 given the same
ACPD
15, 27087–27136, 2015NOx control over
ammonium nitrate
S. E. Pusede et al.
Title Page
Abstract Introduction
Conclusions References
Tables Figures
◭ ◮
◭ ◮
Back Close
Full Screen / Esc
Printer-friendly Version
Interactive Discussion
Discussion
P
a
per
|
Discussion
P
a
per
|
Discussion
P
a
per
|
Discussion
P
a
per
|
in the shallowest boundary layers of December and January; we observed that during DISCOVER-AQ, NOx concentrations were large enough that reduced weekend NOx
(21–22 January) had the effect of increasingPNO−3 in the NRL relative to the preceding weekdays, i.e. chemistry on these days was right of peak NO3radical production.
For NOx emission changes to affect daytime PNO −
3, they must be large enough
5
to transition photochemistry into the NOx-limited regime, less than a few ppb in the wintertime SJV (Fig. B1b). In Bakersfield (Fig. 7b), at−50 % NO
x from current levels
we predict an increase in daytime NH4NO3 production of 2 µg m−3
day−1
(∼15 %) but
at −75 % NO
x we predict a transition to low-NOx chemistry and a net decrease in
NH4NO3 production of 1.5 µg m −3
day−1 (15 %). Initial enhancements in NH4NO3 are
10
caused by NOxfeedbacks on the HOx precursors, O3and CH2O, which both increase in response to decreases in NO2 (Fig. B2). In Fig. 7b, the gray line is the modeled
NH4NO3 production day −1
calculated for present day conditions. The modeled points show the results of the calculations, for which the influence of NOxdecreases onPHOx and the subsequent feedbacks on are NH4NO3 production are accounted. Movement 15
of predicted NH4NO3production above the gray line is due to the NO2-PHOxprecursor
feedback. In Fresno (not shown), we compute an increase of 0.5 µg m−3day−1(<5 %) at −50 % NO
x and a decrease in NH4NO3 production of ∼3 µg m −3
day−1
(20 %) at
−75 % NO x.
Combining our derived trends in NRL and daytime PNO−3 (Table 1), we calculate 20
impacts of past and future NOx controls on the frequency of wintertime 24 h PM2.5 NAAQS exceedances. Using data from a multi-year experiment in the early 2000s (Ap-pendix A), we found that 24 h NO−3 was observed to be an almost constant fraction of wintertime 24 h PM2.5 in Fresno when 24 h PM2.5 was greater than 15 µg m−3
, and was an even larger fraction at lower loadings, typically in March. During DISCOVER-25
AQ, surface NO−3 in PM2.5measurements in Fresno indicated 41 % (median) and 39 %
(mean) of PM2.5was NO−
3 and 57 % (median) and 53 % (mean) was NH4NO3. Previous
work has shown that NH4NO3is a smaller portion of total PM2.5in Fresno than in any
other location in the SJV, including Bakersfield, with rural PM2.5dominated by NH4NO3
ACPD
15, 27087–27136, 2015NOx control over
ammonium nitrate
S. E. Pusede et al.
Title Page
Abstract Introduction
Conclusions References
Tables Figures
◭ ◮
◭ ◮
Back Close
Full Screen / Esc
Printer-friendly Version
Interactive Discussion
Discussion
P
a
per
|
Discussion
P
a
per
|
Discussion
P
a
per
|
Discussion
P
a
per
|
(Zhang et al., 2010). Therefore, we applied our calculated changes inPNO−3 to 50 % of PM2.5mass, which represents a conservative estimate.
We conclude that NOx controls over the last decade have reduced the number of
exceedances by 12–30 %, accounting for 22–60 % of the total observed change. The primary mechanism for these changes was decreasedPNO−3 in the NRL. In the future, 5
a 50 % reduction in NOx is predicted to decrease PNO −
3 in the NRL more efficiently
and to the point where it is approximately equal to OH-initiated PNO−3 on weekends. This chemical source will still be larger than daytime production on weekdays. If larger reductions of 75 % NOx are achieved,PNO
−
3 in the NRL will decrease sufficiently that
daytime OH-initiated HNO3 formation is predicted to become the dominant source of
10
NH4NO3on all days of the week.
Over the next decade, we predict the SJV will experience 12–21 % fewer exceedance days with a 50 % decrease in NOx and ∼30 % fewer exceedances with a 75 %
de-crease in NOx. We have found that only PNO−3 chemistry drives NH4NO3, not NH3
(Fig. 2); additionally, it has been shown elsewhere that NH3 emissions in the SJV are 15
too great for any reasonable NH3 control to affect NH4NO3 concentrations (Herner
et al., 2006). While these NOx reductions constitute a major improvement to the air quality in the SJV, and while they will also improve the SJV’s severe summertime O3 pollution (Pusede and Cohen, 2012; Pusede et al., 2014), it is evident that, in addition to inorganic nitrate, controls on the organic aerosol mass are also required to eliminate 20
high aerosol days in the SJV. Generally speaking, regulatory policies of valley-wide inter-pollutant trading of NOx for PM2.5control must be designed both with knowledge
of each nonlinear PNO−3 mechanism vs. NO2. Finally, because NO −
3 is concentrated
over Fresno and Bakersfield, NOx reductions need to happen in those cities them-selves, prioritizing localized interventions.
ACPD
15, 27087–27136, 2015NOx control over
ammonium nitrate
S. E. Pusede et al.
Title Page
Abstract Introduction
Conclusions References
Tables Figures
◭ ◮
◭ ◮
Back Close
Full Screen / Esc
Printer-friendly Version
Interactive Discussion
Discussion
P
a
per
|
Discussion
P
a
per
|
Discussion
P
a
per
|
Discussion
P
a
per
|
5 Conclusions
We derived trends in the wintertime production of NO−3 (PNO−3) as calculated from measurements of gas-phase precursors over the last thirteen years. We used these PNO−
3 trends to explain the observed NO −
3 concentration sensitivity to NO2, which was −0.5 and −0.64 µg m−3ppb−1NO2 in the San Joaquin Valley (SJV) cities of Fresno
5
in Bakersfield, respectively. We found that reductions in NOx have both decreased and increased NH4NO3 formation rates by the various chemical pathways, but that the net downward trend in NO−3 has been driven by local changes in nighttime chem-istry in residual layers decoupled from fresh surface emissions. We showed that high NH4NO3 abundances were a combined function of active chemical PNO−3 and rapid 10
atmospheric loss by deposition of gas-phase HNO3 (τNO−
3
∼3 daytime h); in contrast,
the total aerosol mass lifetime was controlled by cold fronts that turnover valley air on average every 5±1.5 days. We computed the impact of future NOx decreases on
PNO−3 from both nighttime and daytime mechanisms, finding the sign and magnitude of the changes are dependent on oxidation pathway, oxidant precursor, NO2 concen-15
tration, and, at night specifically, altitude. We calculated that the SJV will experience 12–21 % fewer days in exceedance of the 24 h PM2.5 standard with a 50 % NOx
re-duction and∼30 % fewer 24 h PM
2.5exceedance days with a 75 % NOx reduction. As
an additional consequence of anticipated NOx controls, daytime rather than nighttime
chemistry will drive NH4NO3production in the SJV in the future. The observations and
20
calculations presented here offer improved insight into the chemistry imbedded in the wintertime NH4NO3diurnal cycles and suggest such long-term measurements would
inform the absolute and relative contributions by vertically stratified NO3chemistry vs.
OH-initiated production, especially if a record that captured diurnal variability were put in place prior to the sizable NOxreductions that are forthcoming. To conclude, the
spe-25
cific NOxconstraints on NH4NO3chemistry we described here likely inform the effects
of NOx emission changes, both increases and decreases, on aerosol mass in polluted cities around the world.
ACPD
15, 27087–27136, 2015NOx control over
ammonium nitrate
S. E. Pusede et al.
Title Page
Abstract Introduction
Conclusions References
Tables Figures
◭ ◮
◭ ◮
Back Close
Full Screen / Esc
Printer-friendly Version
Interactive Discussion
Discussion
P
a
per
|
Discussion
P
a
per
|
Discussion
P
a
per
|
Discussion
P
a
per
|
Appendix A: Measurements
A1 Long-term records
The long-term aerosol NO−
3 data are from 24 h integrated filter-based measurements
of PM10collected once every three to six days as part of the US EPA’s Chemical
Speci-ation Network program. The data were downloaded from the California Air Resources 5
Board (CARB) archive (http://www.arb.ca.gov/aqmis2/aqdselect.php). We used mea-surements at Fresno-First Street (36.782◦N, 119.773◦W) and Bakersfield-5558 Cali-fornia Avenue (35.357◦N, 119.063◦W), as the two stations had mostly uninterrupted records and co-located observations of NO2 and O3. In Fig. 2, Bakersfield NO−
3
win-tertime (November–March) medians include the years 2001–2013 with an average of 10
46 weekday and 18 weekend data points year−1. The Fresno-First Street station was closed in 2012 and so the Fresno NO−
3 wintertime medians include 2001–2012 with an
average of 36 weekday and 17 weekend data points year−1.
To make these NO−3 measurements, ambient air is sampled through a denuder and aerosol are collected on a quartz fiber filter for 24 h, midnight-to-midnight. Water-15
soluble ions are then quantified by ion chromatography. NH4NO3is semi volatile and
exists in thermal equilibrium with gas-phase HNO3 and NH3. Long sample collection
times (24 h) and the presence of a denuder result in low biases due to loss of NO−3 to the gas-phase (Appel et al., 1981; Shaw Jr. et al., 1982; Hering and Cass, 1999; Babich et al., 2000). This interference is well documented and observed to be large 20
during summer months, when more than 80 % NH4NO3 may be lost, but is estimated
to be∼20 % when relative humidities are high and temperatures are cold (Appel et al.,
1981; Shaw Jr. et al., 1982; Hering and Cass, 1999). If we assume ambient conditions are driving (Appel et al., 1981; Shaw Jr. et al., 1982; Hering and Cass, 1999; Babich et al., 2000), we can estimate the interference using AMS observations of NO−
3, NH
+
4,
25
ACPD
15, 27087–27136, 2015NOx control over
ammonium nitrate
S. E. Pusede et al.
Title Page
Abstract Introduction
Conclusions References
Tables Figures
◭ ◮
◭ ◮
Back Close
Full Screen / Esc
Printer-friendly Version
Interactive Discussion
Discussion
P
a
per
|
Discussion
P
a
per
|
Discussion
P
a
per
|
Discussion
P
a
per
|
the thermodynamic model ISORROPIA II (Nenes et al., 1998; Fountoukis and Nenes, 2007). We set the total gas plus particle concentration equal to the ion data and ran the model in the forward mode to simulate the gas-aerosol partitioning after the air stream passed through a denuder, which is consistent with all of the gas being captured by the denuder and all aerosol depositing on the filter. During DISCOVER-AQ (14 January–14 5
February 2013) the daily average temperature and relative humidity (RH) were 8.5◦C and 70 %, respectively. Median daytime (8 a.m.–6 p.m.) wintertime temperatures were within∼1◦C and 1 % RH in Bakersfield and Fresno. When these conditions drive the
interference, we predict that daily-integrated NO−3 was biased low by 25 %, in line with other reports (Chow et al., 2005). The average wintertime (November–March) tem-10
perature and RH at the USDA Shafter Station from 2000–2013 were 10◦
C and 79 %, respectively. Under these ambient conditions, we predict measurements of the daily-integrated NO−3 are biased low by 23 %. Evaporative loss of NO−3 of 25 % implies the true slope is 20 % greater with respect to the measured value. The observed correla-tion between NO−3 and NO2indicates∼20 % of NO2is oxidized to NO
−
3 (Fig. 2), a 20 %
15
NO−3 error implies that 25 % of NO2is oxidized to NO − 3.
Hourly O3, 24 h total PM2.5, and NO2data are from the CARB archive at the follow-ing sites: Fresno-First Street (2000–2011), Fresno-Garland (36.785◦N, 119.773◦W) (2011–2013), Visalia-North Church Street (36.333◦N, 119.291◦W) (2000–2013), and Bakersfield-5558 California Avenue (2000–2013). NO2 measurements are made by 20
chemiluminescence coupled to a heated molybdenum catalyst and have a known but poorly quantified positive interference from higher oxides of nitrogen (Winer et al., 1974; Williams et al., 1998; Dunlea et al., 2007). This interference is largest in the summer-time when weakly bound higher oxides are more abundant relative to NOx and mini-mal in the wintertime. These instruments sample ambient air through a filter, removing 25
NO−
3 and likely a considerable fraction of gas-phase HNO3and multifunctional organic
nitrates, reducing the positive artifact. NO2 concentrations are decreasing across the
valley at a rate similar to that observed from space by OMI, an instrument selective for NO2, suggesting that relative trends in NO2are accurate (Russell et al., 2010).
ACPD
15, 27087–27136, 2015NOx control over
ammonium nitrate
S. E. Pusede et al.
Title Page
Abstract Introduction
Conclusions References
Tables Figures
◭ ◮
◭ ◮
Back Close
Full Screen / Esc
Printer-friendly Version
Interactive Discussion
Discussion
P
a
per
|
Discussion
P
a
per
|
Discussion
P
a
per
|
Discussion
P
a
per
|
Hourly solar radiation, temperature, and RH data are from the California Irrigation Management Information System archive (http://wwwcimis.water.ca.gov/Default.aspx) at the Shafter US Department of Agriculture (USDA) station (35.530◦N, 119.280◦W). Sunrise and sunset times in Bakersfield (35.357◦N, 119.063◦W) were downloaded from the United States Naval Observatory Naval Oceanography Portal (http://aa.usno. 5
navy.mil/data/docs/RS_OneYear.php).
Nitrate ion observations with 10 min time resolution were available during select time periods and were used to determine the wintertime variability in the fraction of PM2.5 that was NO
−
3. There data were collected in Fresno in 2000–2001 and
2003–2005 (Watson et al., 2000) as part of the EPA PM Supersites program (http: 10
//www.epa.gov/ttnamti1/supersites.html). These measurements were made by flash volatizing NH4NO3, reducing HNO3 across a heated catalyst to nitric oxide (NO), and
detecting NO by chemiluminescence (Stolzenburg et al., 2003; Chow et al., 2008). It was reported that 24 h averages of these high-time resolution observations were well correlated with, but 20–40 % lower than, 24 h PM2.5filter samples (annual averages).
15
This effect has been attributed to incomplete volatization and/or incomplete catalytic conversion of NO−
3 to NO. Two identical instruments at the Fresno supersite yielded
data that were also well correlated but different by 10–55 % in the annual average (Chow et al., 2008). We treat these observations as uncalibrated but internally consis-tent over time.
20
A2 DISCOVER-AQ observations
The DISCOVER-AQ experiment synchronized multiple ground sites and aircraft sam-pling of in situ and column measurements, producing a dataset resolved in space, both horizontally and vertically, and in time. The DISCOVER-AQ sampling strategy was built on repeated sampling across urban-rural (horizontal) and vertical gradients and on con-25
necting observations made from balloons, onboard aircraft, and from space to moni-toring sites at the surface. The NASA P-3B aircraft flew 2–3 identical circuits day−1
ACPD
15, 27087–27136, 2015NOx control over
ammonium nitrate
S. E. Pusede et al.
Title Page
Abstract Introduction
Conclusions References
Tables Figures
◭ ◮
◭ ◮
Back Close
Full Screen / Esc
Printer-friendly Version
Interactive Discussion
Discussion
P
a
per
|
Discussion
P
a
per
|
Discussion
P
a
per
|
Discussion
P
a
per
|
(300 m a.g.l.) and high altitude flight passes (2.6 km a.g.l.). Circuits included missed ap-proaches at all cities and rural waypoints when visibility permitted. Missed apap-proaches allowed the P-3B to reach altitudes as low as 20–40 m a.g.l.) and were conducted over airstrips. Landing strips were often rural and little trafficked but may have experienced airport-related NOxenhancements in the cities of Fresno and Bakersfield.
5
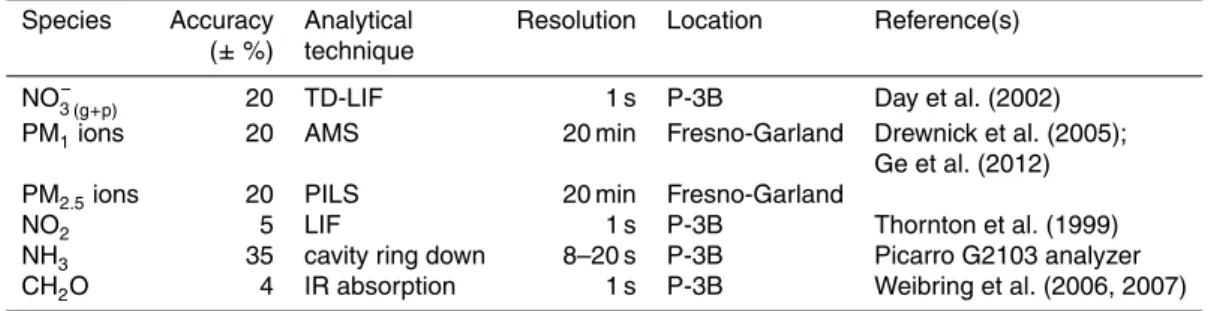
The comprehensive suite of DISCOVER-AQ data is available to the public at: https://www-air.larc.nasa.gov/cgi-bin/ArcView/discover-aq.ca-2013. Table A1 lists the measurement accuracy, analytical technique, platform and location, and associated references of species key to this analysis.
The NO−3 (g+p) measurements were made by thermal dissociation laser induced flu-10
orescence (TD-LIF). The TD-LIF operating principle is as follows: NO2 is detected by
laser-induced fluorescence (LIF) (Thornton et al., 1999). A tunable dye laser is pumped by a Q-switched, frequency doubled Nd3+:YAG laser. The narrow band dye laser is etalon-tuned to a specific 585 nm rovibronic feature of NO2, alternating between this
feature and the weaker continuum absorption. The resulting red-shifted photons are 15
imaged onto a photomultiplier tube and collected using time-gated counting. The LIF technique is spectroscopically specific and accurate (±5 %). The system was calibrated
in flight every∼30 min with an NO
2reference standard added at the inlet. The higher
oxides of nitrogen, peroxy nitrates (RO2NO2), alkyl nitrates (RONO2), and HNO3 are
measured by thermal dissociation (TD) coupled to LIF (Day et al., 2002). Dissociation 20
of thermally labile species into NO2 and a companion radical occurs at characteris-tic temperatures due to differing N–O bond strengths. Ambient air is pulled through heated quartz tube ovens followed by PFA sampling lines before reaching the NO2
de-tection cell. An unheated channel detects only NO2, a second channel (180◦
C) mea-sures NO2+RO2NO2, a third channel (400
◦
C) measures NO2+RO2NO2+RONO2(g+p),
25
and a fourth (600◦C) measures NO2+RO2NO2+RONO2(g+p)+NO −
3 (g+p). Mixing
ra-tios of each species are determined as the difference between adjacent channels, i.e. NO−3 (g+p)equals the 600◦C channel minus the signal in the 400◦C channel.
ACPD
15, 27087–27136, 2015NOx control over
ammonium nitrate
S. E. Pusede et al.
Title Page
Abstract Introduction
Conclusions References
Tables Figures
◭ ◮
◭ ◮
Back Close
Full Screen / Esc
Printer-friendly Version
Interactive Discussion
Discussion
P
a
per
|
Discussion
P
a
per
|
Discussion
P
a
per
|
Discussion
P
a
per
|
Particles smaller than 2.5 µm are thought to be efficiently transmitted through the in-let to the TD-LIF system. Measurements of NO−3 (g+p)typically agreed with an onboard PILS system (4 min time resolution) with an ∼3 µm aerosol size cutoff and
detect-ing only particle-phase NO−3, indicating the two instruments sampled aerosol of simi-lar sizes, that the bulk of NO−3 (g+p) was in the aerosol phase, and that inlet losses of 5
NO−3 (g+p)were minimal. Additional details on the TD-LIF aircraft inlet configuration are found in Perring et al. (2009) and Wooldridge et al. (2010).
A sample of TD-LIF data collected during a morning flight segment is shown in Fig. A1, where at least two residual layers are visible; however, due to a combination of an extremely shallow NBL and the NO−3 (g+p) sampling cycle, it is unclear whether the 10
surface mixed layer was indeed captured. The indication of the surface air would have been low to zero O3concentrations with concurrent NO
−
3 (g+p)measurements.
A3 Data and filtering for boundary layer sampling
Regarding measurements made onboard the P-3B aircraft, on some occasions, the height of the daytime boundary layer was observed near the altitude of the P-3B’s low-15
level flight legs, requiring analysis to distinguish between free troposphere and bound-ary layer air. Within boundbound-ary layer sampling was confirmed using 1 s−1measurements of NO and RH recorded by the aircraft PDS, according to steep discontinuities in both tracers, being high in the boundary layer and low aloft. In some cases, H2O(v)measured by diode laser hygrometer (DLH) and O3were also considered.
20
For our derivation of τNO−
3, to estimate the boundary layer depth we referred to
a micro-pulse lidar (MPL) located in the town of Porterville during DISCOVER-AQ. The MPL was supplemented with a wide-field receiver system that allowed for improved near-range signal recovery of the 527 nm attenuated backscatter profiles that were recorded at 30 m vertical and 1 min time resolutions. For daytime mixed-layer conditions 25
Ac-ACPD
15, 27087–27136, 2015NOx control over
ammonium nitrate
S. E. Pusede et al.
Title Page
Abstract Introduction
Conclusions References
Tables Figures
◭ ◮
◭ ◮
Back Close
Full Screen / Esc
Printer-friendly Version
Interactive Discussion
Discussion
P
a
per
|
Discussion
P
a
per
|
Discussion
P
a
per
|
Discussion
P
a
per
|
cording to this aerosol gradient, boundary layer heights were observed to range from 300 to 700 m during DISCOVER-AQ.
Appendix B: CalculatingPNO− 3
The chemistry producing NO3 radical at night and HNO3 in the daytime vs. NO2 is shown in Fig. B1. In Fig. B1a, the production of NO3 radical (µg m
−3
h−1) is calculated 5
at four initial Ox (Ox≡NO2+O3) conditions: 50 ppb O
x (black), 40 ppb Ox (purple),
30 ppb Ox(violet), and 20 ppb Ox (gray). In Fig. B1b, the production of HNO3is shown for twoPHOx conditions: 0.3 ppt s−1PHOx (orange) and 0.15 ppt s−1 PHOx (golden). The same equations that produced Fig. B1 were used to computePNO−3.
B1 NO3-initiatedPNO−3 in the nocturnal residual layer (NRL)
10
Our time-dependent box model of NO3radical production was run separately for each
day over the time period 2000–2013. The model was initialized with hourly O3
mea-surements at the surface using the maximum concentration 1–3 h before sunset and the median daytime (10 a.m.–3 p.m. LT) NOx. The time window was determined based on the timing of steep afternoon O3 titration at the surface. Both O3 and NOx were
15
treated as well mixed in the daytime boundary layer, a good assumption in the after-noon.kNO2+O3 was calculated based on the mean surface temperature at 6–8 p.m. LT.
NO3radical production was integrated from sunset to 1 h prior to sunrise. Insignificant
differences were observed using the mean O3 over this time window and daily
maxi-mum O3. 20
Reaction fates of NO3 radicals calculated by the time-dependent box model
de-scribed above were determined according to the proportional NO3 reactivity
contri-butions observed during DISCOVER-AQ. The reaction pathways of NO3are as follows
ACPD
15, 27087–27136, 2015NOx control over
ammonium nitrate
S. E. Pusede et al.
Title Page
Abstract Introduction
Conclusions References
Tables Figures
◭ ◮
◭ ◮
Back Close
Full Screen / Esc
Printer-friendly Version
Interactive Discussion
Discussion
P
a
per
|
Discussion
P
a
per
|
Discussion
P
a
per
|
Discussion
P
a
per
|
(BR1–BR3):
NO3+NO2→N
2O5 (BR1)
NO3+alkene→RONO
2 (BR2)
NO3+aldehyde or alcohol or dimethyl sulfide→HNO3+products (BR3)
Each of the three pathways results in a different number of NO−
3 produced per NO3
rad-5
ical. NO3reactivities in Fresno and Bakersfield were computed using the
DISCOVER-AQ dataset with daytime (10 a.m.–5 p.m. LT) surface observations of NO2, organic
com-pounds (whole air canister sampling), and dimethyl sulfide (DMS) (whole air canister sampling). CH2O measurements from onboard the P3-B were included in the speciated
reactivity by R5. In both Fresno and Bakersfield, the reaction of NO2 with NO3
repre-10
sented ∼85 % of total NO
3 reactivity, with negligible weekday-weekend differences.
The median NO3 reactivity values used in the model were: 0.03 s −1
for addition to double bonds, yielding 0 HNO3;<0.001 s
−1
for hydrogen abstraction, yielding 1 HNO3;
and 0.2 s−1for reaction with NO2, which after heterogeneous conversion of N2O5yields
2 HNO3. This gives 1.7 NO −
3 produced per NO3, on average. The integratedPNO − 3 was
15
taken as the NO3 radical production scaled by the NO3 reactivity to NO2, which
as-sumed reactions with alkenes and DMS were instantaneous. This result is similar to that of the wintertime NACHTT experiment at comparable relative NO2concentrations
(Wagner et al., 2013), during which, NO3 and N2O5 were measured, the kinetics of
N2O5 explicitly included in the calculation of PNO−
3, and 1.6 HNO3 per NO3 radical
20
produced was inferred.
B2 NO3-initiatedPNO−3 in the nocturnal boundary layer (NBL)
The production of NO3 radical was directly computed from surface measurements of
hourly O3, NO2, NO, and temperature each day from 2000–2013. NO3production was
integrated between sunset and 1 h prior to sunrise and scaled by 1.7. There were times 25
ACPD
15, 27087–27136, 2015NOx control over
ammonium nitrate
S. E. Pusede et al.
Title Page
Abstract Introduction
Conclusions References
Tables Figures
◭ ◮
◭ ◮
Back Close
Full Screen / Esc
Printer-friendly Version
Interactive Discussion
Discussion
P
a
per
|
Discussion
P
a
per
|
Discussion
P
a
per
|
Discussion
P
a
per
|
and constant at nonphysical values of 1–10 ppb for multiple hours. This offset was interpreted as a measurement artifact as excess NO titrates O3completely. To account
for this, when NOx was greater than five times the reported O3, O3 was set equal to
zero prior to computing NO3production.
B3 OH-initiatedPNO− 3
5
The integrated daily production of HNO3was calculated for each day from 2000–2013
separately for each of the three HOx sources: O(1D)+H2O, HONO photolysis, and
CH2O photolysis (Eq. B1).PNO−
3 vs. NO2 attributed to each HOx source is plotted in
Fig. B2. OH was modeled with an analytical model constrained to DISCOVER-AQ ob-servations, built on the assumption that oxidizing radicals were in steady state (Eq. B2) 10
and that RO2and HO2production are approximately equal, as are RO2production and loss, giving Eq. (B2) for both RO2and HO2(Eq. B3) (Murphy et al., 2007). The symbol
α is the RONO2branching ratio. RO2NO2are considered to be in thermal equilibrium
with NO2 and peroxy radicals, and therefore not to contribute to net radical formation. Calculated wintertime OH values were∼106molecules cm−3 at noontime and
exhib-15
ited reasonable nonlinear NO2 dependence throughout the day. Observational inputs
to the model were NO and NO2, the total organic reactivity to OH (VOCR),PHOx,α,
and temperature. VOCR was computed as equal toPikOH+VOCi[VOCi] using whole air
samples of speciated organic molecules collected at the ground during DISCOVER-AQ and CH2O data from onboard the P-3B, as VOCR equal to
P
ikOH+VOCi[VOCi]. The
20
daytime average was∼4 s−1, consistent with a recent analysis of the temperature
de-pendence of total VOCR in Bakersfield (Pusede et al., 2014), giving confidence that the majority of the reactivity was accounted for. Theα is set equal to 2 %. Equations