Rev. Caatinga
CORN DEVELOPMENT AND PRODUCTION IN FUNCTION OF SOURCES OF
NITROGEN FERTILIZERS AND DOSES
1FERNANDO CASTRO OLIVEIRA2, MAURILIO DE SOUSA NETTO2, LUCAS DA SILVA ARAUJO2, ANDRÉ
CIRILO DE SOUSA ALMEIDA2*, PEDRO MARQUES DA SILVEIRA3, PAULO CÉSAR RIBEIRO DA CUNHA2
ABSTRACT - Nitrogen (N) is one of the nutrients that have the most significant effect on corn grain
productivity increase. In order to evaluate the effect of sources of N topdressing and doses in the grown corn culture, in a conventional till system, it was installed an experiment in the city of Urutaí, Goiás, in the 2012/13 crop, in clayey textured Red Latosol. The experimental design was a randomized complete block design with four replications, with the treatments arranged in a factorial 3 x 5, consisting of three sources (coated urea, urea
and ammonium sulfate) and five doses (0, 60, 120, 180 and 240 kg ha-1) of N, topdressing, applied in the
surface and in a single dose, when the corn plants were in V4 stage. The hybrid used was the P3646H. We
evaluated the following characters: stem diameter, plant height, height of ear insertion, leaf N, number of ears per plant, ear length, number of rows per ear, number of grains per row, 100 grains mass and grain productivity. All characters have a response to nitrogen fertilization and only the height of ear insertion showed no significant difference between sources. The source coated urea showed the best results, indicating that its
use may be compensatory, especially in favorable conditions for the NH3 volatilization, as the application of
high doses of N in the surface.
Keywords: Nitrogen fertilization. Ammonium sulfate. Urea. Coated urea. Zea mays L..
DESENVOLVIMENTO E PRODUÇÃO DE MILHO EM FUNÇÃO DE DOSES E FONTES DE ADUBOS NITROGENADOS
RESUMO - O nitrogênio (N) é um dos nutrientes que apresenta os efeitos mais expressivos no aumento de
produtividade de grãos, na cultura do milho. Com o objetivo de avaliar o efeito de fontes e doses de N,
aplicadas em cobertura, na cultura do milho cultivado em sistema de semeadura convencional, instalou-se um
experimento no município de Urutaí, Goiás, na safra 2012/13, em Latossolo Vermelho de textura argilosa. O delineamento experimental empregado foi o de blocos casualizados, com quatro repetições, com os tratamentos dispostos em esquema fatorial 3 x 5, constituído por três fontes (ureia revestida, ureia e sulfato de amônio) e
cinco doses (0, 60, 120, 180 e 240 kg ha-1) de N, aplicadas em cobertura, superficialmente e em dose única,
quando as plantas de milho se encontravam em estádio V4. O híbrido utilizado foi o P3646H. Foram avaliados
os seguintes caracteres: diâmetro do colmo, altura de plantas, altura de inserção da espiga, teor de N foliar, número de espigas por planta, comprimento de espiga, número de fileiras de grãos por espiga, número de grãos por fileira, massa de 100 grãos e produtividade de grãos. Todos os caracteres apresentaram resposta à adubação nitrogenada e somente a altura de inserção da espiga não apresentou diferença significativa entre as fontes. A fonte ureia revestida apresentou os melhores resultados, indicando que seu uso pode ser compensatório,
principalmente, em condições favoráveis à volatilização de NH3, como a aplicação de altas doses de N
superficialmente.
Palavras-chave: Adubação nitrogenada. Sulfato de amônio. Ureia. Ureia revestida. Zea mays L..
________________ *Corresponding author
1Received for publication in 09/25/2014; accepted in 06/16/2016.
Paper extracted from monograph the of the first author.
2Department of Agronomy, Instituto Federal Goiano-Campus Urutaí, Urutaí, GO, Brazil; [email protected],
[email protected], [email protected], [email protected], [email protected].
INTRODUCTION
Among the factors that limit the productivity of corn grain, we can highlight the mishandling of fertilizers, especially nitrogen ones (MEIRA, 2006). Nitrogen (N) is one of the nutrients that have the most significant effect on grain productivity increase (QUEIROZ et al., 2011). In this sense, its disability limits the maximum expression of corn potential, so that the mishandling of nitrogen fertilizer can promote the reduction of crop productivitys because refers to the nutrient required in greater quantity by the culture.
In addition to its effect on productivity, N influences on various agronomic characteristics, which are related to the growth and development of plants. In the literature, there are reports on the N influence on plant height (ALBUQUERQUE et al., 2013.), height of ear insertion and leaf N content (FARINELLI; LEMOS, 2010; VALDERRAMA et al., 2011), production of dry matter (DUETE et al., 2008), number of ears per plant (SORATTO et al., 2010), ear length (KAPPES et al., 2009), number of rows per ear (COSTA et al., 2012), number of grains per ear (SOUZA et al., 2011) and grain mass increase (QUEIROZ et al., 2011). Thus, N stands out as a nutrient able to define the components of corn grains production and productivity.
Facing the above results, in part, the studies vary the conditions of soil, climate and agricultural production systems. Thus, generalizations about the management of nitrogen fertilization do not fit here. According to Binotti et al. (2010), the source and the dose of N are important aspects to be considered by farmers. Regarding the dose, corn has shown response to various amounts of N topdressing (VELOZO et al. 2006; MEIRA et al. 2009; QUEIROZ et al. 2011; FARINELLI; LEMOS 2012), what has caused uncertainty about the N dose to be recommended to the farmer.
With respect to sources of nitrogen, these also influence the use of N by plants. According to Martins; Cazetta and Fukuda (2014), most nitrogen fertilizer is water soluble and quickly converted into forms that can be lost by leaching or volatilization as occurs to urea. The losses are reduced when used ammonium sulfate.
A potential alternative is the use of controlled
-release fertilizers, such as coated urea, which has
been used to decrease losses and, thus, provide more N for plants (CAHILL et al. 2010). Although these fertilizers are promising in agriculture, the results have been inconsistent. While Noellsch et al. (2009), demonstrate advantages of using coated urea polymers in corn, others highlight the inefficiency compared with common urea (NELSON et al. 2009, CAHILL et al. 2010, CIVARDI et al. 2011, MARTINS; CAZETTA; FUKUDA, 2014).
Facing the controversial results, and considering the complexity in the management of
nitrogen fertilization, the use of controlled-release
fertilizer can promote changes in the dynamics of N
in the soil-plant-atmosphere system, as losses are
minimized.
In this context, the objective of this study was to evaluate the effect of sources and doses of N topdressing nitrogen fertilizers corn cultures, grown in Cerrado conditions in conventional till system.
MATERIAL AND METHODS
The experiment was conducted in the field, in
the municipality of Urutaí, Goiás, at the
Experimental Farm of the Instituto Federal Goiano
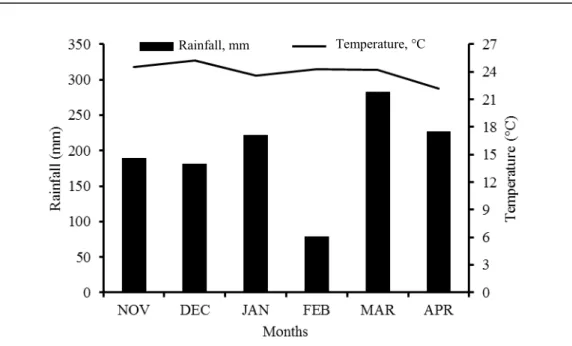
-Campus Urutaí, whose geographical coordinates are 12° 27’ 52” S and 48º 12’ 13” W, with an altitude of 821 metres. According to the international climate classification of Köppen, the climate is Aw, defined as tropical with dry winter season, with an average annual temperature of 22,9ºC, annual average rainfall of 1,336 mm and relative humidity of 65.9% (INMET, 2013). Figure 1 shows the average temperature and total rainfall of each month in the experiment period.
The soil of the experimental area is a distrophic Red Latosol, clayey textured, whose chemical characteristics in the layer from 0 to 0.2 m
deep are: pH (CaCl2) = 5,1; Ca+2 (cmolc dm-3) = 1,9;
Mg+2 (cmol
c dm-3) = 0,8; Al+3 (cmolc dm-3) = 0,1; K+
(cmolc dm-3) = 0,28; P (mg dm-3) = 3,4; V(%) = 53;
M.O. = 25 g dm-3. The area was planted with corn in
the previous harvest to the beginning of the experiment.
The experimental design was a randomized complete block design with four replications, with the treatments arranged in a factorial 3 x 5, consisting of three sources (coated urea, urea and ammonium sulfate) and five doses (0, 60, 120, 180
and 240 kg ha-1) of N, topdressing, applied in the
surface and in a single dose, when the corn plants
were in V4 stage.
The area was prepared in a conventional manner, since the soil was compacted found, precluding direct seeding. For this preparation, one subsoiling was performed, followed by a heavy disking in a depth of ± 0,25 m and two surface disking for harrowing the soil. Sowing was held on 11/20/2012 in furrows opened with a plow attached to a tractor. Fertilization was made in the sorrows
with a manual form, providing 400 kg ha-1 of the
08-28-18 formula, equivalent to the application of 32
kg ha-1 N, 112 kg ha-1 P
2O5 and 72 kg ha-1 K2O. The
use hybrid was Pioneer® P3646H, with a sowing
manually made towards a final population of 70000
plants per hectare, according to the
Rev. Caatinga
Temperature, °C Rainfall, mm
Figure 1. Average temperature and total monthly rainfall variations in the region of Urutaí, Goiás, 2012/13. Source: INMET, 2013.
The experimental plots consisted of six lines with 0.5 m space between rows and 6 m long,
totaling 18 m2 per plot and floor area of 4 m2, as they
were considered for evaluation only the two central lines, being discarded 1 m from each end of the evaluated lines.
The weed control was held on 12/05/2012 by applying the mixture of atrazine and nicosulfuron, at
doses of 2000 and 30 g a.i. ha-1, respectively.
Spraying was done with a rib pump of 20 liters with
spray volume of 250 L ha-1. Nitrogen topdressing
was performed seven days after the application of herbicides in 12/12/2012, when the plants were at the growth stage V4 (four expanded leaves). The fertilizers were spread on the soil surface and at a distance of 0.1 m from the sorrows. At the moment of fertilization, the soil was damp and, only 24 hours later, there was a precipitation intensity of 20 mm. Although it is recommended to divide the
topdressing in corn for doses above 120 kg ha-1, all
treatments were applied in single doses in order to simulate the reality of producers and evaluate the efficiency of fertilizer with inhibitor.
On the occasion of female flowering, they were collected, at the beginning of silking, the central third of three opposing leaves and below the first ear, in ten plants per plot, according to the Coelho et al. (2006) adapted methodology. After
drying in a forced air circulation oven, at 60-70°C,
the leaves were ground in a Wiley mill, and the N content determined by the method described in Malavolta et al. (1997). In the field, the plant height and ear height were determined with the aid of a tape measure graduated in centimeters, measuring the distance between the ground surface and the insertion point of the last sheet, and also to the main ear insertion point, respectively. Stem diameter was measured at a height of 5 cm above the soil level
with the aid of a digital caliper. These determinations were made in the same 10 plants evaluated at random within the floor area of each plot on stage R6 (physiological maturity).
Manual harvesting was carried out 151 days after sowing, on 04/19/2013. At the time the grains had an average of 15% moisture. The average number of ears per plant was determined by making a ratio of the number of corns harvested in the floor area and the number of plants of the floor area. The ears length was measured with a ruler graduated in centimeters in ten husked ears, which were randomly harvested in the floor area of experimental plots. The numbers of rows and grains per row were determined by counting the same ten husked ears.
The ears threshing was carried out using a manual thresher, then it was determined the 100 grains mass by the average of four samples. Grain productivity was determined by weighing all grains from the ten ears harvested and, subsequently, it was
calculated the productivity in kg ha-1. The results of
both assessments were corrected for the grain 130 g
kg-1 moisture, through a meter grain water content,
portable, Gehaka model G800.
The experimental data were subjected to analysis of variance (ANOVA), and when detected significant effect of F test, the averages of sources of N (qualitative treatment) were compared by Tukey test at 5% probability. To analyze the effects of N doses (quantitative treatment), they were compared by regression analysis, at 5% probability, using the software ASSISTAT Version 7.7 beta.
RESULTS AND DISCUSSION
variable, stem diameter (SD), ear insertion (EIH) and ears per plant (EP) in the corn culture (Table 1). Because of that, we started to study the average effect of each factor. The corn plants had a SD increse of, approximately, 2% when the source used
in fertilization was coated urea compared to the average of traditional sources, therefore, not different. The EIH was similar for all sources of N, while the average of coated urea and ammonium sulphate gave 1.7% more EP than the common urea.
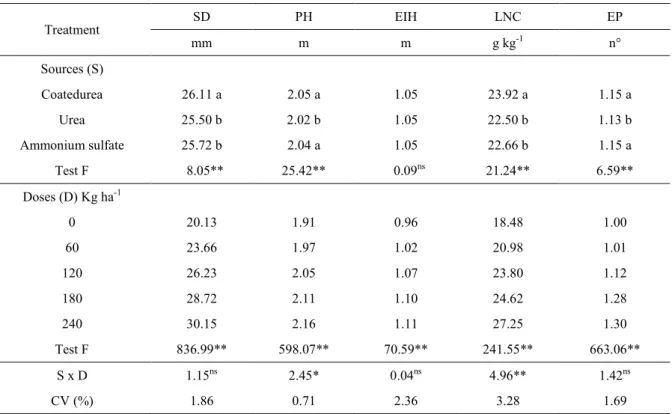
Table 1. Average values of corn stem diameter (SD), plant height (PH), ear insertion height (EIH), leaf N content (LNC) and ears per plant (EP) due to different sources of N topdressing and doses.
Averages in the same column followed by the same letters do not differ by Tukey test at 5% probability (p≤0.05). **,ns: significant (p ≤ 0.01) and not significant, respectively.
The plants fertilized with coated urea showed higher values for SD, EIH and EP as already highlighted. Thus, it is inferred that this source provided higher N use by plants, because the losses were reduced. In contrast, in other studies (MEIRA et al. 2009; SORATTO et al. 2010; CIVARDI et al. 2011), the authors found no differences between urea and sources of slow release, because the application of nitrogen was followed by a irrigation and/or occurred in the middle of a rainy season.
With respect to N doses, a linear effect was observed for SD, EI and EP. Thus, the maximum
dose of 240 kg ha-1 N was insufficient to promote
maximal expression of these characteristics (Figure
2). The plants fertilized with the 240 kg ha-1 N dose
had superiority of 33, 13 and 23%, respectively, for SD, EP and EI, when compared to plants that received no nitrogen fertilization.
The excellent results obtained due to the increase of N topdressing doses confirm the importance of N on growth and development of plants. According to Soratto et al. (2010), in corn
culture, the N promotes increases in various agronomic characteristics, since the plants are nourished properly. As a result, the above authors found that SD and EP values were increased by N doses, while EIH was not affected. Costa et al. (2012) noted the absence of the effect of N topdressing doses in corn cultures in two consecutive harvests, using only urea as source.
These SD results are important from the standpoint of the accumulation of nutrients, which are subsequently moved to the ear. Thus, it is
highlighted that, from the 120 kg ha-1 N dose, we
observed thick stems, enabling the corn increased tolerance to breakage and/or plant toppling. Regarding EIH, although a charactheristic defined by genotype, in this study, there was a linear effect of N doses on EIH, corroborating the results of Duete et al. (2008) and Leal et al. (2013). However, in the studies made by Soratto et al. (2010) and Melo; Cora and Cardoso (2011), the increase in N doses did not influence the EIH, and the values obtained were characteristic of the hybrids tested.
Treatment
SD PH EIH LNC EP
mm m m g kg-1 n°
Sources (S)
Coatedurea 26.11 a 2.05 a 1.05 23.92 a 1.15 a
Urea 25.50 b 2.02 b 1.05 22.50 b 1.13 b
Ammonium sulfate 25.72 b 2.04 a 1.05 22.66 b 1.15 a
Test F 8.05** 25.42** 0.09ns 21.24** 6.59**
Doses (D) Kg ha-1
0 20.13 1.91 0.96 18.48 1.00
60 23.66 1.97 1.02 20.98 1.01
120 26.23 2.05 1.07 23.80 1.12
180 28.72 2.11 1.10 24.62 1.28
240 30.15 2.16 1.11 27.25 1.30
Test F 836.99** 598.07** 70.59** 241.55** 663.06**
S x D 1.15ns 2.45* 0.04ns 4.96** 1.42ns
Rev. Caatinga
Figure 2. Corn stem diameter (a), ear insertion height (b) and ears per plant (c) due to different sources of N topdressing and doses.
For the EP, it was noticeable that this characteristic responded to nitrogen fertilization, however, worth pointing out that the second ear partly showed reduced lenght. According to Veloso et al. (2006), the possibility of a secondary ear being deformed and/or grainless shows that the increase in prolificacy is not always direct increase in corn grain productivity. In this study, the plants that presented secondary ears did not presented them grainless, thus contributing to higher productivity. Albuquerque et al. (2013) highlighted the positive effect of nitrogen fertilization on the increase in the number of grains per hectare, conditioning to increased productivity.
The plant height (PH) and leaf N content (LNC) had interaction with the studied factors, doses and sources of N (Table 2). In HP, when analyzing the factors, the coated urea provided higher PH,
whereas at doses of 120, 180 and 240 kg ha-1 N, the
ammonium sulfate showed similar effect to the coated urea. Pointing out that when the plants were fertilized with coated urea and ammonium sulfate, there was a better use of N, with reflection in greater vegetative growth of plants. In other studies (SORATTO et al. 2010; CIVARDI et al. 2011; VALDERRAMA et al. 2011), the sources of N did not influence the PH when it was applied the same N dose.
Table 2.Corn plant height and leaf N content due to different N topdressing sources and doses.
The averages followed by the same letter in the columns do not differ significantly from each other. It was applied the Tukey test at 5% probability.
Sources
Dose (kg ha-1) Plantheight (m)
0 60 120 180 240
Coatedurea 1.91 a 1.99 a 2.07 a 2.12 a 2.16 a
Urea 1.91 a 1.94 b 2.02 b 2.09 b 2.14 b
Ammonium sulfate 1.91 a 1.96 b 2.05 a 2.12 a 2.16 a
Leaf de N content (g kg-1)
Coatedurea 18.48 a 22.03 a 24.17 a 25.20 a 29.72 a
Urea 18.48 a 20.35 b 23.39 a 24.36 a 25.91 b
The LNC in leaves was different only at doses
of 60 and 240 kg ha-1 N, with the coated urea
resulted in higher levels. On the other hand, at doses
of 120 and 180 kg ha-1 N, the sources did not show
different effects (Table 2). Thus, it was noted that the dose can influence the efficiency of the sources of N. Valderrama et al. (2011) found that the sources of N caused similar levels of N in the leaves varying the
doses from 0 to 120 kg ha-1 of N and attributed the
result, the inefficiency of the coating (polymer), due to the presence of moisture and high soil temperature. In the study by Martins; Cazetta and Fukuda (2014), the LNC was not influenced by the sources of N. In contrast, Souza et al. (2011) found differences in N content, and the common urea provided smaller N content.
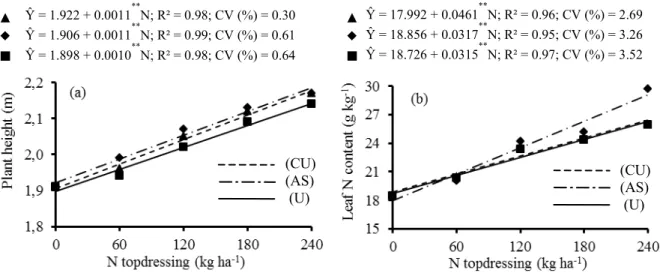
By analyzing the N doses, we found that the PH and LNC characteristics were described by the linear
model, so the dose of 240 kg ha-1 N was insufficient
to promote maximum expression of these characteristics (Figure 3). It is noteworthy that the
use of the 240 kg ha-1 N dose led the plants greater
height of 38, 29 and 29% when used the coated urea, common urea and ammonium sulfate, respectively compared to plants that were not fertilized (Figure 3a). The increase in PH was also observed by Duete et al. (2008), Soratto et al. (2010) in response to N topdressing. According to Albuquerque et al. (2011), PH is a genetic trait influenced by the environment in which the plant develops, thus influenced by the availability of N.
Figure 3. Corn plant height (a) and leaf N content (b) due to different sources N topdressing coated urea (CU), ammonium sulphate (AS) and urea (U) and doses.
Plants fertilized with coated urea showed superiority of 38% LNC compared to plants that grown without fertilization, while the common urea and ammonium sulfate showed superiority of 29%, when made such comparison (Figure 3b). However, in general, LNCs found in this study are below the range considered appropriate, ranging from 28 to
35 g dm-3 according to Malavolta (2006). However,
we highlight that only when used the source coated
urea with the 240 kg ha-1 N dose, the LNC value was
taken as appropriate. Soratto et al. (2010), using various sources of N whose doses ranged from 0 to
120 kg ha-1, observed adequate LNC, this result
demonstrates the importance of considering the contribution of crop residues and mineralization of soil organic matter, in the management of nitrogen fertilization. The linear increase in the LNC was also observed in other studies (SORATTO et al. 2010; VALDERRAMA et al. 2011; COSTA et al. 2012). Although leaf N appropriate levels are recommended
to exploit the maximum potential of the production of corn, they not always obtain high productivity. Melo; Cora and Cardoso (2011) found that higher nitrogen topdressing doses provided an increase in the shoot N content, accompanied by a decrease in grain productivity and stressed that excess N caused a "luxury" consumption by the plant.
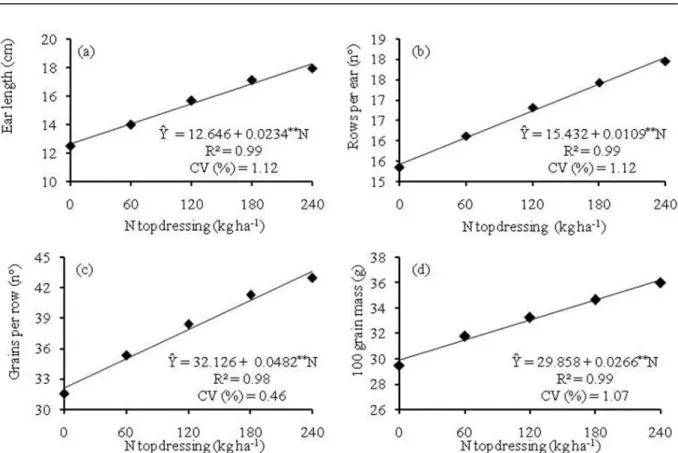
Regarding ear components, there was no interaction of the studied factors for ear length (EL), number of grains per row (NGR), number of rows per ear (NRE),100 grains mass (100M), we soon started study the average effects of each factor. Plants fertilized with coated urea presented larger EL, being larger by 1.3% compared to average of the plants fertilized with common urea and ammonium sulfate (Table 3). Civardi et al. (2011) evaluated a single N dose and observed differences in ears size, higher than 6% when they used common urea, which they incorporated into the soil, compared with urea polymer applied superficially.
Ŷ = 1.922 + 0.0011**N; R² = 0.98; CV (%) = 0.30 Ŷ = 1.906 + 0.0011**N; R² = 0.99; CV (%) = 0.61 Ŷ = 1.898 + 0.0010**N; R² = 0.98; CV (%) = 0.64
(CU) (AS) (U)
Ŷ = 17.992 + 0.0461**N; R² = 0.96; CV (%) = 2.69 Ŷ = 18.856 + 0.0317**N; R² = 0.95; CV (%) = 3.26 Ŷ = 18.726 + 0.0315**N; R² = 0.97; CV (%) = 3.52
Rev. Caatinga
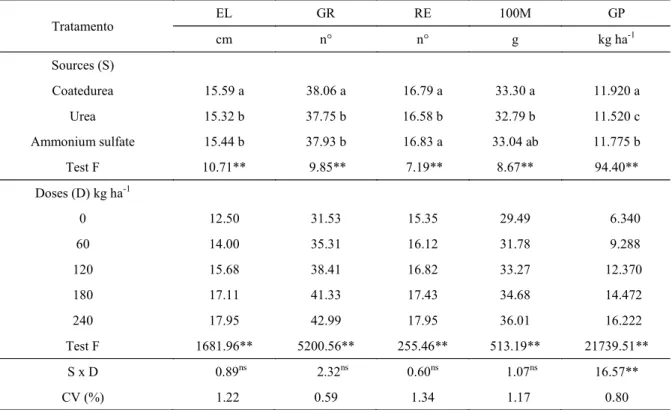
Table 3. Average values of ear length (EL), grains per row (GR), rows per ear (RE), 100 grains mass(100M) and grain productivity (GP) due to different sources of N topdressing and doses.
Averages in the same column followed by the same letters do not differ by Tukey test at 5% probability (p≤0,05). **,ns:
significant (p ≤ 0,01) and not significant, respectively.
The ears produced by the plants, wherein the source of nitrogen used was coated urea, had higher NGR by approximately 1% from the common urea and ammonium sulfate average. For the NRE, the sources coated urea and ammonium sulfate were 1% higher than common urea while for 100M, the coated urea demonstrated superiority of 2% compared to common urea, not differing from ammonium sulfate (Table 3). In the study by Meira et al. (2009) and Souza et al. (2011), no differences were found for the NGR, NRE and 100M due to different soluble
and slow-release sources of nitrogen. The lack of
response is because soon after the application of N it was held irrigation, reducing the volatilization of
N-NH3. Valderrama et al. (2011) found no
differences in these ears components, in view of the presence of elevated moisture and temperature in the soil.
Regarding the N doses, EL, NGR, NRE and
100M set to the linear model. The 240 kg ha-1 N dose
was not enough to promote maximum expression of these ear components (Figure 4).The 100M showed
superiority of 18% at the 240 kg ha-1 N dose
compared to grain mass of plants that had not received the N topdressing (Figure 4d). Costa et al.
(2012) and Farinelli and Lemos (2012) found that the 100M showed linear behavior, unlike Soratto et al. (2010), who obtained quadratic behavior, setting the
78.5 kg ha-1 N dose able to provide greater grain
mass, while Valderrama et al. (2011) found no effect of N rates on the grain mass and claim that the responses of this component to nitrogen fertilization have been very variable.
Regarding grain productivity, the unfolding of the interaction between sources of N and doses indicates superiority of coated urea and ammonium sulfate to the common urea in all tested doses (Table 4). The average of the sources coated urea and ammonium sulfate, in different doses, 60, 120, 180
and 240 kg ha-1 was 2, 3, 4 and 5% respectively
higher in comparison with the common urea. These results do not agree with those obtained by Meira et al. (2009), as grain productivity did not vary between sources of N, in the case, Entec®, ammonium sulfate and urea. Similarly, Souza et al. (2011) and Valderrama et al. (2011) also found no differences in productivity between the soluble and slow release sources, which should be linked to the fact that corn, after topdressing, have been irrigated.
Tratamento
EL GR RE 100M GP
cm n° n° g kg ha-1
Sources (S)
Coatedurea 15.59 a 38.06 a 16.79 a 33.30 a 11.920 a
Urea 15.32 b 37.75 b 16.58 b 32.79 b 11.520 c
Ammonium sulfate 15.44 b 37.93 b 16.83 a 33.04 ab 11.775 b
Test F 10.71** 9.85** 7.19** 8.67** 94.40**
Doses (D) kg ha-1
0 12.50 31.53 15.35 29.49 6.340
60 14.00 35.31 16.12 31.78 9.288
120 15.68 38.41 16.82 33.27 12.370
180 17.11 41.33 17.43 34.68 14.472
240 17.95 42.99 17.95 36.01 16.222
Test F 1681.96** 5200.56** 255.46** 513.19** 21739.51**
S x D 0.89ns 2.32ns 0.60ns 1.07ns 16.57**
Table 4.Corn grain productivity (kg ha-1) due to different sources N topdressing and doses.
The averages followed by the same letter in the columns do not differ significantly from each other. It was applied the Tukey test at 5% probability.
Regarding the N topdressing doses, the grain productivity set up, again, a linear model (Figure 5).
The 240 kg ha-1 N dose promoted 61% increase in
productivity compared with the plants that were not fertilized with N topdressing.
Figure 5. Corn grain productivity (GY) due to different sources of N topdressing and doses. Ŷ = 6739.3 + 43.17**N; R² = 0.99;CV (%) = 0.68 Ŷ = 6748.8 + 42.81**N; R² = 0.99;CV (%) = 0.92 Ŷ = 6790.3 + 39.41**N; R² = 0.98;CV (%) = 0.88
(CU) (AS) (U)
Figure 4. Ear length (a), rows per ear (b), grains per row (c) and 100 corn grains mass (d) due to different N topdressing doses.
Sources
Dose (kg ha-1) Productivity (kg ha-1)
0 60 120 180 240
Coatedurea 6340 a 9388 a 12514 a 14748 a 16613 a
Urea 6340 a 9205 b 12206 b 14163 b 15685 b
Rev. Caatinga
In other studies (SORATTO et al. 2010; VALDERRAMA et al. 2011; COSTA et al. 2012), similar linear responses in function to N doses were also found. On the other hand, Veloso et al. (2006), Farinelli and Lemos (2010) and Melo; Cora and Cardoso (2011), when evaluating N doses, obtained quadratic response in function of N doses, with
estimated doses of 180, 92 and 120 kg ha-1 N,
respectively.
It is noteworthy that in soils with adequate moisture and high temperature, hydrolysis of much
part of the urea can occur in a short time. Pereira et al. (2009), evaluating the volatilization of
ammonia in the soil cultivated with corn, due to
different sources of nitrogen, observed N-NH3 peak
loss until the second day after fertilization. As in the present study, the topdressing was made superficially, in a single dose, with the wet soil, causing a rain only 24 hours later, may probably have occurred volatilization of much of the N independent of the used sources. This observation is endorsed by the fact that it was not obtained the maximum expression of the corn productivity
potential with the 240 kg ha-1 N dose.
CONCLUSIONS
The agronomic characteristics, stem diameter, plant height, leaf N content and ear per plant, and the ear components, length, number of grains per row, number of rows and 100 grains mass are lower when fertilized with the source urea.
The doses of N promote linear effect on all agronomic characteristics and ear components.
The sources coated urea and ammonium sulfate have similar agronomic efficiency on corn grain productivity.
The dose of 240 kg ha-1 N was not enough for
maximum grain potential expression and confirms the high demand of N by corn.
REFERENCES
ALBUQUERQUE, A. W. et al. Plantas de cobertura e adubação nitrogenada na produção de milho em
sistema de plantio direto. Revista Brasileira de
Engenharia Agrícola e Ambiental, Campina
Grande, v. 17, n. 7, p. 721-726, 2013.
BINOTTI, F. F. S. et al. Fontes, doses e modo de aplicação de nitrogênio em feijoeiro no sistema
plantio direto. Bragantia, Campinas, v. 68, n. 2, p.
473-481, 2009.
CAHILL, S. et al. Evaluation of alternative nitrogen fertilizers for corn and winter wheat production.
Agronomy Journal, Madison, v. 102, n. 4,
p. 1226-1236, 2010.
CIVARDI, E. A. et al. Ureia de liberação lenta aplicada superficialmente e ureia comum incorporada ao solo no rendimento do milho.
Pesquisa Agropecuária Tropical, Goiânia, v. 41,
n. 1, p. 52-59, 2011.
COELHO, A. M. et al. Cultivo do milho. Embrapa
Milho e Sorgo. 2ª Edição. 2006. (Sistema de Produção 1. Versão Eletrônica). Disponível em:
<http://sistemasdeproducao.cnptia.embrapa.br/
FontesHTML/Milho/CultivodoMilho_2ed/ ferdiagnose.htm>. Acesso em: 12 ago. 2013.
COSTA, N. R. et al. Adubação nitrogenada no consórcio de milho com duas espécies de braquiária
em sistema plantio direto. Pesquisa Agropecuária
Brasileira, Brasília, v. 47, n. 8, p. 1038-1047, 2012.
DUETE, R. R. C. et al. Manejo da adubação
nitrogenada e utilização do nitrogênio (15N) pelo
milho em Latossolo Vermelho. Revista Brasileira
de Ciência do Solo,Viçosa, v. 32, n. 1, p. 161-171, 2008.
FARINELLI, R.; LEMOS, L. B. Nitrogênio em cobertura na cultura do milho em preparo
convencional e plantio direto consolidados. Pesquisa
Agropecuária Tropical, Goiânia, v. 42, n. 1,
p. 63-70, 2012.
INMET – Instituto Nacional de Meteorologia.
Disponível em; <http://www.inmet.gov.br/portal/ index.php?r=bdmep/bdmep>. Acesso em 09 ago.
2013.
LEAL, A. J. F. et al. Adubação nitrogenada para milho com o uso de plantas de cobertura e modos de
aplicação de calcário. Revista Brasileira de Ciência
do Solo, Viçosa, v. 37, n. 2, p. 491-501, 2013.
MALAVOLTA, E. Manual de nutrição mineral de
plantas. Piracicaba, SP: Editora Ceres, 2006. 631 p.
MALAVOLTA, E. et al. Avaliação do estado
nutricional das plantas: princípios e aplicações 2.
ed. Piracicaba, SP: Associação Brasileira para Pesquisa da Potassa e do Fosfato, 1997. 319 p.
MARTINS, I. S. et al. Condições, modos de aplicação e doses de ureia revestida por polímeros na
cultura do milho. Pesquisa Agropecuária Tropical,
Goiânia, v. 44, n. 3, p. 271-279, 2014.
MEIRA, F. A. et al. Fontes e épocas de aplicação do nitrogênio na cultura do milho irrigado. Semina:
MEIRA, F. A. Fontes e modos de aplicação do nitrogênio na cultura do milho. 2006. 46 f. Tese (Doutorado em Agronomia: Área de Concentração
em Sistemas de Produção) – Universidade Estadual Paulista, Ilha Solteira, 2006.
MELO, F. B. et al. Fertilização nitrogenada, densidade de plantas e rendimento de milho
cultivado no sistema plantio direto. Revista Ciência
Agronômica, Fortaleza, v. 42, n. 1, p. 27-31. 2011.
NELSON, K. A. et al. Effect of polymer coated urea, irrigation, and drainage on nitrogen utilization and
yield of corn in a claypan soil. Agronomy Journal,
Madison, v. 101, n. 3, p. 681-687, 2009.
NOELLSCH, A. J. et al. Corn response to
conventional and slow-release nitrogen fertilizers
across a claypan landscape. Agronomy Journal,
Madison, v. 101, n. 3, p. 607-614, 2009.
PEREIRA, H. S. et al. Ammonia volatilization of
urea in the out-of-season corn. Revista Brasileira de
Ciência do Solo, Viçosa, v. 33, n. 6, p. 1685-1694,
2009.
QUEIROZ, A. M. et al. Avaliação de diferentes fontes e doses de nitrogênio na adubação da cultura
do milho (Zea mays L.). Revista Brasileira de
Milho e Sorgo, Sete Lagoas, v. 10, n. 3, p. 257-266, 2011.
SORATTO, R. P. et al. Fontes Alternativas e doses
de nitrogênio no milho safrinha em sucessão à soja.
Revista Ciência Agronômica, Fortaleza, v. 41, n. 4,
p. 511-518. 2010.
SOUZA, J. A. et al. Adubação nitrogenada na cultura do milho safrinha irrigado em plantio direto.
Bragantia, Campinas, v. 70, n. 2, p. 447-454, 2011.
VALDERRAMA, M. et al. Fontes e doses de NPK
em milho irrigado sob plantio direto. Pesquisa
Agropecuária Tropical, Goiânia, v. 41, n. 2,
p. 254-263, 2011.
VELOSO, M. E. C. et al. Doses de nitrogênio na cultura do milho, em solos de várzea, sob sistema de
drenagem subterrânea. Revista Brasileira de Milho