Temporal variability of nitrogen and phosphorus concentrations
in a German catchment: Water sampling implication
1Cristiano A. Pott
2, Sidnei O. Jadoski
3, Britta Schmalz
4, Georg Hörmann
5& Nicola Fohrer
61 Part of the PhD thesis of the first author
2 Universidade Estadual do Centro-Oeste, Guarapuava, PR, E-mail: [email protected] (Author correspondent) 3 Universidade Estadual do Centro-Oeste, Guarapuava, PR, E-mail: [email protected]
4 Institute for Natural Resource Conservation, Christian-Albrechts-University, Kiel, Germany, E-mail: [email protected] 5 Institute for Natural Resource Conservation, Christian-Albrechts-University, Kiel, Germany, E-mail: [email protected] 6 Institute for Natural Resource Conservation, Christian-Albrechts-University, Kiel, Germany, E-mail: [email protected]
A B S T R A C T
Daily time series were used to verify the temporal variability and to characterize the nitrogen (N) and phosphorus (P) pollution in a 462 km² catchment of the Stör river, a typical rural lowland catchment in Germany. Also, this study aimed to identify the best sampling frequency of pollution by N and P. Total phosphorus (TP), soluble orthophosphate-phosphorus (PO4-P), particulate-phosphorus (PP), total nitrogen (TN), nitrate-nitrogen (NO3-N) ammonium-nitrogen (NH4-N) and total suspended sediment (TSS) were analysed. Daily monitoring from August 8, 2009 until August 10, 2011 was conducted with an automatic water sampler at the outlet of the catchment. The results show a seasonal variability of water quality parameters with more N and P concentration in winter. PP represents the major part of P and it is highly dependent on TSS. NO3-N constitutes the major part of N. Autocorrelation analysis was successfully applied to characterize the N and P pollution in the Upper River Stör. The water sampling for N and P monitoring must be different, N can be sampled biweekly or monthly, while P must be sampled with more frequency, weekly or biweekly.
Variabilidade temporal das concentrações de nitrogênio e fósforo
em bacia hidrográfica alemã: Implicações na amostragem da água
R E S U M O
Séries temporais diárias foram utilizadas para verificar a variabilidade temporal e caracterizar a poluição por nitrogênio (N) e fósforo (P) em 462 km² da Bacia Hidrográfica do Rio Stör, uma típica bacia hidrográfica rural de várzea na Alemanha. Este estudo objetivou identificar a melhor frequência de amostragem da poluição por N e P. Foram analisados fósforo total (TP), P-ortofosfato solúvel (PO4-P), P particulado (PP), N total (TN), N-nitrato (NO3-N) e N-amônio (NH4-N) além de sedimento total em suspensão (TSS). Um monitoramento diário foi realizado de 8 de agosto de 2009 até 10 de agosto de 2011, com um amostrador automático de água na saída da bacia hidrográfica cujos resultados indicam uma variabilidade sazonal dos parâmetros de qualidade da água com maior concentração de N e P no inverno. PP representa a maior parte de P e é bastante dependente do TSS. NO3-N constitui a maior parte de N. Analise de autocorrelação foi aplicada com êxito para caracterizar a poluição por N e P na parte superior do Rio Stör. A amostragem de água para monitoramento de N e P deve ser diferente, N pode ter amostragem quinzenal ou mensal enquanto P precisa ter amostragem com maior frequência, semanal ou quinzenal. Key words:
water quality nitrate phosphate autocorrelation automatic water sampler seasonal variability
Palavras-chave: qualidade da água nitrato
fosfato autocorrelação
amostrador automático de água variabilidade sazonal
Revista Brasileira de
Engenharia Agrícola e Ambiental
Campina Grande, PB, UAEA/UFCG – http://www.agriambi.com.br Protocolo 191.13 – 13/06/2013 • Aprovado em 14/03/2014
ISSN 1807-1929
v.18, n.8, p.811–818, 2014
Introduction
Water pollution problems have been encountered all over the world in the last decades (Pereira et al., 2009; Rothwell et al., 2010; Bouraoui & Grizzetti, 2011). In surface water bodies, the input of nitrogen (N) and phosphorus (P) plays an important role in water quality, because these nutrients are essential for phytoplankton growth and consequently for water eutrophication (Wu et al., 2011). Among ecosystems with a high risk of water pollution, lowland catchments are frequently affected by N and P pollution due to the intense interaction between the aquatic and terrestrial systems (Schmalz et al.,
2009). N and P enter into aquatic systems via point and point sources (Lam et al., 2010). In rural catchments, the non-point pollution is of considerable importance and depends on land use and management (Lam et al., 2010).
According to Skarbøvik et al. (2012), it is often difficult to obtain reliable estimates of the amounts of pollutants transported in rivers and streams due to the high temporal variability in the concentrations of these substances. Studies indicate use of daily (Sileika et al., 2005; Lam et al., 2010), weekly (Schmalz et al., 2007), biweekly (Jaji et al., 2007), monthly (Rothwell et al., 2010; Tao et al., 2010), bimonthly (Özcan et al., 2007) or seasonal sampling (Bu et al., 2011).
According to Lu et al. (2011), environmental monitoring programs need to include daily monitoring in water quality studies. The daily monitoring is important to verify the real dynamics of the water quality, such as peaks of nutrient concentration at specific times, and could help to understand the water quality variability over the time. On the other hand, highly resolution database, with a high number of water samples is extremely laborious and expensive.
A solution to set a realistic frequency of water sampling could be the use of autocorrelation (AC) of environmental data. AC is the correlation of each parameter with itself over a daily time series (Box et al., 2008). These authors used autocorrelation analysis of a time series as a tool to check the stability of environmental parameters in a water quality database. According to Alewell et al. (2004) parameters with high autocorrelation are very stable, requiring a smaller sampling interval than others with low autocorrelation parameters.
Thus, the objectives of this study are (i) to verify the temporal variability of water quality using daily monitoring to assess N and P pollution; (ii) identify the characteristics of N and P pollution and (iii) identify the best frequency of water sampling to characterize the water pollution.
Material and Methods
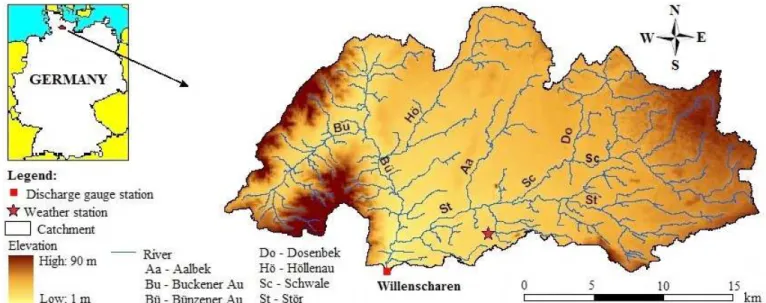
The River Stör, a tributary of the River Elbe is located in the lowland area of Schleswig-Holstein in Northern Germany (Figure 1).
In this study, 462 km² of the upper part of the Stör catchment up to the gauge station Willenscharen were sampled, because the lower part is already influenced by the tide of the North Sea. The topography is very flat and varies between 90 and 1 m above sea level. The main tributaries of the upper Stör are the Aalbek, Buckener Au, Bünzener Au, Dosenbek, Höllenau and Schwale (Figure 1). The main soils in the upper Stör catchment are Histosol, Gley, Gley-Podsol, Cambisol, Podsol, Planosol and Luvisol (Finnern, 1997). The mean annual precipitation is 851 mm and the mean annual temperature 8.2 ºC (DWD, 2012). According to Oppelt et al. (2011), land use is dominated by arable (42.1%) and pasture land (33.1%). The major crops used in agricultural areas are winter wheat (13.7%), rapeseed (1.8%) and corn for silage (26.6%) (Oppelt et al., 2011). The urban area represents around 10% of the total area. The most important city is Neumünster with nearly 88,000 citizens.
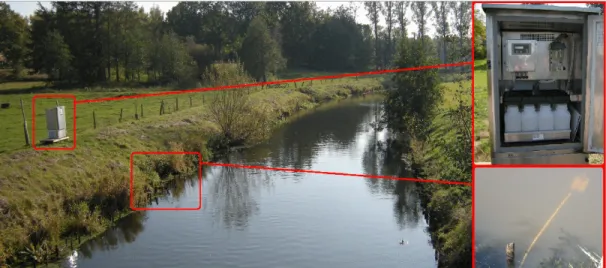
Water samples were taken using an automatic water sampler MAXX SP III© located at the gauge station Willenscharen (Figure 2). The water tube collector was installed into the River Stör at a distance of 2 m from the riverbank and at a depth of 0.30 m above the river bed, attached to a rock (Figure 2).
Water samples were collected at an interval of 72 min, making 20 subsamples per day. The automatic water sampler had a storage capacity of up to 12 water bottles of 2.9 L. The temperature in the sampler was kept constant between 3 and 5 °C. The water samples were brought to the laboratory on Tuesdays and Fridays alternatively, resulting in a storage time of 10 to 11 days. Each daily sample contained around 2 L of water. On sampling days, water temperature (WT) was determined in situ using a multiparameter water quality monitoring instrument. The monitoring period lasted from August 8, 2009 until August 10, 2011. Daily discharge (Q) data from August 2009 until July 2011 was provided by LKN (2012). Daily precipitation (PCP) for the study period was obtained by German Weather Service, concerning the station Padenstedt (DWD, 2012).
Water samples were prepared and analysed in the laboratory of the Department of Hydrology and Water Resources Management at Christian-Albrechts-University Kiel in Germany. Total P (TP), soluble orthophosphate-P (PO4-P), total N (TN), nitrate-N (NO3-N) and ammonium-N (NH4-N) were analysed. TP, PO4-P and NH4-N were determined by spectrophotometry, TN was determined by chemiluminescence detection and NO3-N was analysed by ion chromatography. Particulate phosphorus (PP) represents the fraction absorbed by soil particles and organic matter. It was calculated as the difference between TP and PO4-P. In addition, the total suspended sediment (TSS) concentration was determined by filtering 1.0 L of water sample through 0.45 μm filter paper and then dried at 105 ºC.
TP, PO4-P, TN, NO3-N and NH4-N data set were used to determine the water quality according to the German LAWA (1998) classification. Table 1 shows the classes and the corresponding TP, PO4-P, TN, NO3-N and NH4-N thresholds for the LAWA classification. The aim of WFD is to achieve the "good status", which corresponds to LAWA class II, in all surface water bodies until 2015 (EC, 2000). For all statistical analysis the R program (www.r-project.org) was used. Correlogram was used to represent the Pearson correlation among the water quality parameters. Autocorrelation (AC) was used to determine the correlation of each water quality parameter with itself through a daily time series (Box et al., 2008). AC analysis were carried out with the function “acf ”. The maximum lag time was set to 100 days. All time series data was aggregated to values based on
the hydrological year with winter from November 1 until April 30 and summer from May 1 until October 31.
Based on the daily measured database, alternative intervals of water sampling were compared: 7 days (weekly), 14 days (biweekly), 30 days (monthly) and 60 days (bimonthly), intervals frequently encountered in practice, i.e. one week to two months. To compose the data for each treatment, it was stipulated a certain day (of the week or month) for sample collection in the database. In practice, when sampling occurs weekly or monthly, it is set one day a week to collect the sample (e.g., every Monday to collect weekly or every Wednesday in the middle of the month for monthly collection, and so on). For this comparison, box-percentile-plots were carried out around the selected sampling intervals. The box-percentile plot shows the average value, median, maximum and minimum, beyond each 10th percentile.
Results and Discussion
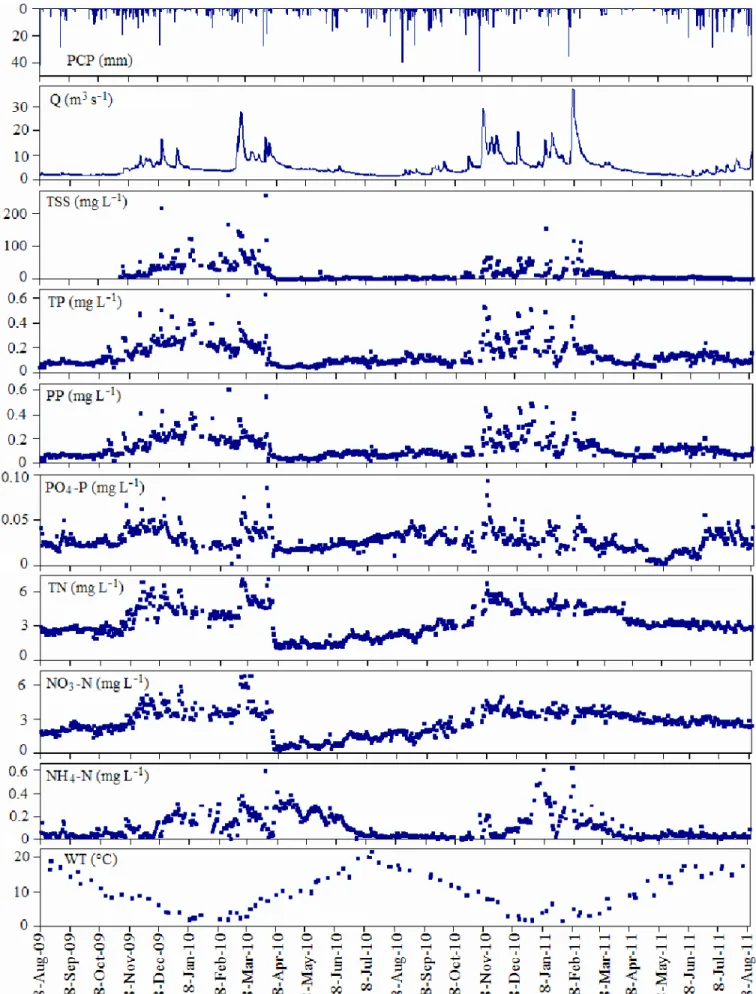
The time series of PCP, Q, TSS, TP, PP, PO4-P, TN, NO3-N, NH4-N, and WT are shown in Figure 3. The high resolution data set allows us to show the real dynamics of N and P pollution in the upper river Stör. The highest peaks of Q are associated with rainfall events, which are more evident in the winter months. TSS, TP, PP, PO4-P, TN, NO3-N and NH4-N, concentrations have a distinct seasonal trend with higher concentrations in winter. To test the seasonality, the time series were aggregated to seasonal values (Figure 4) based on the hydrological year,
Figure 2. Automatic water sampler MAXX SP III© installed at the gauge station Willenscharen, Germany
Classes Description TP PO4-P TN NO3-N NH4-N
mg L-1
I Unpolluted ≤ 0.05 ≤ 0.02 ≤ 1.0 ≤ 1.0 ≤ 0.04
I-II Lightly polluted ≤ 0.08 ≤ 0.04 ≤ 1.5 ≤ 1.5 ≤ 0.10
II Moderately polluted ≤ 0.15 ≤ 0.10 ≤ 3.0 ≤ 2.5 ≤ 0.30
II-III Critically polluted ≤ 0.30 ≤ 0.20 ≤ 6.0 ≤ 5.0 ≤ 0.60
III Heavily contaminated ≤ 0.60 ≤ 0.40 ≤ 12.0 ≤ 10.0 ≤ 1.20
III-IV Very heavily contaminated ≤ 1.20 ≤ 0.80 ≤ 24.0 ≤ 20.0 ≤ 2.40
IV Excessively contaminated > 1.20 > 0.80 > 24.0 > 20.0 > 2.40
Table 1. Water quality classes for surface water bodies according to German LAWA (1998) classification and their
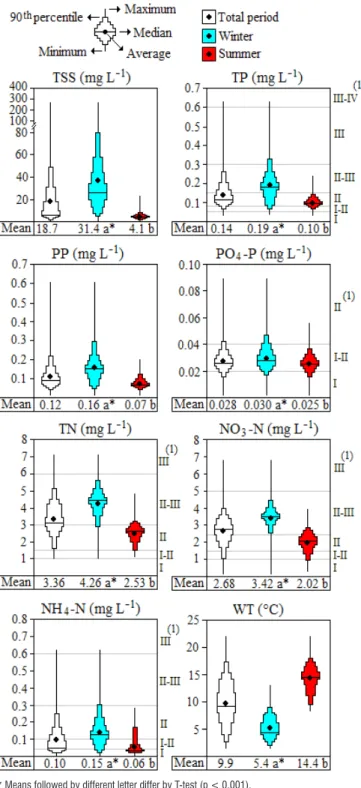
(moderately polluted) in winter and class I-II (lightly polluted) in summer. TN and NO3-N are ranked in class II-III in both periods. NH4-N is ranked in class II-III in winter and class II in summer, achieving the goals of the EC (2000).
The higher TSS concentration in winter may be related to a higher erosion potential, when many agricultural fields are uncovered. In addition, water absorption and nutrient uptake by plants and by macrophytes during the winter is lower (Desmet et al., 2011) causing a higher runoff flow, which in turn leads to surface and riverbank erosion. In summer the riparian vegetation also plays an important role in the minimization of the TSS, and N and P transport into the river.
Figure 5 shows the correlogram between the physicochemical parameters of the Upper River Stör at the gauge Willenscharen. Two stronger statistical correlations were found, one between TP and PP (r = 0.99), another one between TN and NO3-N (r = 0.95). This occurs because PP represents the major part of TP (on average 77%) and NO3-N is the dominant part of TN (on average 78%). This fact also explains the similarity of the time series of TP and PP and of TN and NO3-N in Figure 3. TSS had also a strong positive correlation with TP and PP showing that P is highly bound to soil particles. Tao et al. (2010) also verified a strong correlation between TP and TSS (r = 0.97). This means that P comes especially from sediment transport by erosion from agricultural areas and from riverbank erosion. Q had a significant positive correlation with all N and P parameters. Statistically negative correlations were found between WT and all other physicochemical parameters, confirming the effect of seasonality verified in Figure 4.
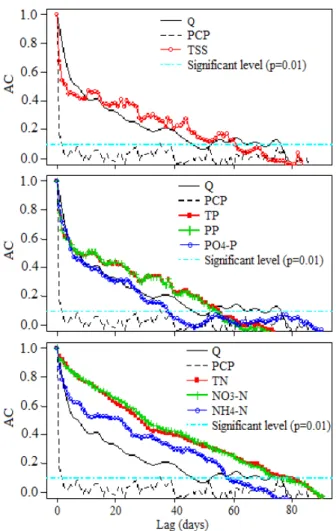
AC plots of PCP, Q, TSS, TP, PP, PO4-P, TN, NO3-N and NH4-N are shown in Figure 6. First, it is necessary to analyse
Figure 4. Box-percentile-plots from TSS, TP, PP, PO4-P, TN, NO3-N, NH4-N and WT values of the Upper River Stör at the gauge Willenscharen, Germany
with the winter going from November 1 to April 30 and summer from May 1 until October 31. TSS, TP, PP, PO4-P, TN, NO3-N, NH4-N and WT values are significantly different based on T-test for the winter months when compared to the summer months. According to the 90th percentile (Figure 4),
TP is ranked in class III (heavily contaminated) in winter and class II (moderately polluted) in summer, thus TP reached the "good status" desired by EC (2000). PO4-P is ranked in class II
Bold numbers represent statistical significant correlation (p < 0.01)
Figure 5. Correlogram between the physicochemical parameters of the Upper River Stör at the gauge Willenscharen, Germany
* Means followed by different letter differ by T-test (p < 0.001).
the series PCP and the series Q. The series PCP show a very sharp decline in the autocorrelation curve indicating a very unpredictable behavior. On the other side, the autocorrelation curve of the series Q is quite high, being statistically significant up to 45 days. This indicates that the river flow is not much influenced by rainfall, but by groundwater flow, which is characteristic of lowland catchments.
AC of TSS can be divided into two stages. One has a very steep decline up to four days, showing a similar trend as PCP. The other stage has a slower decrease, similar to the series Q. Therefore it indicates that TSS is related to the effects of precipitation, as a result of the surface runoff process. AC of TP, PP and PO4-P follow the same trend as the AC of TSS. This fact was expected because of the high correlation between these parameters (Figure 5). Normally hilly catchments have higher P losses and soil erosion (Sileika et al., 2005). However, the high correlation of PP and PT with TSS (Figure 5, r = 0.81 for both) and the sharp initial curve of the AC of PP and PT (Figure 6) confirm the influence of surface processes, such as runoff and soil erosion on the P pollution also for this lowland catchment. Even in rivers with a "good status" of PO4-P throughout the year, TSS can keep high for a long time and play an important role as source of PO4 in water bodies (Pereira et al., 2009).
AC of NH4-N follows a similar trend as the one of TSS with an initially stronger decline and subsequently a slower decrease. AC of TN and NO3-N are higher and longer than the AC of Q, being statistically significant up to 78 and 74 days respectively. Alewell et al. (2004) found a strong AC of NO3-N in a semi-natural catchment, with predominantly forest and pasture areas. In agricultural catchments, this behavior should be different due to peaks of NO3-N concentration after fertilizer application (Tisseuil et al., 2008). However, peaks with higher levels of NO3-N at the time of fertilizer application were not observed. In addition, the AC of NO3-N was really high. The high AC of NO3-N suggests that there is a constant transport of NO3-N concentration via leaching, which may be explained by the following: (i) a large amount of N stored in the soil has a slow but continuous mineralization rate of the organic matter (Sileika et al., 2006) and (ii) it is due to the catchment buffering potential (Cherry et al., 2008).
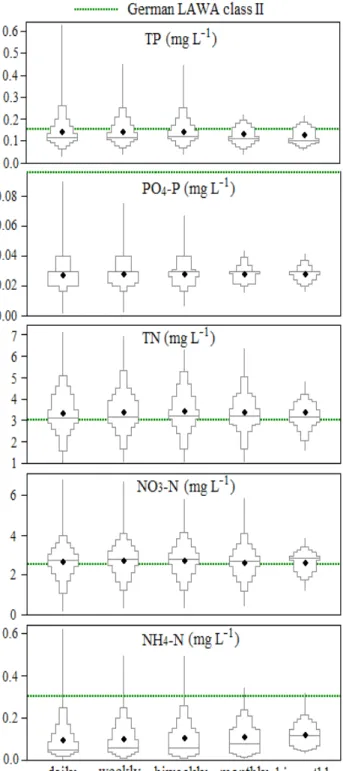
The results of the comparison of daily measured database with weekly, biweekly, monthly and bimonthly data of TP, PO4-P, TN, NO3-N and NH4-N are shown as box percentile plot in Figure 7. A decrease of the amplitude of each data set of water quality was observed, especially by increasing the 10th percentile and decreasing the values of the 90th percentile,
owing to the increase in the sampling frequency. This means that the higher sampling frequency decreases the chances of collecting samples with high or low concentration of an element. Different sampling strategies showed no statistical difference between the means of the parameters studied. Box percentile plots of TP and PO4-P showed low amplitude for monthly and bimonthly sampling strategies, while TN, NO3-N represented only low amplitude at the bimonthly sampling. This tendency is in accordance with the results of autocorrelation of Figure 6, where TN and NO3-N showed high stability when compared with TP and PO4-P.
In this example, the sampling strategy does no effect the 90th
percentile (Figure 7), which represents the "good status" desired by EC (2000). But, it is clear that the decrease of amplitude can affect the water quality classification, when scarce water samples are used to represent the water quality status.
Based on the results of the autocorrelation (Figure 6) and the comparison of sampling frequency (Figure 7) different strategies for water sampling can be advised. P is more influenced by surface runoff process and N by groundwater processes. Therefore, N can be sampled with a greater interval than P. So, when daily sampling is not possible to show the dynamic, which is important in studies of calibration of ecohydrological modeling (Lam et al., 2010). It is recommended weekly or biweekly sampling for P studies and biweekly or monthly sampling interval for N studies, aiming to have enough samples representation to characterize the water quality of a stream in a lowland catchment. Thus, the information obtained with this study can help managing catchments and can help researchers improving the monitoring program of water quality in catchments with similar conditions in the future.
4. The high correlation between total suspended sediment and particulate phosphorus, as well as the initially strong decrease in autocorrelation of these parameters, indicate an influence of surface erosion process.
5. Water sampling for nitrogen and phosphorus monitoring must be different, nitrogen can be sampled biweekly or monthly, while phosphorus must be sampled with more frequency, weekly or biweekly.
Acknowledgments
We would like to thank the Coordenação de Aperfeiçoamento de Pessoal de Nível Superior (CAPES) for the doctorate scholarship of the first author. Special thanks should be expressed to Hans-Jürgen Voß for his help with field sampling. Monika Westphal, Bettina Hollmann and Inke Meyer, we are grateful for the assistance with the laboratory analysis. We also thank Jens Leverkühne from LKN-Schleswig-Holstein for providing the discharge data set from the gauge station Willenscharen.
Literature Cited
Alewell, C.; Lischeid, G.; Hell, U.; Manderscheid, B. High temporal resolution of ion fluxes in semi-natural ecosystems: Gain of information or waste of resources? Biogeochemistry, v.69, p.19-35, 2004.
Bouraoui, F.; Grizzetti, B. Long term change of nutrient concentrations of rivers discharging in European seas. Science of the Total Environment, v.409, p.4899-4916, 2011. Box, G. P.; Jenkins, G. M.; Reinsel, G. C. Time series analysis:
Forecasting and control. 4. edition, New Jersey: Wiley, 2008. 784p.
Bu, H.; Meng, W.; Zhang, Y. Nitrogen pollution and source identification in the Haicheng river basin in Northeast China. Science of the Total Environment, v.409, p.3394-3402, 2011.
Cherry, K. A.; Shepherd, M.; Withers, P.; Mooney, S. J. Assessing the effectiveness of actions to mitigate nutrient loss from agriculture: A review of methods. Science of the Total Environment, v.406, p.1-23, 2008.
Desmet, N. J. S.; Belleghem, S. van; Seuntjens, P.; Bouma, T. J.; Buis, K.; Meire, P. Quantification of the impact of macrophytes on oxygen dynamics and nitrogen retention in a vegetated lowland river. Physics and Chemistry of the Earth, v.36, p.479-489, 2011.
DWD - Deutscher Wetterdienst. Precipitation data 1990-2012, Climate station Padenstedt. http://werdis.dwd.de/werdis/ start_js_JSP.do. 10 Apr. 2012.
EC. Directive 2000/60/EC of the European Parliament and of the Council of 23 October 2000 establishing a framework for the Community action in the field of water policy. Official Journal of the European Communities, v.L327, p.1-72, 2000. Finnern, J. Böden und Leitbodengesellschaften des
Störeinzugsgebietes in Schleswig-Holstein: Vergesellschaftung und Stoffaustragsprognose (K, Ca, Mg) mittels GIS. Kiel: Instituts für Pflanzenernährung und Bodenkunde der Universität Kiel, 1997. 186p.
Figure 7. Box percentile plot with the frequency comparison of TP, PO4-P, TN, NO3-N and NH4-N concentration of the Upper Stör catchment at the gauge station Willenscharen, Germany
Conclusions
1. Water quality parameters show a distinct seasonal effect, with more nitrogen and phosphorus concentration in winter months.
2. Nitrate and particulate phosphorus are the major forms of nitrogen and phosphorus, respectively.
Jaji, M. O.; BAmgbose, O.; Odukoya, O. O.; Arowolo, T. A. Water quality assessment of Ogun river, South West Nigeria. Environment, Monitoring and Assessment, v.133, p.473-482, 2007.
Lam, Q. D.; Schmalz, B.; Fohrer, N. Modelling point and diffuse source pollution of nitrate in a rural lowland catchment using the SWAT model. Agricultural Water Management, v.97, p.317-325, 2010.
LAWA - Länderarbeitsgemeinschaft Wasser. Beurteilung der Wasserbeschaffenheit von Fließgewässern in der Bundesrepublik Deutschland. Chemische Gewässergüteklassifikation. Berlin: Kulturbuchverlag, 1998. 171p.
LKN - Landesbetrieb für Küstenschutz, Nationalpark und Meeresschutz Schleswig-Holstein. Discharge data, Gauge Station Willenscharen. Hersum: LKN, 2012. s.n.p.
Lu, X. X.; Li, S.; He, M.; Zhou, Y.; Bei, R.; Li, L.; Ziegler, A. D. Seasonal changes of nutrient fluxes in the Upper Changjiang basin: An example of the Longchuanjiang River, China. Journal of Hydrology, v.405, p.344-351, 2011.
Oppelt, N.; Rathjens, H.; Baase, T. Landnutzungsklassifikation des finzugsgebietes der oberen stör auf basis von Landsat TM Daten aus dem Jahr 2010, Kiel: Landsat, 2011. 198p. Özcan, H.; Ekinci, H.; Baba, A.; Kavdir, Y.; Yüksel, O.; Yigini, Y.
Assessment of the water quality of Troia for the multipurpose usages. Environment, Monitoring and Assessment, v.130, p.389-402, 2007.
Pereira, P.; Pablo, H.; Vale, C.; Franco, V.; Nogueira, M. Spatial and seasonal variation of water quality in an impacted coastal lagoon (Óbidos Lagoon, Portugal). Environmental Monitoring and Assessment, v.153, p.281-292, 2009. Rothwell, J. J.; Diese, N. B.; Taylor, K. G.; Allott, T. E. H.; Scholefield,
P.; Davies, H.; Neal, C. A spatial and seasonal assessment of river water chemistry across North West England. Science of the Total Environment, v.408, p.841-855, 2010.
Schmalz, B.; Springer, P.; Fohrer, N. Variability of water quality in a riparian wetland with interacting shallow groundwater and surface water. Journal of Plant Nutrition and Soil Science, v.172, p.757-768, 2009.
Schmalz, B.; Tavares, F.; Fohrer, N. Assessment of nutrient entry pathways and dominating hydrological processes in lowland catchments. Advances in Geoscience, v.11, p.107-112, 2007.
Sileika, A. S.; Gaigalis, K.; Kutra, G.; Smitiene, A. Factors affecting N and P losses from small catchments (Lithuania). Environmental Monitoring and Assessment, v.102, p.359-374, 2005.
Sileika, A. S.; Stålnacke, P.; Kutra, S.; Gaigalis, K.; Berankiene, L. Temporal and spatial variation of nutrient levels in the Nemunas River (Lithuania and Belarus). Environmental Monitoring and Assessment, v.122, p.335-354, 2006.
Skarbøvik, E.; Stålnacke, P.; Bogen, J.; Bønsnes, T. E. Impact of sampling frequently on mean concentrations and estimated loads of suspended sediment in a Norwegian river: Implications for water management. Science of the Total Environment, v.433, p.462-471, 2012.
Tao, Y., Wie; M., Ongley, E.; Zicheng, L.; Jingsheng, C. Long-term variations and causal factors in nitrogen and phosphorus transport in the Yellow River, China. Estuarine, Coastal and Shelf Science, v.86, p.345-351, 2010.
Tisseuil, C.; Wade, A.; Tudesque, L.; Lek, S. Modeling the stream water nitrate dynamics in a 60,000 km² European catchment, the Garonne, Southwest France. Journal of Environmental Quality, v.37, p.2155-2168, 2008.