____________________________________
1 Engo Agrônomo, Pesquisador, Doutor em Irrigação, Embrapa Meio-Norte, Av. Duque de Caxias, 5650, Teresina - PI, Fone:
(0XX86) 3089-9100 ramal 159, [email protected]; [email protected].
2 Engo Agrônomo, Professor Adjunto, Universidade Federal de Uberlândia - MG, [email protected].
3 Engo Agrônomo, Pesquisador Doutor em Irrigação, Embrapa Meio-Norte, UEP de Parnaíba - PI. [email protected]. EVAPOTRANSPIRATION AND CROP COEFFICIENT OF DRIP IRRIGATED
WATERMELON IN PIAUI COASTLINE, BRAZIL
EDSON A. BASTOS1, CLÁUDIO R. SILVA2, BRAZ H. N. RODRIGUES3,
ADERSON S. ANDRADE JR.1, LÍVIA M. M. IBIAPINA4
ABSTRACT: The knowledge of the evapotranspiration (ETc) and crop coefficient (Kc) is fundamental to plan and to manage the irrigation of any crop. The aim of this study was to determine the daily and hourly evapotranspiration of drip irrigated watermelon (Citrullus Lanatus, var. Crimson Sweet) and crop coefficient (Kc) in each crop development phase. The experiment was carried out in an experimental area of 1.27 ha of Embrapa Mid-North, localized in Parnaíba (02°54’S, 41°47’W and 46 m above of sea), State of Piauí, Brazil, from September to November, 2006. Electronic weighing lysimeters of 1.5 m x 1.5 m wide and long and 1.0 m deep were used to obtain the evapotranspiration. The plants were drip irrigated with a lateral row per plant row and drippers spaced 0.5 m from each other. The reference evapotranspiration (ETo) was estimated using the Penman-Monteith equation from the climatic data obtained by electronic sensors. The total evapotranspiration during the watermelon crop cycle cultivated in the state of Piauí was 233.87 mm, with mean values of 3.7 mm day-1, minimum of 1.18 and maximum of 8.14 mm day-1. The Kc of
the drip irrigated watermelon was 0.18 in the initial stage of crop growth; 0.18 to 1.3, in crop development stage; 1.3 in the intermediate stage and 0.43 in the final stage.
KEY WORDS: Citrullus lanatus, lysimeter, water consume.
EVAPOTRANSPIRAÇÃO E COEFICIENTE DE CULTIVO DA MELANCIA IRRIGADA POR GOTEJAMENTO NO LITORAL DO PIAUÍ
RESUMO: O conhecimento da evapotranspiração e do coeficiente de cultivo (Kc) é fundamental para dimensionar e manejar a irrigação de qualquer cultura. O objetivo deste trabalho foi determinar a evapotranspiração (ETc) diária e horária da melancia (Citrullus lanatus Schrad, var. Crimson Sweet) irrigada por gotejamento e o Kc em cada fase de desenvolvimento da cultura. O estudo foi conduzido em uma área experimental de 1,27 ha da Embrapa Meio-Norte, localizada em Parnaíba - PI (02° 54’S, 41° 47’W e 46 m de altitude), no período de setembro a novembro de 2006. Utilizaram-se quatro lisímetros de pesagem eletrônica de 1,5 m x 1,5 m de largura e comprimento com 1,0 m de profundidade para determinar a evapotranspiração. A cultura foi irrigada por gotejamento com uma linha lateral por fileira de planta e gotejadores espaçados a cada 0,5 m. A evapotranspiração de referência (ETo) foi estimada com base na equação de Penman-Monteith a partir dos dados climáticos de sensores eletrônicos. A evapotranspiração total durante o ciclo da cultura da melancia cultivada no Piauí foi de 233,87 mm, com valores médios de 3,7 mm dia-1, com mínimo de 1,18 e máximo de 8,14 mm dia-1. O Kc da melancieira irrigada por gotejamento foi de 0,18 no estádio inicial; 0,18 a 1,3, no estádio de crescimento; 1,3 no estádio intermediário, e 0,43 no estádio final.
INTRODUCTION
Watermelon (Citrullus lanatus Thunb.) constitutes one of the major horticultural crops in Brazil. In 2006, the brazilian annual production was 1.94 million tons with average yield of 20.9 t ha-1 (FAO, 2008). The good uniformity of size, color and flavor provided that watermelon occupied the second place among the vegetables in Brazilian export volume, losing position only to the melon (VILELA et al., 2006).
In the Northeast region, the warm and dry climate provides the yield of excellent quality fruits, and it can be grown all year with the use of irrigation, generating employment and income, especially during the dry season, when the difficulties in this region are more patent (PEDROSA, 1997).
Although the production of Piauí is still small compared to the harvested area in the Northeast, the good acceptance of the fruits in the local market and the fast development cycle (60 days, on average) when compared to other cultures, have made the watermelon a good alternative for producers of irrigated perimeters (Irrigation District of the Coastal Tablelands of Piauí - DITALPI and Guadalupe Plateau Irrigation District), and some irrigated areas of the region of Teresina and Vale do Rio Gurguéia.
Traditionally, with respect to precipitation, the State of Piauí can be characterized in two seasons: dry and rainy seasons. The dry season, longer, takes approximately eight months, covering the months from May to October. In this period, there is a pronounced soil water deficit. Thus, it is necessary the use of irrigation. The first areas were irrigated by sprinkler or furrow, but recently, the area under drip has been increased, mainly because it consumes less water and facilitates weed control.
However, due to the confinement of the roots in a limited volume of soil, with low volume of water available to plants, drip irrigation management requires that the crop evapotranspiration (ETc) is accurately determined and for maximum intervals of one day (CLARK & SMAJSTRLA, 1993).
Lysimeters have long been used in research for the direct measurement of evapotranspiration of a crop, varying in form and scale (MAREK et al., 2006). Due to advances in microelectronics, enabling the data acquisition in instantaneous scale, the high accuracy and low hysteresis, several authors have reported the use of weighting lysimeter as a standard tool in studies of water loss of crops, even to determine ETc and crop coefficient (Kc) as well as the calibration of estimative agrometeorological models, according to a review by CAMPECHE (2002).
Electronic weighing lysimeter are being used for most crops, perennials, such as Tahiti lime (ALVES JR. et al., 2007; BARBOZA JR. et al., 2008), grapevine (MONTORO et al., 2008) castor oil plant (HELD et al., 2008) or annual cultures, such as bean (BASTOS et al., 2008 and FERREIRA et al., 2009).
Using electronic weighing lysimeters, MIRANDA et al. (2004), in the state of Ceará, determined that the total evapotranspiration during the crop cycle of drip irrigated watermelon (cv. Crimson) was 267 mm, with maximum values of 7.0 mm d-1 during the intermediate phase, obtaining the values of crop coefficient (Kc) of 0.39, 1.31 and 0.70 for initial, intermediate, and final stages, respectively. ALLEN et al. (1998) comment that the crop evapotranspiration depends on climatic, plant and soil management factors. Thus, obtaining regionalized values can improve the accuracy in the planning of the irrigation.
MATERIAL AND METHODS
Details of the experimental area and culture
The study was conducted in 1.27 ha in the experimental field of Embrapa Mid-North, located in the city of Parnaíba, State of Piauí (03°05’ S, 41°47’ W and 46 m altitude), Brazil. The soil is classified as dystrophic Yellow Latosol, sharply drained, sandy texture (MELO et al., 2004). The annual mean temperatures of the site is 27.9°C with mean relative humidity of 75.4%, reference evapotranspiration of 5.4 mm and mean annual rainfall of 1,051.6 mm, however, concentrated from January to May (BASTOS et al., 2010).
The water content in the soil at field capacity was 0.18 m3 m-3 and 0.06 m3 m-3 in the permanent wilting point, determined based on undisturbed soil samples. Before planting, chemical analysis of the soil was made on layer 0-0.4 m deep for the correction of acidity and crop fertilization. Chemical analysis of the soil showed: pH = 5.8 (water); P= 1.55 mg dm-3; K+ = 0.05 cmol dm-3; Ca2+ = 1.08 cmol dm-3; Mg2+ = 0.80 cmol dm-3; H + Al3+ = 1.80 cmol dm-3; CTC = 3.74 cmol dm-3, and V = 51.26 %.
The foundation chemical fertilizer was based on soil analysis, applying: 72 kg ha-1 of P2O5
(superphosphate), 34 kg ha-1 of N (urea), 30 kg ha-1 of K2O (chloride potassium) and 6 kg ha-1of
FTE BR-12. Coverage fertilizations were performed with nitrogen and potassium under fertigation at a dosage of 92.7 and 66 kg ha-1 of N and K2O, respectively.
Soil preparation consisted of plowing and harrowing, followed by plowing in rows spaced 2.0 m and 0.3 m depth. It was used a variety of Crimson Sweet watermelon with planting done on September 26th, 2006, leaving four seeds per hole, spaced 1.0 m between plants and 2.0 m between rows. The thinning of the plants was carried out when the seedlings had two definitive leaves, leaving one plant per hole. The phytosanitary control and the weeding were performed as needed, following the usual techniques recommendations of the culture.
There were two harvests at 63 and 70 days after planting, harvesting all the fruits of the lysimeters. To estimate the yield of fruits in the boundary, it was made a sample, harvesting four sub-areas (144 m2), each one containing six rows of 12 m.
Irrigation and lysimeters
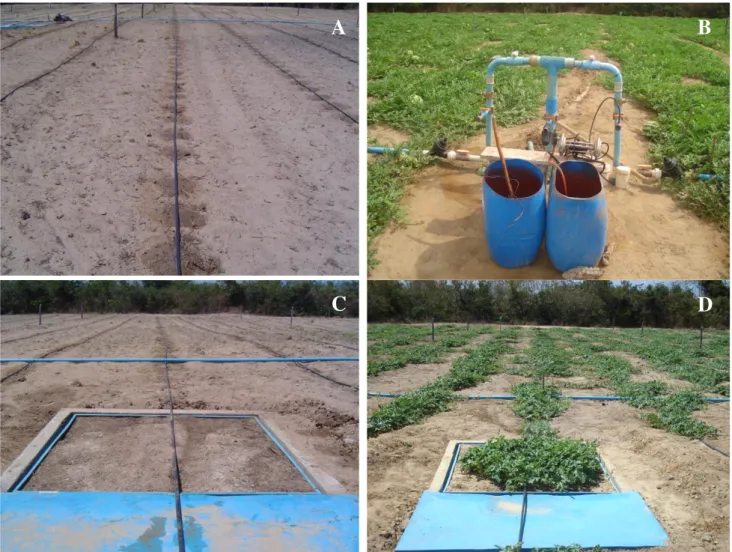
The crop was drip irrigated with a lateral line per row of plants and drippers spaced every 0.5 m. The drippers had an average flow of 1.63 L h-1 under a pressure of 150 kPa and 90% coefficient of uniformity (Cu), after a uniformity test done after the irrigation installation (Figure 1A). After planting, seven daily irrigations were performed aiming to raise the soil humidity at field capacity to promote crop establishment. After this period, it was adopted, as standard, an irrigation schedule of two days and the fertigations held at a frequency of three times a week, using an injection pump type TMB (Figure 1B).
FIGURE 1. Photographs of the irrigation (A) and fertigation (B) systems and of one lysimeter at crop planting (C) and crop development (D). Parnaiba, State of Piauí, 2006.
The hourly mean values, in millivolt (mV), provided by each cell were converted into millimeters of water (mm) as the calibration equation performed for each lysimeter. Further details of lysimeter construction may be seen in BASTOS et al. (2008). The crop evapotranspiration (ETc) was obtained by the difference between the current and previous reading of the lysimeter, apart from the rain, irrigation and drainage during the period.
Irrigation was made to maintain soil humidity close to field capacity, monitored by digital puncture tensiometers installed at 0.2 and 0.4 m deep on the lysimeters, as well as on four sites distributed randomly in the area. The tensiometer readings were made daily, in the morning, until the maturation stage of culture, when irrigation was suspended. The water depth was calculated by the product between reference evapotranspiration (ETo), the crop coefficient (Kc) and the coverage area of the plant (Ac), whose adopted values were: 0.3, until 29 days after planting (DAP); 0.5, from 30 to 39 DAP; and 0.8, from 40 to 60 DAP.
The ETo was estimated based on the Penman-Monteith equation parametrized by ALLEN et al. (1998) from the weather data provided by electronic sensors of temperature, relative humidity, solar radiation and wind speed installed in automatic data collection cited above.
The crop coefficients (Kc) were calculated for each day of the cycle (Kc=ETc ETo-1). Then, it was determined mean values of ETc and Kc considering the growing stages proposed by ALLEN et al. (1998): I) initial: planting up to 10% of ground cover; II) growth phase: from the end of the initial stage up to 80% of ground cover; III) intermediate: from 80% of ground cover to the beginning of fruit maturation; IV) final: from the beginning of maturation until harvest. For the final
C
D
phase, it was considered the Kc obtained on the day of harvest. And also, with daily values of Kc, a curve was adjusted between Kc and days after planting (DAP).
Early in the experiment, one of the lysimeters had electronic malfunctioning in load cell and, thus, their data were discarded. For the other lysimeters, the values of ETc, obtained daily, were analyzed together (average data). To analyze the evolution of ETc during the day, mean hourly values of ETc were calculated in five representative days in the initial (I) and intermediate phase of culture (III).
RESULTS AND DISCUSSIONS
Climatic conditions during the experiment
No rainfall occurred during the experiment, fully justifying the technique of irrigation. The temperature was almost constant throughout the experiment (Figure 2). A similar profile was obtained with relative humidity. There was a decrease in global radiation at 39 days after planting (DAP) due to cloudiness. In general, the climatic conditions were highly favorable to the development of culture, resulting in 63 days from planting to harvest, lower than the value obtained by MIRANDA et al. (2004) with the same variety (70 days), in Ceará. Commercial production area was of 31.5 t ha-1, with mean fruit weight of 9.0 kg in the lysimeters, values above the national average (20.9 t ha-1). The average voltage of the soil water (0-0.4 m) for the entire crop cycle was low ≈20 kPa (slightly smaller in the lysimeters ≈10 kPa). These low values indicate that irrigation provided good water availability to plants throughout the development cycle, a necessary condition to obtain the evapotranspiration of a culture according to ALLEN et al. (1998).
0 10 20 30 40 50 60
22 24 26 28 30 32 34 36 38 50 60 70 80 90 100 14 16 18 20 22 24 26 T T e m p e ra tu ra , t (° C )
Dias após o plantio, DAP
UR U m id a d e r e la ti v a d o a r, U R ( % ) RG R a d ia ç ã o g lo b a l, R g ( M J m
-2 d
ia
-1 )
FIGURE 2. Climate conditions (daily global radiation, mean air humidity and temperature) observed during the experiment. Parnaiba, State of Piauí, 2006.
Crop evapotranspiration
Figure 3A shows the evolution of ETc during the development cycle of culture. It was emphasized in the figure the four phenological phases proposed in the model of ALLEN et al. (1998). In the first, the phase I (initial), ETc was low, with a value close to 1 mm day-1, influenced by the small portion of the soil volume irrigated, by low evaporation of water from soil (dry surface) and small leaf area of plants. From the 30th day after planting (DAP) and approximately until the 40th DAP, ETc increased dramatically (Phase II), reaching maximum values close to
Air h um id ity, R H (% )
Days after planting, DAP
T empera tue ( o C) GR RH T G lob al radi at ion
, Gr (
M
J m
-2 d
ay
9 mm day-1, higher than the value obtained by MIRANDA et al. (2004), with 7.5 mm day-1 for the same crop and irrigation system. From 40th DAP to 48th DAP (Stage III), there was some stabilization, around 8.3 mm day-1, caused by the beginning of maturation culture.
In both phase I and phase III, the ETc peak occurred close to midday (10 to 14 h), however, with values of 0.16 mm hour-1 for Phase I, and 1.02 mm hour-1, for Phase III (Figure 3B). The standard deviations were higher to ETc-III, because as the perspiration were greater than the evaporation in this phase, variations of albedo, height, development and aerodynamic properties of the leaves of plants in each lysimeter may have caused deviations in the ETc. It was also observed in this figure that there was a low evapotranspiration in the morning (5 to 7 h) and at night (18 to 20h). SILVA et al. (2005) also found a nocturnal evapotranspiration in lime acid, of 17.4 and 13.4% of ETc for the summer and winter, respectively. Thus, this contribution to ETc should not be neglected in the sum of daily evapotranspiration.
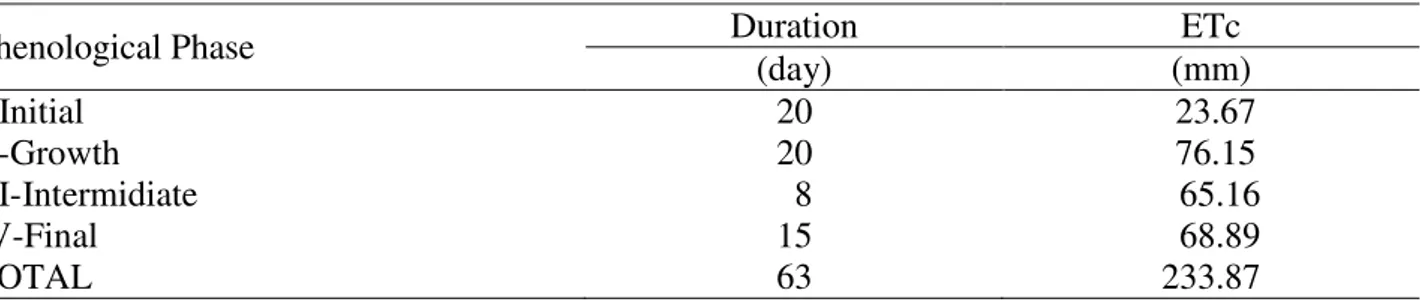
From the 50th DAP, the ETc decreased, coinciding with the senescence of part of the leaves of the crop, and finally with the end of irrigation. In Table 1, it can be seen the aggregation of ETc at every stage of development. The total ETc was approximately 234 mm for a cycle of 63 days of culture. MIRANDA et al. (2004) obtained 267 mm for one cycle of 70 days under cultivation in Ceará.
0 10 20 30 40 50 60
0 2 4 6 8 10
2 4 6 8 10 12 14 16 18 20 22 24
0,00 0,20 0,40 0,60 0,80 1,00 1,20 B E T c ( m m d ia -1 )
Dias após o plantio, DAP
ETc A E v a p o tr a n s p ir a ç ã o , E T c ( m m h o ra -1 ) Hora ETc-I ETc-III
FIGURE 3. (A) Crop daily evapotranspiration (ETc) throughout watermelon growth cycle. Each point represents a mean of three values, and the bars represent the standard deviation. (B) Crop hourly evapotranspiration for initial (ETc-I) and intermediate (ETc-III) phase. Each point represents a mean value of 15 replications, and the bars represent the standard deviation.
Days after planting, DAP
TABLE 1. Watermelon crop evapotranspiration (ETc) in each crop development stage. Parnaiba, State of Piauí, Brazil, 2006.
Phenological Phase Duration ETc
(day) (mm)
I-Initial 20 23.67
II-Growth 20 76.15
III-Intermidiate 8 65.16
IV-Final 15 68.89
TOTAL 63 233.87
Crop coefficient
The mean Kc values throughout the development of culture and the curves of Kc (adjusted manually and the curve obtained by MIRANDA et al., 2004) are shown in Figure 4. During the initial phase, the Kc was almost constant, with value of 0.2. According to ALLEN et al. (1998), when the culture is not fully covering the ground, Kc values are determined based on the frequency at which the soil is wet by rain or irrigation, ranging from 1.0 to 0.1. Considering that the crop is grown in wide row spacings, large amount of water is wasted when using conventional methods of irrigation such as furrow and sprinkler, especially in the early stages of culture (SRINIVAS et al., 1989). As drip irrigation, at this stage, wet a small volume of soil so that evaporation was low, and because the plants have little leaf area, Kc values were minimal at this stage. The same result was obtained by MIRANDA et al. (2004), but slightly higher, with a value of 0.3.
From 23rd DAP, Kc values increased linearly (0.06 day-1), directly related to the fast development of the plant and increased transpiration rates. Thus, the highest crop coefficients at this stage are related to more intense metabolism of the crop. With the increasing influence of transpiration on the values of Kc, standard deviations increased directly influenced by the intrinsic characteristics of each plant in the lysimeters. At 40 DAP, there was stabilization close to the value of 1.3, being higher than the value obtained by MIRANDA et al. (2004), which was 1.15. It should also be noted that in this stage (intermediate), Kc values are greater than those proposed by ALLEN et al. (1998), who recommend Kc equal to 1.0. These differences are explained, partially, by the different climatic conditions. While the FAO Kc values were determined for a subtropical climate, the values from this study were obtained under a tropical climate, with the occurrence of high air temperature and solar radiation (Figure 2). From 48 DAP there was a gradual decline in values, directly caused by the beginning of senescence in culture.
0 5 10 15 20 25 30 35 40 45 50 55 60 65 0,0
0,1 0,2 0,3 0,4 0,5 0,6 0,7 0,8 0,9 1,0 1,1 1,2 1,3 1,4 1,5 1,6
Kc
Kc ajustado
Kc Miranda et al. 2004
C
o
e
fi
c
ie
n
te
d
e
C
u
lt
iv
o
,
K
c
Diasapós o plantio, DAP
FIGURE 4. Crop coefficient throughout the watermelon growth cycle and Kc curves (the adjusted curve from points and the curve obtained by MIRANDA et al., 2004). Each point represents the mean of three values and the bars represent the standard deviation.
CONCLUSIONS
The total evapotranspiration during the crop cycle of watermelon grown on the coast of Piauí and drip irrigated was of 233.87 mm, with a mean of 3.7 mm day-1.
The ETc quantitatively starts at 7am, ending at 20 h.
The crop coefficient (Kc) of drip irrigated watermelon, in the conditions of soil and climate of the coast of Piauí, is 0.18 in the initial stage, 0.18 to 1.3 in the growth stage, 1.3 in intermediate stage, and 0.43 in the final stage of culture.
ACKNOWLEDGEMENT
To the technicist Rogério Farias Cavalcante for supporting the implementation of field activities and data processing.
REFERENCES
ALLEN, R.G.; PEREIRA, L.S.; RAES, D.; SMITH, M. Crop evapotranspiration: guidelines for computing crop water requirements. Rome: Food and Agriculture Organization of the United Nations, 1998. 300 p. (Irrigation and Drainage Paper, 56).
ALVES JUNIOR, J.; FOLEGATTI, M.V.; PARSONS, L.R.; BANDARANAYAKE, W.; SILVA, C.R. da.; SILVA, T.J.A. da.; CAMPECHE, L.F.S.M. Determination of the crop coefficient for grafted 'Tahiti' lime trees and soil evaporation coefficient of Rhodic Kandiudalf clay soil in Sao Paulo, Brazil. Irrigation Science, New York, v.25, p.419-428, 2007.
BARBOZA Jr., C.R.A.; FOLEGATTI, M.V.; ROCHA, F.J.; ATARASSI, R.T. Coeficiente de cultura da lima-ácida tahiti no outono-inverno determinado por lisimetria de pesagem em Piracicaba - SP. Engenharia Agrícola, Jaboticabal, v.28, n.4, p.691-698, 2008.
Cr
op
c
oe
fic
ie
nt, Kc
Days after planting DAP Kc
Kc adjusted
BASTOS, E.A.; ANDRADE JÚNIOR, A.S.; RODRIGUES, B.H.N. Boletim agrometeorológico de 2009 para o município de Parnaíba, PI. Teresina: Embrapa Meio-Norte, 2010. 37 p. (Documentos, 207).
BASTOS, E.A.; FERREIRA, V.M.; SILVA, C.R. da; ANDRADE Jr., A.S. de. Evapotranspiração e coeficiente de cultivo do feijão-caupi no Vale do Gurguéia, Piauí. Irriga, Botucatu, v.13, p.182-190, 2008.
CAMPECHE, L.F.S.M. Construção, calibração e análise de funcionamento de lisímetros de pesagem para determinação da evapotranspiração da cultura da lima ácida ‘Tahiti’ (Citrus latifolia Tan.). 2002. 62 f. Tese (Doutorado) - Escola Superior de Agricultura “Luiz de Queiroz”, Universidade de São Paulo, Piracicaba, 2002.
CLARK, G.A.; SMAJSTRLA, A.G. Application volumes and wetting patterns for scheduling drip irrigation in Florida vegetable production. Gainesville: University of Florida, 1993. 15 p. (Circular, 1041)
FAO. FAOSTAT: Agricultural production. Disponível em: <http://www.fao.org>. Acesso em: 19 maio 2008.
FERREIRA, V.M.; ANDRADE JÚNIOR, A.S. de; SILVA, C.R. da; MASCHIO, R. Consumo relativo de água pelo milho e pelo feijão-caupi, em sistemas de cultivos solteiro e consorciado. Revista Brasileira de Agrometeorologia, Santa Maria, v.16, p.96-106, 2009.
MAREK, T.; PICCINNI, G.; SCHNEIDER, A.; HOWELL, T.; JETT, M.; DUSEK, D. Weighing lysimeters for the determination of crop water requirements and crop coefficients. American Society of Agricultural and Biological Engineers, St. Joseph, v.22, n.6, p.851-856, 2006.
MELO, F.B.; CAVALCANTI, A.C.; ANDRADE JÚNIOR, A.S.; BASTOS, E.A. Levantamento detalhado dos solos da área da Embrapa Norte: UEP - Parnaíba. Teresina: Embrapa Meio-Norte, 2004. 26 p. (Documentos, 89).
MIRANDA, F.R.; OLIVEIRA, J.J.G.; SOUZA, F. Evapotranspiração máxima e coeficiente de cultivo para a cultura da melancia. Revista Ciência Agronômica, Fortaleza, v.35, p.36-43, 2004. MONTORO, A.; LÓPEZ URREA, R.; MAÑAS, F.; LÓPEZ FUSTER, P.; FERERES, E. Evapotranspiration of grapevines measured by a weighing lysimeter in la mancha, spain. Acta Horticulturae, The Hague, v.792, p.459-466, 2008.
PEDROSA, J.F. Cultivo da melancieira. Mossoró: Departamento de Engenharia Agrícola, ESAM, 1997. 50 p. Apostila.
POSSE, R.P.; BERNARDO, S.; SOUSA, E.F. de; GOTTARDO, R.D. Evapotranspiração e
coeficiente da cultura do mamoeiro. Engenharia Agrícola, Jaboticabal, v.28, n.4, p.681-690, 2008, SILVA, C.R. da; ALVES Jr., J.; SILVA, T.J.A. da; FOLEGATTI, M.V.; CAMPECHE, L.F.S.M. Variação sazonal na evapotranspiração de plantas jovens de lima ácida. Irriga, Botucatu, v. 11, n.1, p. 26-35, 2005.
SRINIVAS, K.; HEDGE, D.M.; HAVANAGI, G.V. Irrigation studies on watermelon (Citrillus lanatus (Thunb) Matsum et Nakai). Irrigation Science, New York, v.10, p.293-301, 1989.