Contents lists available atSciVerse ScienceDirect
Industrial Crops and Products
j o u r n a l h o m e p a g e :w w w . e l s e v i e r . c o m / l o c a t e / i n d c r o p
Characterization of depolymerized residues from extremely low acid hydrolysis
(ELA) of sugarcane bagasse cellulose: Effects of degree of polymerization,
crystallinity and crystallite size on thermal decomposition
Leandro Vinícius Alves Gurgel
a, Karen Marabezi
a, Luiz Antonio Ramos
a,
Antonio Aprigio da Silva Curvelo
a,b,∗aGrupo de Físico-química orgânica, Departamento de Físico-química, Instituto de Química de São Carlos, Universidade de São Paulo, Av. Trabalhador São Carlense, 400, Caixa Postal
780, 13560-970 São Carlos, São Paulo, Brazil
bLaboratório Nacional de Ciência e Tecnologia do Bioetanol (CTBE), Centro de Pesquisa em Energia e Materiais (CNPEM), Caixa Postal 6179, 13083-970 Campinas, São Paulo, Brazil
a r t i c l e
i n f o
Article history:
Received 5 September 2011
Received in revised form 26 October 2011 Accepted 11 November 2011
Available online 14 December 2011
Keywords: Sugarcane bagasse Thermal decomposition ELA
Microcrystalline cellulose Acid hydrolysis
a b s t r a c t
Sugarcane bagasse cellulose was subjected to the extremely low acid (ELA) hydrolysis in 0.07% H2SO4at 190, 210 and 225◦C for various times. The cellulose residues from this process were characterized by TGA, XRD, GPC, FTIR and SEM. A kinetic study of thermal decomposition of the residues was also carried out, using the ASTM and Kissinger methods. The thermal studies revealed that residues of cellulose hydrolyzed at 190, 210 and 225◦C for 80, 40 and 8 min have initial decomposition temperature and activation energy for the main decomposition step similar to those of Avicel PH-101. XRD studies confirmed this finding by showing that these cellulose residues are similar to Avicel in crystallinity index and crystallite size in relation to the 110 and 200 planes. FTIR spectra revealed no significant changes in the cellulose chemical structure and analysis of SEM micrographs demonstrated that the particle size of the cellulose residues hydrolyzed at 190 and 210◦C were similar to that of Avicel.
© 2011 Elsevier B.V. All rights reserved.
1. Introduction
Batch hydrolysis of cellulose to glucose by dilute acid hydrol-ysis results in yields limited to 60–65% of the potential glucose (Bouchard et al., 1989). Recently, The U.S. National Renewable Energy Laboratory (NREL) developed a dilute acid hydrolysis pro-cess for lignocellulose biomass called extremely low acid (ELA) hydrolysis. The ELA conditions employ low sulphuric acid con-centration (0.07 wt.%) and high temperatures in order to improve the yield of glucose. According toKim et al. (2001), there are dis-tinct advantages of using extremely low acid (ELA) conditions for the hydrolysis of lignocellulosic biomass. One of them is that the corrosion characteristics of ELA conditions are very close to those of a neutral aqueous reaction, so that standard grade stainless steel equipment can be used instead of high nickel alloy, reducing equipment cost and maintenance. The advancement made in ELA has brought acid hydrolysis to a position where it can favorably
∗ Corresponding author at: Grupo de Físico-química orgânica, Departamento de Físico-química, Instituto de Química de São Carlos, Universidade de São Paulo, Av. Trabalhador São Carlense, 400, Caixa Postal 780, 13560-970 São Carlos, São Paulo, Brazil. Tel.: +55 16 3373 9938; fax: +55 16 3373 9952.
E-mail address:aprigio@iqsc.usp.br(A.A.S. Curvelo).
compete with enzymatic hydrolysis in overall process economics. Besides, the process using the ELA conditions could be regarded as an environmentally friendly process, as it has minimal envi-ronmental effects. Recent findings have proven that glucose yields around 62% are attainable when␣-cellulose is used as feedstock in a batch reactor.
In Brazil, first generation ethanol is mainly produced by fer-mentation of the sucrose in sugarcane juice. This is pressed from the cane by milling, leaving large amounts of bagasse. According to the last Brazilian crop survey performed by the National Com-pany of Supply (CONAB, 2010), the estimated sugarcane harvest in the 2010/2011 season is expected to reach 651.5 million tons, 7.8% greater than in 2009/2010, which will generate about 162.9 million tons of bagasse and 132.9 million tons of straw, given that one ton of sugarcane produces about 250 kg of bagasse and 204 kg of straw on a dry weight basis.
Sugarcane bagasse is mainly composed of cellulose, hemicel-luloses and lignin. Cellulose, the subject of this study, is a linear homopolymer ofd-glucopyranose units, which are linked by
-(1→4) glycosidic bonds. It contains amorphous and crystalline regions where the microfibrils are oriented randomly or in par-allel bundles along the direction of cellulose fibrils, respectively. The amorphous region is more reactive than the crystalline, adding
complexity to the thermal decomposition of cellulose (Shen & Gu, 2009).
Numerous studies have been reported on the thermal degra-dation of cellulose, analyzed by thermogravimetry (TG) and differential thermal analysis (DTA). Mechanisms for thermal degra-dation of cellulose have been discussed by Broido and Nelson (1975),Bradbury et al. (1979),Wang et al. (2007)andShen and Gu (2009).Calahorra et al. (1989)have also studied the effect of degree of polymerization and crystallinity index on thermal decomposi-tion of cellulose. However, very little attendecomposi-tion has been paid so far to the characteristics of the cellulose residues obtained from dilute acid hydrolysis. In this connection,Bouchard et al. (1989)were the first to investigate the thermal decomposition of cellulose residues as well as their structural changes, after dilute acid hydrolysis.
It is well known that the cellulose residues left after dilute acid hydrolysis have a lower degree of polymerization, higher crystallinity index, and large amounts of glucose decomposition products along their surface (Bouchard et al., 1989; Nelson & Conrad, 1948; Sharples, 1957). Furthermore, these residues are resistant to further hydrolysis and 4% H2SO4 at 121◦C have been
suggested as a favorable set of hydrolysis conditions to produce fermentable glucose from these residues (Xiang, 2002; Xiang et al., 2003a,b). However, these hydrolysis conditions are unfavorable compared to the ELA conditions, in relation to both acid con-centration and hydrolysis time. Besides, according to Bouchard et al. (1989), the sugar potential of the unconverted cellulose residues decreases with the extent of depolymerization. Consid-ering the physicochemical characteristics of cellulose residues a more economically profitable application needs to be also investigated.
However, the effects of the structural changes and the pres-ence of decomposition products produced by dilute acid hydrolysis under the ELA conditions on the thermal decomposition of cellu-lose have not been investigated at present and, therefore, constitute an impediment to suggesting a new use for these residues. Thus, the main aim of this study was to investigate the effects of degree of polymerization, crystallinity index and crystallite size on the thermal decomposition of cellulose residues obtained from ELA hydrolysis conditions, by thermogravimetric analysis (TGA). A sec-ond aim of this study was to propose a commercial application for cellulose residues based on their physicochemical characteristics. For these purposes, sugarcane bagasse cellulose was prepared by extracting hemicelluloses prior to the soda-anthraquinone pulp-ing process and subjectpulp-ing the cellulose to ELA hydrolysis at high temperatures for various times. Gel permeation chromatography (GPC) and X-ray diffraction (XRD) were also used to investigate the changes in degree of polymerization, crystallinity index and crystallite size. Fourier transform infrared (FTIR) spectroscopy was used to investigate possible structural changes in the cellulose residues after dilute acid hydrolysis. Scanning electron microscopy (SEM) was employed in order to investigate the modification of fiber structure as well as the morphology and size of the particles.
2. Experimental
2.1. Chemicals
Sodium hydroxide and sulphuric acid (95–98%) were pur-chased from Qhemis (Brazil). Anthraquinone (98%) was provided by Lwarcel Cellulose (SP, Brazil). Avicel® PH-101
(microcrys-talline cellulose, MCC) was purchased from FMC (Philadelphia, PA). Lithium chloride was purchased from Synth (Brazil). N,N′
-dimethylacetamide (HLPC grade) was purchased from Tedia (Brazil).
2.2. Sugarcane bagasse cellulose preparation
Sugarcane bagasse was provided by Ipiranga alcohol and sugar mill (São Carlos, SP, Brazil). Slices of raw bagasse were mechan-ically stirred in water at 70◦C for 1 h to remove residual sugars
from the milling process. The raw bagasse was then subjected to wet depithing, in order to separate the fiber and pith fractions, using a sieve system composed by two screens, of 16 (1.19 mm) and 60 (0.250 mm) mesh. Depithed bagasse was air dried to 10% moisture content. Hemicelluloses were extracted from the depithed bagasse in a 1000 mL Parr reactor. Sugarcane bagasse (65 g), containing 7.7% moisture, were loaded into the reactor with 715 mL of dis-tilled water to give a solid-to-liquid ratio of 1:12 (w:v). The reactor was heated to 160◦C and maintained at this temperature for 1 h,
to hydrolyze the hemicelluloses. The reactor was then depressur-ized and the content transferred to a Buchner funnel and washed with an excess of water, to remove hydrolyzed hemicelluloses from the surface of the fibers. The moisture was again determined and the prehydrolyzed depithed bagasse was subjected to soda-anthraquinone pulping. For this process, 110.4 g of the material, containing 59% moisture, were again loaded into the Parr reactor, with 9.34 g of NaOH (16 wt.% of dry bagasse as Na2O), 67.9 mg of anthraquinone (0.15%) and 523 mL of distilled water in order to give a solid-to-liquid ratio of 1:13 (w:v). The reactor was heated to 160◦C and kept at this temperature for 1 h, after which the
cel-lulose pulp was transferred to a Buchner funnel and washed with an excess of water, to remove soluble lignin from the pulp until the washings reached pH 6. The moisture content was determined and the cellulose pulp was chilled to−20◦C and stored until used
in acid hydrolysis experiments. The chemical composition of dep-ithed bagasse, prehydrolyzed depdep-ithed bagasse and cellulose pulp was analyzed according to TAPPI standard methods for extractives (TAPPI, 1997), cellulose and hemicelluloses (TAPPI, 2000), Klason soluble and insoluble lignin (TAPPI, 2002), and ash (TAPPI, 1993).
2.3. Batch acid hydrolysis experiments
Samples of 0.6 g of the cellulose pulp obtained from prehy-drolyzed depithed bagasse were loaded into 316L stainless-steel reactors (25.0 mm OD×15.7 mm ID×83.2 mm length) with 12 mL 0.07% H2SO4(w/v), to give a solid-to-liquid ratio of 1:20 (w:v). The reactors were equipped with self-sealed o-ring closures made of PTFE fluoropolymer resistant to high temperatures (>250◦C).
Sam-ples were hydrolyzed at 190, 210, and 225◦C for various times. The
reactors were immersed in a glycerin bath heated to the desired reaction temperature. At the end of the experiments, the reactors were quenched in an ice bath to stop the reaction. The reactor con-tents were separated into liquid and solid by vacuum filtration in a sintered glass funnel. The residual cellulose was rinsed in water, dried at 60◦C under reduced pressure (100 mbar) and stored in a
desiccator prior to analysis.
2.4. Thermogravimetric analysis (TGA)
Thermogravimetric analysis was carried out in a Shimadzu TA-50WSI attached to a TGA50 module. A sample of 4 mg of cellulose residue was placed on a platinum pan. TGA experiments were per-formed under a nitrogen atmosphere at a flow rate of 50 mL/min. Samples were heated from 25 to 800◦C at linear heating rates of
2.5, 5, 10, and 20◦C/min, as stipulated in the standard test method
for decomposition kinetics by thermogravimetry (ASTM E 1641).
2.5. X-ray diffraction (XRD)
(= 1.5406 ˚A), generated at a voltage of 40 kV and a current of 20 mA. The Bragg angle was varied from 3◦ to 50◦ at a scan rate
of 2◦/min.
The peak profiles were resolved with Microcal OriginTM8.5 rou-tines, Lorentz and Pearson VII functions being used for crystal peaks and a fifth-degree polynomial function for the background profile, following the method described byKim et al. (2010). The crystal-lite size of the cellulose in the 1 1 0, 1 1 0 and 2 0 0 planes were calculated by the Scherrer equation(1), as follows:
Lh,k,l=
K
Hcos (1)
whereKis the Scherrer constant (0.89),(nm) is the X-ray wave-length,His the full-width at half-maximum (FWHM) in radians, and
is the Bragg angle. The crystallinity index (CrI) was determined by the Segal method, from Eq.(2):
CrI=
I2 0 0−IamI2 0 0
×100 (2)
where CrI is the crystallinity index (%),I2 0 0the maximum intensity of the (2 0 0) reflection, at 2of 22◦–23◦, andIamis the intensity of
diffraction at 2of 18◦–19◦for cellulose I.
2.6. Gel permeation chromatography (GPC)
Gel permeation chromatography analysis was carried out with a Shimadzu system equipped with pump (LC-10AD), system controller (SCL-10A), and differential refraction index detector (RID-6A) and oven (CTO-10A). Lithium chloride (0.5 wt.% LiCl) in N,N′-dimethylacetamide (DMAc) was used as eluent (60◦C,
0.6 mL/min). The carbohydrates were separated in a series of columns, consisting of a pre-column of 10m Plgel and two columns of 10m mixed-B Plgel (7.5 mm ID×300 mm) (Waters). The chromatogram was calibrated with Pullulan (Polymer Lab-oratories): 1,600,000, 380,000, 200,000, 107,000, 48,000, 23,700, 12,200, 5,800, 738 and 342 g/mol (cellobiose, Aldrich), 180 g/mol (d-glucose, Aldrich), and 150 g/mol (d-xylose, Aldrich). Both
standards and cellulose samples were previously filtered on 1m–25 mm acrodisc glass fiber disks (Waters), before injection of 100L into GPC column.
Cellulose residues were dissolved in LiCl/DMAc (0.5 wt.%) as follows. A sample (10 mg) was weighed and transferred to a round-bottom flask containing 0.25 g of LiCl and 5 mL of anhydrous DMAc, to give a concentration of 2 mg/mL. A reflux condenser was attached to the reaction flask and the suspension was heated to 160◦C under
mild constant stirring for 90 min. After this, the heating was turned off and the solution was stirred for a further 22.5 h, giving a total reaction time of 24 h.
2.7. Fourier transform infrared spectroscopy (FTIR)
The FTIR spectroscopy analysis was carried out on a Bomen – MB spectrometer. Spectra were collected with 32 scans from 4000 to 400 cm−1at a resolution of 2 cm−1. The sample was prepared by mixing 1 mg of dried cellulose powder with 100 mg of KBr.
2.8. Scanning electron microscopy (SEM)
Dry powder samples were dispersed on a graphite ribbon fixed on an aluminum sample holder. The powder was sputter-coated with gold in a modular high-vacuum coating system and examined with a LEO-440 (Zeiss-Leica) scanning electron microscope, using a filament voltage of 20 kV.
2.9. Theoretical approach
The rate of a heterogeneous solid-state reaction can generally be described by Eq.(3):
d˛
dt =k(T)f(˛) (3)
wheretis time,k(T) is a constant that depends on the temperature (T) andf(˛) is a function that describes how the reaction rate con-stant changes with the extent of reaction or conversion,˛.˛attis defined by Eq.(4):
˛= w0−wt
w0−wash (4)
wherew0(mg) is the initial sample weight,wash(mg) is the final sample weight, andwtis the weight at timet.
Temperature dependence of the reaction rate constant can be described by the Arrhenius equation. Hence, the rate of a solid-state reaction can generally be expressed as:
d˛ dt =Ae
(−Ea/RT)f(˛) (5)
whereAis the pre-exponential factor,Eais the Arrhenius activation
energy, andRis the ideal gas constant. The above rate expression can be transformed into a non-isothermal rate expression describ-ing the reaction rate as a function of temperature, at a constant heating rate,ˇ(Ramajo-Escalera et al., 2006):
d˛ dT =
A ˇe
(−Ea/RT)f(˛) (6)
whereˇis the heating rate. Various kinetic methods have been derived from Eq.(6). Generally, these can divided into integral methods, such as those ofOzawa (1965)andFlynn and Wall (1966), and differential methods such as those ofFriedman (1964)and
Kissinger (1957). The methods of Flynn and Wall (ASTM E 1641) and Kissinger were employed to calculate kinetic parameters in the present study.
2.9.1. Kinetic method of Flynn and Wall (ASTM E 1641)
The standard method to investigate decomposition kinetics by thermogravimetry (ASTM E 1641) is based on an integral iso-conversional method proposed by Flynn and Wall (1966). To determine the kinetic parameters, Arrhenius activation energy and pre-exponential factor, it is assumed that the decomposition obeys first-order kinetics. In this isoconversional method, the temper-ature at which a fixed conversion (˛) occurs is recorded. Then, Arrhenius activation energy can be calculated by using Eq.(7)as follows:
Ee= −
Rb
log ˇ(1/T) (7)
whereˇ(K/min) is the heating rate,Ee (J/mol) is the estimated Arrhenius activation energy,b(1/K) is an iteration variable with the first iteration being fixed at 0.457/K,Ris the ideal gas constant (8.314 J/K mol) andT(K) is the absolute temperature at conversion
˛.
A plot of logˇversus 1/Tfor each conversion level (˛) should result in a straight line. The least-squares method was used to fit each straight line and determine the slope,(logˇ)/(1/T). The estimated activation energy,Ee, was then calculated by Eq.(7), mak-ing use of a value of 0.457/K forbin the first iteration. The value,
Table 1
Chemical composition of the materials.
Material Cellulose (%) Hemicelluloses (%) Lignin (%) Ash (%) Extractives (%)
Depithed sugarcane bagasse 49.49±0.31 24.34±0.78 22.69±0.08 0.34±0.03 1.8±0.67
Prehydrolyzed depithed bagasse 55.22±0.25 17.54±0.22 24.08±0.30 0.59±0.05 –
Bagasse cellulosic pulp 88.32±0.07 11.31±0.09 1.45±0.07 0.46±0.04 –
changed by less than 1%. The refined value,Er, is reported as the
Arrhenius activation energy.
The pre-exponential factor was calculated by using Eq.(8)as
follows:
A= −
ˇ′ Er
Rln(1−˛)10a (8)
whereˇ′ is the heating rate nearest the midpoint (10 K/min),Er
(J/mol) is the refined Arrhenius activation energy, andais the value of an approximation of the temperature integral taken from Doyle’s data for the refined value ofEe/RTc.
2.9.2. Kinetic method of Kissinger
The Kissinger method is a differential isoconversional method used to obtain kinetic parameters such as Arrhenius activation energy,E, assumingf(˛) = (1−˛)n:
d˛ dT =
Aˇ
e(−E/RT)(1
−˛)n (9)
wherenis the reaction order.
The Kissinger method derives the activation energy from the temperature (Tm) at which the maximum reaction rate (DTG peak)
occurs and the reaction order from the shape of the mass loss-time curve (Jiang et al., 2010; Kissinger, 1957).
The activation energy, E, is obtained by plotting ln(ˇ/Tm2)
against 1/Tm. The slope,[ln(ˇ/Tm2)]/(1/Tm), being equal to−E/R.
The reaction order,n, is obtained from Eq.(10):
n=1.26S1/2 (10)
whereSis defined by Eq.(11). The value ofS, the shape index, can be calculated from the time derivative of the DTG curve (second derivative of mass loss-time curve), as follows:
S=
(d2˛/dt2) 1 (d2˛/dt2)
2
(11)
where subscripts 1 and 2 refer to the values of these quantities at the inflection points, i.e., where d3˛/dt3= 0. The pre-exponential factor,A, can be obtained by inserting the values ofnandEin Eq.
(9)and solving it.
3. Results and discussion
The chemical composition of depithed bagasse, prehydrolyzed depithed bagasse and cellulose pulp was determined using TAPPI standard methods and is shown inTable 1. As can be seen inTable 1, the cellulose pulp used in the batch acid hydrolysis experiments presents minimal quantity of lignin and low hemicelluloses and ash contents.
Soda-anthraquinone cellulose pulp obtained from depithed sug-arcane bagasse was hydrolyzed at 190, 210 and 225◦C in 0.07%
H2SO4(w/v) for various times. After the reaction time, the reactor was quenched in an ice bath and the residual cellulose pulp was separated from the hydrolysate by filtration on a sintered glass funnel. The residual pulp was washed and dried at 60◦C under
reduced pressure for 24 h and the weight loss after hydrolysis was measured. The number- and weight-average degrees of polymer-ization were measured by gel permeation chromatography (GPC). The crystallinity index was calculated by the Segal method (Segal
et al., 1959) and crystallite size was calculated for the three main crystal reflections (1 1 0, 1 1 0 and 2 0 0) by means of the Scherrer equation. The starting cellulose pulp and the residues after hydrol-ysis were subjected to dynamic thermogravimetric analhydrol-ysis under a nitrogen atmosphere at four different heating rates, in order to determine the effects of hydrolysis time, temperature, degree of polymerization and crystallite size on thermal decomposition of cellulose. In the following section the main results will be discussed.
3.1. Thermogravimetric analysis (TGA)
Dynamic thermogravimetric curves (TG) at four heating rates and their first derivative curves (DTG), for the starting cellulose pulp and samples hydrolyzed at 190, 210 and 225◦C for 80, 40
and 8 min, are shown inFig. 1(a–d). As can be seen, these curves are generally similar to those reported in the literature (Bouchard et al., 1989, 1990; Calahorra et al., 1989; Kim et al., 2010; Poletto et al., 2011). The initial small weight loss, which occurred at tem-peratures below 100◦C, represented 5% of the total weight loss on
average and was attributed to the vaporization of bound water in the samples. For all samples, this initial weight loss was followed by a plateau that extended to the start of the main decomposition event causing weight loss. As can be seen inTable 2, the onset tem-perature (Tonset), which indicates thermal stability, decreased as hydrolysis time increased for cellulose residues obtained after acid catalyzed hydrolysis at 190◦C in comparison with original cellulose
pulp. For cellulose residues obtained after hydrolysis at 210◦C and
225◦C, theTonset initially decreased as hydrolysis time increased
in comparison with original cellulose pulp and after which it was practically constant as hydrolysis time increased.
According toShafizadeh (1985), the main decomposition event consists of the depolymerization of cellulose to various anhy-drosugar derivatives and their volatilization. The mechanism of cellulose decomposition was recently elucidated byShen and Gu (2009), who studied cellulose pyrolysis in a thermogravimetric ana-lyzer coupled to the FTIR spectrophotometer. According toShen and Gu (2009), the main component detected was levoglucosan (1,6-anhydro--d-glucopyranose). After the main decomposition
event, a third event began, and the rate of weight loss was not constant.Bouchard et al. (1989)attributed this event to the slow combustion of the charred fraction, which is inhibited in a nitrogen atmosphere.
The differences in the decomposition profiles of the original cel-lulose pulp and its residues after dilute acid hydrolysis at 190, 210 and 225◦C for 80, 40 and 8 min, respectively, indicate the
differ-ences in initial decomposition temperature of these samples. In the following sections, the influence of degree of polymerization, crystallinity index and crystallite size will be discussed in detail.
3.2. Influence of degree of polymerization
Table 2shows the percentage of remaining pulp after dilute acid hydrolysis in 0.07% H2SO4(w/v) at 190, 210 and 225◦C,
number-and weight-average degrees of polymerization (DPnand DPw),
crys-talline index (CrI), crystallite size in the 1 1 0, 1 1 0 and 2 0 0 planes, initial (Ti), maximum (Tm) and final (Tf) temperatures for the main
decomposition event, char yield and activation energy (Ea) and
Fig. 1.TG and DTG curves at four heating rates for (a) starting cellulose pulp and samples of pulp hydrolyzed in 0.07% H2SO4, (b) 190◦C for 80 min, (c) at 210◦C for 40 min
and (d) at 225◦C for 8 min.
methods. The effect of number- and weight-average degrees of polymerization on the thermal decomposition of cellulose can be analyzed in more detail fromFig. 2, which showsTi,TmandTfas a
function of DPnand DPw.
It can be seen in Table 2 and Fig. 2, for cellulose residues hydrolyzed at 190, 210◦C and 225◦C, thatT
i, which indicates the
initial decomposition temperature, initially increased as number-and weight-average degrees of polymerization decreased, reaching a maximum value, after which it began to decrease for all reaction temperatures studied. Besides, the initial increase inTiwas lower as
the reaction temperature was increased from 190 to 225◦C. These
results indicate that the more severe the acid hydrolysis, the less resistant is the cellulose residue to thermal decomposition.
From the derivative thermogravimetric curves (DTG) (Fig. 1),
Tm values were determined as those temperatures at which the
rate of decomposition reaches its maximum value. As can be seen inTable 2 and Fig. 2, Tm decreased as DPn and DPwdecreased
for all reaction temperatures; in other words, peak decomposi-tion temperatures were shifted to lower values with falling DPn
and DPw. However,Tfvalues increased as DPnand DPwdecreased,
reaching a maximum value, for cellulose hydrolyzed at 210 and
225◦C, and beyond this maximum value a small decrease was
observed. For hydrolysis at 190◦C, T
f increased as DPn and DPw
decreased, reaching a maximum at the lowest values of DPn and
DPw. Besides,Tfexhibited a higher rate of increase with
decreas-ing DPnand DPwas the reaction temperature was increased from
190 to 225◦C. InTable 2it may be noted that the charred
frac-tion increased as DPnand DPwdecreased and also as the reaction
temperature was increased. This increase in the charred fraction becomes more marked as the reaction temperature was increased and consequently as DPn and DPwbecame more reduced. These
results suggest that cellulose decomposes at a lower temperature and that char formation is favored by falling DPnand DPw.
Similar results were observed byCalahorra et al. (1989), who studied the effect of molecular weight on thermal decomposition of cellulose, and byBouchard et al. (1989, 1990), who studied the thermal behavior of depolymerized cellulose residues produced by dilute acid hydrolysis in 0.4% H2SO4at 190◦C for various periods
Fig. 2.Variation of the temperatures ofTi,TmandTf(obtained from TG curves recorded at a heating rate of 10◦C/min) with DPnand DPwfor cellulose residues obtained from
Table 2 Physicochemical characteristics of cellulose pulp and residues after dilute acid hydrolysis and activation energies, pre-exponential factors an d reaction orders for the main stage of thermal decomposition of depolymerized cellulose residues, calculated by different methods.
Temperature ◦(C) Time (min) Remaining pulp (%) DP n DP w CrI (%)
L110 (nm)
L110 (nm)
L200 (nm)
Tonset ◦(C) Ti ( ◦C) Tm ( ◦C) Tf ( ◦C) M (%) Char at 800 ◦C (wt.%) ASTM E 1641 method Kissinger method Ea (kJ/mol) ln AE a (kJ/mol) ln An – 0 100.0 96 1356 62.0 5.520 5.379 4.387 357 230 386 415 86.4 2.1 167.5 ± 1.4 29.5 ± 0.3 162.5 ± 4.5 19.0 ± 0.8 0.97 ± 0.12 190 10 88.4 64 347 81.8 4.999 6.071 5.072 340 258 365 455 90.6 2.2 185.7 ± 8.8 28.4 ± 0.3 163.2 ± 16.0 20.3 ± 3.1 1.13 ± 0.06 20 82.5 54 267 81.3 4.976 6.024 5.235 331 236 356 477 91.6 2.2 185.5 ± 3.3 28.5 ± 0.6 173.2 ± 1.5 22.5 ± 0.3 1.11 ± 0.05 30 79.9 45 247 81.5 5.142 6.082 5.192 327 235 354 501 90.2 1.5 187.5 ± 3.3 30.1 ± 0.2 148.6 ± 11.9 17.8 ± 2.3 1.10 ± 0.07 80 66.4 40 205 76.5 5.069 6.447 5.070 323 212 357 511 91.8 2.5 144.4 ± 1.6 33.5 ± 0.2 139.3 ± 8.3 15.9 ± 1.6 1.03 ± 0.05 210 5 76.2 65 259 82.0 5.495 5.764 5.213 334 244 356 454 90.8 2.7 155.6 ± 2.0 34.4 ± 1.7 143.2 ± 4.3 16.8 ± 0.8 1.08 ± 0.09 10 63.1 34 194 81.1 5.766 7.760 5.224 332 230 360 450 89.0 3.1 156.6 ± 3.4 34.5 ± 0.6 167.4 ± 16.5 21.3 ± 3.2 1.09 ± 0.09 20 47.2 20 186 78.6 5.441 6.346 5.100 334 220 354 491 79.5 8.2 164.3 ± 0.8 35.2 ± 0.7 162.6 ± 9.3 20.6 ± 1.8 1.06 ± 0.15 40 38.3 12 166 78.5 5.497 6.331 5.251 332 213 358 464 64.1 16.5 182.9 ± 0.9 26.6 ± 0.3 166.8 ± 8.1 21.2 ± 1.6 1.23 ± 0.04 225 4 48.1 51 169 79.9 5.216 6.407 4.978 322 232 352 487 83.5 2.3 167.9 ± 1.2 31.0 ± 0.2 221.6 ± 11.7 32.1 ± 2.3 1.17 ± 0.08 6 37.1 24 146 80.7 5.237 7.532 5.152 323 235 351 521 74.6 6.9 189.4 ± 2.3 35.2 ± 0.5 181.9 ± 3.3 24.5 ± 0.7 1.19 ± 0.08 8 30.3 14 137 80.6 5.516 6.586 5.163 323 209 351 521 72.5 8.5 186.2 ± 1.5 34.6 ± 0.3 167.8 ± 9.2 21.8 ± 1.8 1.14 ± 0.07 12 17.9 8 132 78.2 5.005 4.540 4.990 325 206 348 511 66.2 10.7 211.5 ± 3.1 39.8 ± 0.7 170.2 ± 3.7 22.4 ± 0.7 1.13 ± 0.08 Avicel PH-101 – – 14.5 589 83.0 4.746 6.275 5.379 342 216 364 418 90.5 1.6 169.3 ± 3.3 30.5 ± 0.9 147.5 ± 4.9 17.2 ± 0.9 1.04 ± 0.03
analytical techniques such as TG, DSC, FTIR and DRIFTS and con-cluded that the additional resistance to thermal decomposition was provided by important structural and/or chemical rearrangements of the cellulose during acid hydrolysis.
Comparing the temperaturesTi,TmandTfobtained for Avicel
PH-101 and bagasse cellulose samples hydrolyzed at 190, 210 and 225◦C for 80, 40 and 8 min, respectively, it can be seen that the
temperaturesTiandTmfor these cellulose residues were close to
those of Avicel and thatTfalone deviates. To a first approximation,
these results suggest that these cellulose residues exhibited similar thermal decomposition behavior to that of Avicel.
The kinetics of thermal decomposition of the cellulose pulp and residues after acid hydrolysis was analyzed by the methods of Flynn and Wall (ASTM E 1641) and Kissinger.Table 2shows the resulting activation energies (Ea), pre-exponential factors (A) and reaction
orders (n).Fig. 3shows the activation energies calculated by the ASTM and Kissinger methods, plotted against DPnand DPw.
Accord-ing to the ASTM method, thermal decomposition obeys first-order kinetics. For the hydrolysis temperature of 190◦C, the activation
energy calculated by this method initially increased as DPn and
DPwdecreased and achieved a maximum value, after which it fell
sharply. For 210◦C, the activation energy initially decreased as DPn
and DPwdecreased, reaching a minimum, after which it increased as
DPnand DPwdecreased. For 225◦C, the activation energy was
prac-tically constant from the highest DPn(96) and DPw(1356) down
to 51 and 169. At lower molecular weights, the activation energy increased to a maximum of 211.5 kJ/mol. This value of activation energy was the highest observed for all hydrolysis temperatures studied, by the ASTM method.
Employing the Kissinger method, it was possible to calculate the reaction orders for the thermal decomposition of cellulose pulp and residues after acid hydrolysis. The reaction orders (n) showed some variation with DPnand DPw. The lower value ofnwas obtained with
the starting cellulose pulp (0.97). For the cellulose residues,n var-ied from 1.03 to 1.23. These values of reaction order indicate that both cellulose pulp and the residues with reduced DPn and DPw
after acid hydrolysis obeyed first-order decomposition kinetics, confirming that the ASTM method can be used to calculate kinetic parameters of cellulose decomposition. For the hydrolysis temper-ature of 190◦C, the activation energy calculated by the Kissinger
method was constant from DPnand DPwof 96 and 1356 to 64 and
347, respectively, at lower values of DPnand DPw, the activation
energy increased to a maximum and after which it fell sharply. For 210◦C, the activation energy decreased as DPnand DPwdecreased,
to reach a minimum value, after which it increased sharply and then remained practically constant. For 225◦C, the activation energy
increased sharply as DPnand DPwdecreased, achieving a maximum
value and then decreasing rapidly.
The activation energies for thermal degradation of cellulose residues hydrolyzed at 190, 210 and 225◦C for 80, 40 and 8 min,
calculated by the ASTM and Kissinger methods, differed by 17.2%, 8.0% and 10.0%, and 5.6%, 13.1% and 13.8%, from those obtained for Avicel PH-101, respectively. Considering the observed temper-aturesTiandTmand the activation energies obtained by the ASTM
and Kissinger methods, it may be suggested that cellulose residues obtained by ELA hydrolysis at 190, 210 and 225◦C for 80, 40 and
8 min presented similarities with Avicel. Subsequent interpreta-tion of the crystalline index and crystallite size in the next secinterpreta-tion will confirm this result. One important point to emphasize is that the comparisons of the physicochemical properties of the cellulose residues and Avicel have to take into consideration the differences by which each material is obtained. Furthermore, the possibility of using these residues in commercial applications is a matter of great interest in the field of biofuels and biomaterials.
Comparing the values ofEaobtained by the two analytical
Fig. 3.Variation of activation energy obtained by ASTM (a) and (b) and Kissinger (c) and (d) methods with DPnand DPwfor cellulosic residues hydrolyzed at 190◦C, 210◦C
and 225◦C.
ASTM method were in general higher than those calculated by Kissinger method. Nonetheless, for hydrolysis temperatures of 190 and 210◦C, similar profiles were observed, while for 225◦C,
con-trasting behavior was noted. The increase in activation energy as the degree of polymerization falls was also observed byCalahorra et al. (1989).Supplementary Table 1shows the values of activation energy calculated by Calahorra et al. (1989) for cellulose sam-ples containing various degrees of polymerization and crystallinity indices, employing the Freeman-Carroll and Broido methods. When the results obtained in this study are compared with those obtained byCalahorra et al. (1989), it is notable that the reaction order decreased as the degree of polymerization decreased in the cel-lulose samples prepared byCalahorra et al. (1989), whereas in this study the reaction order showed little variation, from 1.03 to 1.23. Thus, the fall in the activation energies calculated by the Freeman-Carroll and Broido methods, as degree of polymerization decreased, was greater than that obtained in this study.
3.3. Influence of crystallinity and crystallite size
As can be seen inTable 2,Tiinitially increased as the crystallinity
index and crystallite size in the 1 1 0 and 2 0 0 planes increased, for
cellulose samples hydrolyzed at 190, 210 and 225◦C. These results
suggest that an increase in the crystallinity index and crystallite size increases the initial decomposition temperature of the cellulose residues. This increase in the crystallinity index and crystallite size (in the 1 1 0 and 2 0 0 planes) may be related to the diminution in the amorphous cellulose region that was accompanied by weight losses of 11.6%, 23.8% and 51.9% in the first stages of the dilute acid hydrolysis at 190, 210 and 225◦C, respectively.Kim et al. (2010)
studied various cellulose samples and noticed that an increase in the crystallinity index and crystallite size provided higher thermal stability.Poletto et al. (2011)also studied cellulose pulp obtained by two pulping processes and observed a displacement of the DTG peak to higher temperatures with increasing crystallite size.
InTable 2, it is possible to observe that, for samples hydrolyzed at 190 and 225◦C, the activation energies calculated by both the
ASTM and Kissinger methods increased as crystallinity and crys-tallite size increased. For 210◦C, the influence of crystallinity and
crystallite size was not so clear.Kim et al. (2010)reported that the activation energy was not affected by the crystallinity index or crystallite size.
Fig. 4.SEM micrographs of (a) bagasse cellulose pulp, (b) Avicel PH-101, and (c) pulp hydrolyzed at 190◦C for 80 min, (d) at 210◦C for 40 min and (e) at 225◦C for 8 min.
225◦C for 80, 40 and 8 min were similar to Avicel PH-101. CrI for
these residues differed by 8.5%, 5.7% and 3.0% from Avicel and the crystallite size differed by 2.7%, 0.9% and 5.0% for the 1 1 0 plane and 6.1%, 2.4% and 7.8% for the 2 0 0 plane, whereas for the unhy-drolyzed bagasse cellulose pulp, CrI differed by 33.9% and crystallite sizes by 16.7% (1 1 0) and 22.6% (2 0 0). These results, in addition to those obtained from the degree of polymerization, thermal analysis
and kinetic decomposition studies, also indicate that the cellulose residues processed by ELA hydrolysis at 190, 210 and 225◦C have
cellulose residues of the dilute acid hydrolysis process, which may become an important product in a biorefinery with various appli-cations in developing green materials (Das et al., 2010) and as a precursor in the production of whiskers (nanocrystalline cellulose), with almost no weight loss (Das et al., 2009).
3.4. Scanning electron microscopy (SEM)
Fig. 4shows SEM micrographs of bagasse cellulose pulp, Avi-cel PH-101 and samples hydrolyzed at 190, 210 and 225◦C for 80,
40 and 8 min, respectively.Fig. 4a shows the bagasse pulp fibers in their initial condition. In this figure, the fibers exhibit a great variety of shapes and sizes, characterizing the great heterogene-ity of the bagasse pulp.Fig. 4b shows Avicel PH-101, a commercial microcrystalline cellulose, which is mainly composed of particles that have a rod-shaped fibers.Fig. 4c–e shows cellulose residues hydrolyzed at 190, 210 and 225◦C. For 190◦C (Fig. 4c), the particles
exhibited smaller length/width ratio than Avicel and it is apparent that shortening of the fibers took place, giving smaller elements. For 210◦C (Fig. 4d), the particles seem to be larger and more
frag-mented than for 190◦C and Avicel, but large fragments can still be
observed. For 225◦C (Fig. 4e), the particles seem to be rod-shaped
like Avicel, but much larger than Avicel, and flat elements can also be observed.
Particle size was measured with Image-Pro PlusTM 6.0 soft-ware. On average, a sample of one hundred particles was collected and analyzed statistically with StatisticaTM7.0 software.
Supplementary Fig. 1shows the particle length distributions of four samples, Avicel PH-101 and the bagasse pulp samples hydrolyzed at 190, 210, 225◦C for 80, 40 and 8 min, respectively. The particle
length distributions were best fitted by the lognormal distribution function. As can be seen inSupplementary Fig. 1, higher hydrolysis temperatures and shorter reaction times produced longer particles. Furthermore, higher temperatures and shorter reaction times pro-duced particles more heterogeneous in size, which can be seen from the increasing widths of the distributions. FromSupplementary Fig. 1it can be concluded that the cellulose residue hydrolyzed at 190◦C
for 80 min exhibited smaller particles than Avicel and that the latter showed particles smaller than the cellulose residues hydrolyzed at 210 and 225◦C for 40 and 8 min, respectively. Avicel PH-101
exhib-ited a particle length of 87.5±34.2m, while cellulose residues hydrolyzed at 190, 210 and 225◦C exhibited particle lengths of
38.0±20.1, 213.2±97.1 and 347.6±114.4m, respectively. The above morphology and particle size analysis leads to the conclusion that cellulose residues hydrolyzed at 190 and 210◦C
exhibited particle lengths similar to Avicel, while hydrolysis at 225◦C produced much larger particles.
3.5. Fourier transform infrared spectroscopy (FTIR)
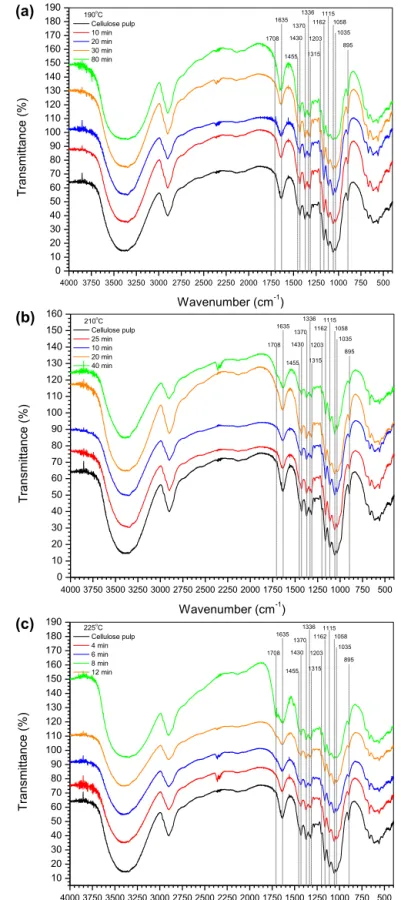
The FTIR spectra of cellulose pulp and samples hydrolyzed in 0.07% H2SO4(w/v) at 190◦C, 210◦C and 225◦C are given inFig. 5.
According to Bouchard et al. (1989), the appearance of a band around 1710 cm−1 is attributed to carbonyl formation on cellu-lose. In the cellulose samples hydrolyzed at 210 and 225◦C, a
band appeared at 1708 cm−1 and increased in intensity as reac-tion time and temperature were increased. According toBouchard et al. (1989), as the leveling-off degree of polymerization (LODP) is reached, this band appears. All the bands related to CH and/or CH2 vibrations at 1430, 1370, 1315 and 895 cm−1 decreased in intensity or almost disappeared as the reaction temperature was increased from 190◦C to 225◦C. According toBouchard et al. (1989),
a decreasing intensity or disappearance of these bands indicates an increase in the degree of oxidation. All the bands attributed to OH bending at 1455, 1336 and 1203 cm−1 are reduced in inten-sity. The bands at 1162, 1115, 1058 and 1035 cm−1, related to
asymmetric C–O–C bridge stretching, anhydroglucopyranose ring, C–OR stretching and C–O–C pyranose ring skeletal vibration (Poletto et al., 2011), were unaltered and/or strengthened as reac-tion time was increased for all temperatures. Only for a long reaction time, such as 80 min (190◦C), and/or the highest
tempera-ture (225◦C) and a reaction time of 12 min, was a fall in intensity of
the bands at 1058 and 1035 cm−1observed. According toBouchard
et al. (1989), these observations indicate that the pyranose ring is almost unchanged.
It can be concluded that the intensity of the carbonyl bands fol-lowed the extent of cellulose depolymerization, which is correlated with the number- and weight-average degrees of polymerization of cellulose residues, especially at higher temperatures. FTIR spec-tra of cellulose residues also indicated that the degree of chemical modification of cellulose increases with the severity of hydrolysis.
3.6. Comparison with bagasse microcrystalline cellulose (MCC) in literature
Tang et al. (1996) prepared MCC by treating bagasse pulp with 2.5 mol/L HCl at 105◦C for 15 min. This MCC from bagasse
was characterized by XRD and SEM, and the DP was deter-mined by measuring the intrinsic viscosity of the cellulose in a cuproethylenediamine solution. The crystallinity index was found to be 72%, crystallite size in the 1 0 1 and 2 0 0 lattice planes was 4.9 and 5.5 nm and DPv was 117.El-Sakhawy and Hassan (2007)
prepared MCC from bleached bagasse pulp by treating with 2 N HCl and/or H2SO4under reflux for 45 min, employing a solid-to-liquid ratio of 1:10, and characterized it by XRD, TGA, SEM and DP. Again DP was measured by intrinsic viscosity in cuprammo-nium hydroxide solution. Crystallinity was found to be 76% and 75%, crystallite size in the 2 0 0 plane was 4.42 nm and DPvwas 317
and 299 for HCl and H2SO4, respectively.TiandTmwere determined
by TGA carried out at a heating rate of 10◦C/min under a nitrogen
atmosphere and were found to be 251 and 252◦C for HCl and 325
and 322◦C for H2SO4, respectively. For comparison, the cellulose
residues hydrolyzed at 190, 210 and 225◦C for 80, 40 and 8 min
showed crystalline indices of 76.5%, 78.5% and 80.6%, respectively, and crystallite size in 1 0 1 and 2 0 0 planes of 6.082 and 5.070 nm for 190◦C, 6.331 and 5.251 nm for 210◦C and 4.540 and 4.990 nm
for 225◦C, which compare well with those obtained byTang et al.
(1996)andEl-Sakhawy and Hassan (2007), by traditional methods. DPnand DPwwere found to be 40 and 205 for 190◦C, 12 and 166 for
210◦C and 14 and 137 for 225◦C in this study. Considering that the
difference betweenMvandMwdepends on sample molar mass
dis-tribution andMw > Mv, it is possible to conclude that the degree
of polymerization of MCC prepared byTang et al. (1996)is close to that of the cellulose residues obtained in this study.TiandTm
were found to be 212 and 357 for 190◦C, 213 and 358 for 210◦C
and 206 and 348 for 225◦C, quite similar to those observed by
El-Sakhawy and Hassan (2007). From the above comparisons between literature data and the cellulose residues obtained in this study, it is possible to state that cellulose residues hydrolyzed at 190, 210 and 225◦C for 80, 40 and 8 min can be considered as microcrystalline
celluloses.
4. Conclusion
This study showed that the initial decomposition tempera-ture (Ti) of cellulose residues after extremely low acid hydrolysis
(ELA) increased as the degree of polymerization decreases and that this rise inTi diminished as hydrolysis became more severe by
increasing the reaction temperature from 190 to 225◦C. Activation
energies determined by the ASTM and Kissinger methods demon-strated that the severity of hydrolysis directly affects the energy
involved in the main decomposition step of the cellulose residues. Furthermore, XRD studies also showed that initial decomposition temperature (Ti) increased as crystalline index and crystallite size
in the 1 1 0 and 2 0 0 lattice planes increased. The thermal, XRD and SEM studies demonstrated that the cellulose residues obtained at 190, 210 and 225◦C for 80, 40 and 8 min, respectively, have
simi-lar thermal decomposition behavior, crystallinity index, crystallite size and particle size to Avicel PH-101 and can also be considered microcrystalline celluloses.
Acknowledgements
The authors are grateful to Conselho Nacional de Pesquisa e Desenvolvimento (CNPq), Fundac¸ão de Amparo à Pesquisa do Estado de São Paulo (FAPESP) and Oxiteno for providing financial support for this research. The authors also thank the Instituto de Química de São Carlos (IQSC), USP at São Carlos (SP, Brazil).
Appendix A. Supplementary data
Supplementary data associated with this article can be found, in the online version, atdoi:10.1016/j.indcrop.2011.11.009.
References
Bouchard, J., et al., 1989. Characterization of depolymerized cellulosic residues. 1. Residues obtained by acid-hydrolysis processes. Wood Sci. Technol. 23 (4), 343–355.
Bouchard, J., et al., 1990. Characterization of depolymerized cellulosic residues. 2. Residues derived from ethylene–glycol solvolysis of cellulose. Wood Sci. Tech-nol. 24 (2), 159–169.
Bradbury, A.G.W., et al., 1979. Kinetic-model for pyrolysis of cellulose. J. Appl. Polym. Sci. 23 (11), 3271–3280.
Broido, A., Nelson, M.A., 1975. Char yield on pyrolysis of cellulose. Combust. Flame 24 (2), 263–268.
Calahorra, M.E., et al., 1989. Thermogravimetric analysis of cellulose - effect of the molecular-weight on thermal-decomposition. J. Appl. Polym. Sci. 37 (12), 3305–3314.
CONAB. 2010. Companhia Nacional de Abastecimento. Avaliac¸ão da safra agrícola brasileira de cana-de-ac¸úcar, safra 2010, segundo levantamento, Setembro. (in Portuguese).
Das, K., et al., 2009. A study of the mechanical, thermal and morphological prop-erties of microcrystalline cellulose particles prepared from cotton slivers using different acid concentrations. Cellulose 16 (5), 783–793.
Das, K., et al., 2010. Study of the properties of microcrystalline cellulose particles from different renewable resources by XRD, FTIR, nanoindentation, TGA and SEM. J. Polym. Environ. 18 (3), 355–363.
Doyle, C.D., 1961. Kinetic analysis of thermogravimetric data. J. Appl. Polym. Sci. 5 (15), 285–292.
El-Sakhawy, M., Hassan, M.L., 2007. Physical and mechanical properties of micro-crystalline cellulose prepared from agricultural residues. Carbohydr. Polym. 67 (1), 1–10.
Flynn, J.H., Wall, L.A., 1966. A quick direct method for determination of activa-tion energy from thermogravimetric data. J. Polym. Sci. Polym. Lett. 4 (5PB), 323–328.
Friedman, H.L., 1964. Kinetics of thermal degradation of char-forming plastics from thermogravimetry. Application to phenolic plastic. J. Polym. Sci. Polym. Sym. (6pc), 183–195.
Jiang, G.Z., et al., 2010. A systematic study of the kinetics of lignin pyrolysis. Ther-mochim. Acta 498 (1–2), 61–66.
Kim, J.S., et al., 2001. Cellulose hydrolysis under extremely low sulfuric acid and high-temperature conditions. Appl. Biochem. Biotechnol. 91-3, 331–340.
Kim, U.J., et al., 2010. Thermal decomposition of native cellulose: influence on crys-tallite size. Polym. Degradr. Stabil. 95 (5), 778–781.
Kissinger, H.E., 1957. Reaction kinetics in differential thermal analysis. Anal. Chem. 29 (11), 1702–1706.
Nelson, M.L., Conrad, C.M., 1948. Improvements in the acid-hydrolysis method of determining the crystallinity of cellulose. Text. Res. J. 18 (3), 149–164.
Ozawa, T., 1965. A new method of analyzing thermogravimetric data. Bull. Chem. Soc. Jpn. 38 (11), 1881–1886.
Poletto, M., et al., 2011. Crystalline properties and decomposition kinetics of cellu-lose fibers in wood pulp obtained by two pulping processes. Polym. Degradr. Stabil. 96 (4), 679–685.
Segal, L., et al., 1959. An empirical method for estimating the degree of crystallinity of native cellulose using the X-ray diffractometer. Text. Res. J. 29, 786–794. Shafizadeh, F., 1985. Pyrolytic reactions and products of biomass. In: Overend, R.P.,
Milne, T.A., Mudge, L.K. (Eds.), Fundamentals of Thermochemical Biomass Con-version. Elsevier, London, pp. 183–214.
Sharples, A., 1957. The hydrolysis of cellulose and its relation to structure. Trans. Faraday Soc. 53 (7), 1003–1013.
Shen, D.K., Gu, S., 2009. The mechanism for thermal decomposition of cellulose and its main products. Bioresour. Technol. 100 (24), 6496–6504.
Tang, L.G., et al., 1996. Evaluation of microcrystalline cellulose. I. Changes in ultra-structural characteristics during preliminary acid hydrolysis. J. Appl. Polym. Sci. 59 (3), 483–488.
TAPPI, 2002. TAPPI Test Methods, T222 om-02. Acid-insoluble Lignin in Wood and Pulp. TAPPI Press, Atlanta.
TAPPI, 1993. TAPPI Test Methods, T211 om-93, Ash in Wood, Pulp, Paper and Paper-board: Combustion at 525◦C. TAPPI Press, Atlanta.
TAPPI, 2000. TAPPI Test Methods, T249 cm-00, Carbohydrate Composition of Extractive-free Wood and Wood Pulp by Gas-liquid Chromatography. TAPPI Press, Atlanta.
TAPPI, 1997. TAPPI Test Methods, T204 cm-97, Solvent Extractives of Wood and Pulp. TAPPI Press, Atlanta.
Wang, S., et al., 2007. Mechanism study on cellulose pyrolysis using thermogravi-metric analysis coupled with infrared spectroscopy. Front. Energy Power Eng. Chin. 1 (4), 413–419.
Xiang, Q., 2002. Conversion of Lignocellulosic Substrate into Chemicals: Kinetic Study of Dilute Acid Hydrolysis and Lignin Utilization, Ph.D. Thesis. University of Auburn, Alabama.
Xiang, Q., et al., 2003a. A comprehensive kinetic model for dilute-acid hydrolysis of cellulose. Appl. Biochem. Biotechnol. 105, 337–352.