RESUMO.- [Transferência de imunidade passiva e cons-tituintes séricos de bezerros mestiços.] A avaliação da transferência de imunidade passiva (TIP) é uma
ferramen-Passive immunity transfer and serum constituents of
crossbred calves
1Thaís G. Rocha2*, Ricardo P. Nociti3, Alexandre A.M. Sampaio4 and José Jurandir Fagliari5
ABSTRACT.- Rocha T.G., Nociti R.P., Sampaio A.A.M. & Fagliari J.J. 2012. Passive immuni-ty transfer and serum constituents of crossbred calves. Pesquisa Veterinária Brasilei-ra 32(6):515-522. Departamento de Clínica e Cirurgia Veterinária, Faculdade de Ciências
Agrárias e Veterinárias, Universidade Estadual Paulista Julio de Mesquita Filho, Campus de Jaboticabal, Via de Acesso Prof. Paulo Donato Castellane s/n, Jaboticabal, SP 14884-900, Brazil. E-mail: [email protected]
Passive immunity transfer (PIT) evaluation is an essential tool for the maintenance of healthy calves during the irst months of life. Since lactation number and breed have been proven to inluence immunoglobulin levels in colostrum, the aim of this study was to eva-luate PIT from primiparous and multiparous Canchim cows to their calves. Blood samples were collected from the calves before colostrum intake and 1, 2, 7, 15 and 30 days there-after, while colostrum samples from the cows were taken immediately after parturition. Activities of gamma-glutamyl transferase (GGT), alkaline phosphatase (ALP), and concen-trations of total protein, albumin, globulins, immunoglobulin A (IgA), immunoglobulin G (IgG), total and ionized calcium, inorganic phosphorus, magnesium, sodium and potassium were evaluated in calves’ serum and activities of GGT and ALP and concentrations of total protein, IgA and IgG were assessed in cow’s colostrum whey. Immunoglobulins concen-trations were evaluated by electrophoresis in polyacrylamide gels. Serum biochemistry evaluations revealed an increase in gamma-glutamyl transferase and alkaline phosphatase activities and in total protein, globulins, immunoglobulin A and immunoglobulin G levels in calves’ serum after colostrum intake. Only total protein and light chain immunoglobu-lin G levels in colostrum whey were affected by the cows’ lactation number. Phosphorus and magnesium levels in blood serum increased after colostrum intake, while sodium and potassium levels oscillated in the experimental period. PIT was inluenced by the cows’ lactation number but was eficient in both groups.
INDEX TERMS: Beef cattle, colostrum, serum constituents, immunoglobulins, SDS-PAGE.
1 Received on November 3, 2011.
Accepted for publication on February 14, 2012.
2 Pós-Graduanda do curso de Medicina Veterinária (Clínica Médica
Ve-terinária), FCAV-Unesp/Campus de Jaboticabal, Av. General Carneiro 460, apto 42, Centro, Jaboticabal, SP 14870-040, Brazil. *Corrersponding au-thor: [email protected]
3 Médico Veterinário Autônomo. E-mail: [email protected]
4 Docente do Departamento de Zootecnia, FCAV-Unesp/Campus de
Ja-boticabal, Via de Acesso Prof. Paulo Donato Castellane s/n, JaJa-boticabal, SP 14884-900. E-mail: [email protected]
5 Docente do Departamento de Clínica e Cirurgia Veterinária,
FCAV--Unesp, Jaboticabal, SP. E-mail: [email protected]
e IgG foram avaliadas no soro colostral. A concentração de imunoglobulinas foi avaliada por meio de eletroforese em gel de poliacrilamida. As avaliações bioquímicas do soro sanguíneo dos bezerros revelaram aumento nas atividades das enzimas gamaglutamiltransferase e fosfatase alcalina e nos teores de proteína total, globulinas, imunoglobulina A e imunoglobulina G após a ingestão do colostro. Apenas os teores de proteína total e imunoglobulina G de cadeia leve no soro colostral foram inluenciados pelo número de lac-tações das vacas. Os teores de fósforo e magnésio aumen-taram após a ingestão de colostro, enquanto as concentra-ções de sódio e potássio oscilaram no decorrer do período experimental. A TIP foi inluenciada pelo número de lacta-ções das vacas, no entanto mostrou-se eiciente em ambos os grupos.
TERMOS DE INDEXAÇÃO: Bovinos de corte, colostro, constituin-tes séricos, imunoglobulinas, SDS-PAGE.
INTRODUCTION
Diarrhea and respiratory disease problems are the most important inirmities of neonatal calves, causing the grea-test economic loss in this age group in both dairy and beef herds (Barrington et al. 2002, Callan & Gary 2002). Neona-tal calves need maternal immunological assistance in the irst hours after birth, provided by colostrum intake, since they have a higher likelihood of succumbing to infections that are innocuous to adult animals, so neonates that suffer failure of passive transfer of maternal immunoglobulins may be at increased risk for disease (Barrington & Parish 2001).
The importance of colostrum intake has been studied exhaustively and it has been known for more than a cen-tury that resistance to speciic diseases occurs through colostrum intake. It is widely recognized that maternal im-munoglobulins, immune cells and various cytokines are su-pplied to the neonate through colostrum because the syn-desmochorial structure of the ruminant placenta prevents prepartum transfer, so calves are born agammaglobuline-mic or signiicantly hypogammaglobulineagammaglobuline-mic (Fagliari et al. 1986, Barrington & Parish 2001).
The failure of passive immune transfer (FPIT) of co-lostrum immunoglobulins is as high in dairy calves that suckle from their dams as it is in those that receive bot-tled colostrum, but is lower in beef calves (Radostits et al. 2007). This difference may be due to the inluence of breed on colostrum quality. Some studies have found that beef cows produce colostrum with a higher content of immuno-globulins than dairy breeds (Besser & Gay 1994, Guy et al. 1994, Godden 2008). These differences may be due to the smaller volume of colostrum and the selective capacity of secretory cells to transport immunoglobulin G (IgG) from blood to mammary secretions in beef cows (Pritchett et al. 1991, Costa et al. 2008).
Greater calf vigor and a higher concentration of immu-noglobulins in the colostrum of beef cows allow for the intake of a smaller amount of colostrum to provide the concentration of immunoglobulins necessary for the pro-tection of beef calves in the irst months of life. However,
the volume of colostrum and the immunoglobulin concen-tration may vary widely in beef cows, especially in primipa-rous ones (Radostits et al. 2007).
There are many methods to quantitate the immunoglo-bulin concentration in calf serum after colostrum intake. The total protein level is an indirect but reliable way to evaluate the concentration of absorbed IgG (Borges et al. 2001). Serum protein levels below 4.2g/dL are conside-red highly sensitive and speciic for the detection of FPIT (Feitosa et al. 2001). Gamma-glutamyl tranferase (GGT) ac-tivity is another way to evaluate indirectly the passive im-munity transfer of immunoglobulins to calves. GGT activity in colostrum is high and its serum activity in calves that suckled or were fed colostrum is 60 to 160 times greater than in adult animals, and is correlated signiicantly with serum concentrations of IgG in calves (Fagliari et al. 1996, Radostits et al. 2007).
Furthermore, knowledge of the changes in the serum biochemical proile of calves, allied to other data obtained from the animals, may be useful for establishing initial ba-seline parameters for a patient, formulating a problem or rule-out list, conirming a diagnosis, determining the prog-nosis, planning therapeutic options, and monitoring res-ponse to treatment (Russel & Roussel 2007).
The aim of this study was to evaluate passive immunity transfer in beef calves born to primiparous or multiparous cows by analyzing the concentrations of alkaline phospha-tase, gamma-glutamyl transferase, total protein, albumin, globulins, immunoglobulin A and immunoglobulin G in the calves’ irst month of life, as well as levels of alkaline phos-phatase, gamma-glutamyl transferase, total protein, immu-noglobulins A and G in cows’ whey. Calves’ serum concen-trations of total and ionized calcium, inorganic phosphorus, magnesium, sodium and potassium were also assessed.
MATERIALS AND METHODS
Twenty-six healthy crossbred Canchim-Nelore calves were allot-ted to two experimental groups: group B1, comprising 13 calves born to primiparous cows, and group B2, comprising 13 calves born to multiparous cows (2-7 parturitions). Because colostrum samples from the dams were evaluated, they were also divided into two experimental groups: group V1, comprising 13 primipa-rous cows, and group V2, comprising 13 multipaprimipa-rous cows. The animals were submitted to clinical examination daily during the experimental period (Dirksen et al 1993). The experimental de-sign was approved by the Animal Ethics Committee of the School of Veterinary Medicine of the São Paulo State University (Unesp) at Jaboticabal, under protocol number 009793-08.
Blood samples were collected from the calves by jugular veni-puncture, using Vacutainer® tubes (Vacutainer, Becton Dickinson,
Franklin Lakes, NJ, USA) without anticoagulant, before colostrum intake and 1, 2, 7, 15, and 30 days after birth. The blood was cen-trifuged at 1.000 x g for 10 minutes, and serum samples were sto-red at -18°C until analysis.
Colostrum samples (n=26) were collected immediately af-ter parturition. Colostrum whey was obtained by adding 5ml of rennet (Coalho Estrella®, Chr. Hansen Brazil Ind. e Com. Ltda,
Gamma-glutamyl transferase (modiied Szasz method), alka-line phosphatase (modiied Bowers and McComb method), total protein (biuret method), albumin (bromocresol green method), calcium (CPC reaction), phosphorus (modiied Daly and Ertin-ghausen method), and magnesium (Labtest reaction) concen-trations were then determined spectrophotometrically in serum samples, using commercial reagents (Labtest Diagnostica, Lagoa Santa, Minas Gerais, Brazil). Ionized calcium, sodium and potas-sium levels were determined by the ion-selective electrode me-thod (9180 Electrolyte Analyzer, Roche Diagnostics, Mannheim, Germany). The same methodology was used for the evaluation of gamma-glutamyl transferase, alkaline phosphatase, and total pro-tein concentrations in colostrum whey of cows. Whenever neces-sary, the whey samples were diluted in deionized water as follo-ws: gamma-glutamyl transferase: day 0 = 1:150; total protein: day 0 = 1:3. Serum samples were also diluted for determination of GGT activity as follows: day 0 = 1:20; days 1-2 = 1:10.
Serum concentrations of globulins were calculated arithmeti-cally based on the difference between total protein and albumin concentrations in serum.
Electrophoretic separation of serum and whey proteins was carried out in polyacrylamide gels using the technique described by Laemmli (1970). After separation of protein fractions, the gel was colored in a 0.2% coomassie blue solution. Concentration of protein fractions was determined by use of computer assisted densitome-try (Shimadzu CS9301, Tokyo, Japan). Reference markers (Sigma, St Louis, MO, USA) with molecular weights of 24 kDa, 29 kDa, 36 kDa, 45 kDa, 55 kDa, 66 kDa, 97 kDa, 116 kDa, and 205 kDa were used to identify protein fractions associated with comparison with the electrophoretic mobility of puriied immunoglobulin A, and immu-noglobulin G (light chain and heavy chain). From up to 29 protein fractions identiied in calves’ serum and up to 16 protein fractions identiied in colostrum whey, only immunoglobulins A and G were analyzed to determine passive immunity transfer.
The data were analyzed by ANOVA and the differences among groups were compared by the Tukey test. Pearson’s correlation test was also used and differences were considered signiicant at P<0.05 in both tests (Zar 1999). Correlations above 0.50 were considered strong; between 0.30 and 0.49 were considered me-dium and below 0.29 were considered small.
RESULTS AND DISCUSSION
None of the calves in the experimental groups B1 and B2 presented any abnormalities such as diarrhea or pneumo-nia in the irst 30 days of life.
Serum activities of alkaline phosphatase (ALP) and gamma-glutamyl transferase (GGT) after colostrum intake were higher in group B1 than in group B2 (Table 1). In both groups the serum activity of ALP at birth was within the li-mits reported for cattle (Kaneko et al. 2008) (Table 6). Ho-wever, after colostrum intake, these levels rose 2 and 1.5-fold above the reference values in adult animals in groups B1 and B2, respectively, which is consistent with the indings of Knowles et al. (2000), who described an increase of four times the upper limit of the reference range in newborn cal-ves when compared to adults. Zanker et al. (2001) found an initial, transient rise in ALP activity in calves fed irst colos-trum at 0-2 hours after birth when compared to calves fed irst colostrum at 12-13 and 24-25 hours after birth. They attributed this increase to absorption of ALP from colostrum or to an enhanced endogenous production of this enzyme.
The absorption of GGT from colostrum in the irst hours after birth increased the activity of this enzyme in the cal-ves’ serum 199-fold in Group B1 and 111-fold in Group B2. These results are similar to those reported by Ježek et al. (2006) for dairy calves. It is likely that the higher volume of colostrum produced by multiparous cows worked as a dilution factor for this enzyme activity, which would jus-tify its higher activity in the serum samples of group B1. Contrary to our indings, Feitosa et al. (2010) reported higher GGT activity in the serum of Nelore calves born to multiparous cows (2,398±2,077 U/L) than in calves born to primiparous ones (1,911±2,336 U/L). In Holstein calves, however, these authors reported higher activity of GGT in serum of calves born to primiparous cows (774±549 U/L) than multiparous cows (673±449 U/L), which agrees with our results.
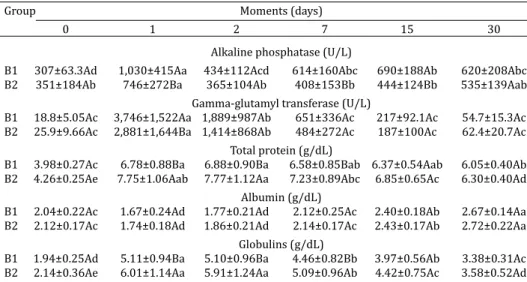
Table 1. Mean and standard deviation of enzymes and proteins in blood serum of Canchim-Nelore calves born to primiparous (B1) and multiparous (B2) cows before
colostrum intake (0) and after 1, 2, 7, 15, and 30 days of life
Group Moments (days)
0 1 2 7 15 30
Alkaline phosphatase (U/L)
B1 307±63.3Ad 1,030±415Aa 434±112Acd 614±160Abc 690±188Ab 620±208Abc B2 351±184Ab 746±272Ba 365±104Ab 408±153Bb 444±124Bb 535±139Aab
Gamma-glutamyl transferase (U/L)
B1 18.8±5.05Ac 3,746±1,522Aa 1,889±987Ab 651±336Ac 217±92.1Ac 54.7±15.3Ac B2 25.9±9.66Ac 2,881±1,644Ba 1,414±868Ab 484±272Ac 187±100Ac 62.4±20.7Ac
Total protein (g/dL)
B1 3.98±0.27Ac 6.78±0.88Ba 6.88±0.90Ba 6.58±0.85Bab 6.37±0.54Aab 6.05±0.40Ab B2 4.26±0.25Ae 7.75±1.06Aab 7.77±1.12Aa 7.23±0.89Abc 6.85±0.65Ac 6.30±0.40Ad
Albumin (g/dL)
B1 2.04±0.22Ac 1.67±0.24Ad 1.77±0.21Ad 2.12±0.25Ac 2.40±0.18Ab 2.67±0.14Aa B2 2.12±0.17Ac 1.74±0.18Ad 1.86±0.21Ad 2.14±0.17Ac 2.43±0.17Ab 2.72±0.22Aa
Globulins (g/dL)
B1 1.94±0.25Ad 5.11±0.94Ba 5.10±0.96Ba 4.46±0.82Bb 3.97±0.56Ab 3.38±0.31Ac B2 2.14±0.36Ae 6.01±1.14Aa 5.91±1.24Aa 5.09±0.96Ab 4.42±0.75Ac 3.58±0.52Ad Mean values followed by the same upper case letters in the same column and lower case letters on the
No differences were found in ALP or GGT activities in colostrum whey of V1 and V2 cows (Table 4). Zanker et al. (2001) reported ALP and GGT activities of 1,168 U/L and 30,479 U/L, respectively, in colostrum whey of cows up to 2 hours after parturition. According to these authors, whey GGT activity is very high immediately after parturition, de-clining gradually over the subsequent days. Hoffmann & Solter (2008) reported that GGT is absorbed passively from colostrum whey by neonates and can be used as an easy and reliable method to assess the eficiency of passive im-munity transfer in this species, as ratiied by our results.
Serum levels of total protein and globulins were higher in Group B2 after colostrum intake than in group B1 (Table 1). Total protein levels in serum at birth were lower than reference values for cattle in both groups (Kaneko et al. 2008) (Table 6), which is consistent with the indings of Knowles et al. (2000) who reported that concentrations of total protein were approximately 1 g/dL below the lower li-mit of reference range at birth. There were no low values of total protein or globulin levels in either of the experimental groups after natural intake of colostrum. Contrary to our indings, Costa et al. (2008) did not detect any inluence of parturition number in the total protein and globulin levels of Nelore and Limousin calves. However, Feitosa et al. (2010) reported that Holstein calves born to multipa-rous cows presented higher levels of total protein in serum (6.45 ± 1.25 g/dL) than calves born to primiparous cows (6.06±1.18g/dL). The difference between groups observed in our study did not relect an inability of primiparous cows to produce an adequate volume and quality of colostrum for their offspring.
Serum levels of total protein were strongly correlated with serum activity of GGT (r=0.52, P<0.01), and globulins (r=0.97, P<0.01) (Table 5). The correlation between GGT activity and serum concentration of globulins was also strong (r=0.62, P<0.01) (Table 5) and very close to the va-lues reported by Fagliari et al. (1996), conirming that total protein levels and GGT activity are reliable indicators of PIT in calves.
Albumin concentrations did not differ between groups (Table 1). A decline in serum albumin levels in the irst two days of life had already been reported by Kurz & Willett (1991); after these moments, the mean concentration of al-bumin increased slowly from birth to 30 days of age in both groups, which was also reported by Knowles et al. (2000) and Ježek et al. (2006).
Total whey protein levels in group V2 cows were higher than in group V1 (Table 4). The total protein concentration in colostrum whey was similar to that reported by Sant’ana (2004). Zarcula et al. (2010) reported that the cow’s bre-ed, parity, feed intake and yield production inluence the chemical composition of irst colostrum. According to these authors, the lower the yield of milk the better its chemical composition, which is contrary to our indings in regards to protein concentration.
The total protein content of irst colostrum whey from V1 and V2 cows presented a strong correlation to total pro-tein (r=0.53; P<0.01) and a medium correlation to total IgG (r=0.41; P<0.05) in the blood serum of B1 and B2 calves, respectively, 24 hours after birth (Table 5).
The electrophoretic separation of serum proteins reve-aled a higher concentration of immunoglobulin A (IgA) in group B2 calves than in group B1 after colostrum intake, al-though the difference was not statistically signiicant. Sta-tistical differences were noted only at 7 and 30 days of age, and serum levels of IgA increased gradually, with maximum concentrations found at 15 days (Table 2). The concentra-tion of this protein in group B2 was similar to that reported by Hurley (2003).
Although not statistically different, the IgA concentra-tion in the colostrum whey of group V2 cows was higher (Table 4), which may explain the difference in the concen-tration of this protein in the calves’ blood serum. Kehoe et al. (2007), who used the radial immunodiffusion technique, reported much lower IgA levels in the colostrum of Hols-tein cows than we found in our study (166 mg/dL) and at-tributed this inding to the characteristics of the colostrum and to the technique.
Table 2. Mean and standard deviation of immunoglobulins in blood serum of Canchim-Nelore calves born to primiparous (B1) and multiparous (B2) cows
before colostrum intake (0) and after 1, 2, 7, 15, and 30 days of life
Group Moments (days)
0 1 2 7 15 30
Immunoglobulin A (mg/dL)
B1 84.4±12.7Ab 259±105Aa 269±100Aa 313±169Ba 336±148Aa 277±106Ba B2 84.6±15.6Ac 322±115Ab 307±116Ab 411±134Aa 423±133Aa 374±111Aab Heavy chain immunoglobulin G (mg/dL)
B1 417±231Ad 1,692±342Aa 1,628±286Aa 1,313±697Ab 826±184Ac 594±109Acd B2 402±268Ad 1,866±512Aa 1,812±450Aa 1,287±334Ab 920±233Ac 650±135Acd
Light chain immunoglobulin G (mg/dL)
B1 3.31±3.18Ad 959±359Aa 922±376Aa 722±332Aab 482±162Abc 323±104Ac B2 8.73±9.59Ad 1,053±616Aa 1,010±607Aa 722±368Ab 562±247Abc 384±142Ac
Total immunoglobulin G (mg/dL)
B1 420±232Ad 2,651±624Aa 2,550±587Aa 2,035±995Ab 1,308±334Ac 917±194Ac B2 410±267Ad 2,918±852Aa 2,822±865Aa 2,010±580Ab 1,483±422Ac 1,034±253Ac Mean values followed by the same upper case letters in the same column and lower case letters on the
The serum levels of IgA presented a strong correlation to serum concentrations of total protein (r=0.68, P<0.01) and globulins (r=0.60, P<0.01). Fagliari et al. (2006) repor-ted immunoglobulin A concentrations of 258±15.1mg/dL in healthy Holstein calves 6-12 months old. According to Kaneko et al. (2008), IgA levels in adult cattle range from 10 to 50mg/dL, which is much lower than our indings.
No differences were found in the concentrations of he-avy chain IgG, light chain IgG and total IgG in the calves’ serum (Table 2). Increases of 4 and 4.6-fold were found in heavy chain IgG concentrations; 290 and 121-fold in light chain IgG, and 6.31 and 7.12-fold in total IgG (groups B1 and B2, respectively), on day 1 when compared with day 0 (Table 2), indicating that light chain IgG levels presented the highest increase after colostrum intake by neonatal cal-ves.
Serum concentrations of IgG 24 hours after birth were strongly correlated do GGT activity (r=0.69, P<0.01), total protein (r=0.85, P<0.01), and globulins (r=0.91, P<0.01) at the same moment in time (Table 5); hence, these para-meter showed a similar tendency for variation, increasing after colostrum intake. The same tendency was reported by other authors (Borges et al. 2001, Pauletti et al. 2002). Cos-ta et al. (2008) also noted higher concentrations of gamma globulins 24 to 36 hours after birth due to the absorption of colostrum immunoglobulins. Immunoglobulin concentra-tions in precolostral calves are normally zero or very low; however, the presence of gamma globulins in serum is de-tectable just a few hours after colostrum intake. Calves that receive insuficient colostrum present a minimal increase in immunoglobulin levels in serum (Eckersall 2008), and FPIT is considered when IgG levels are below 800mg/dL 24 hours after birth, while concentrations above 1,500mg/ dL of serum IgG at that time are considered ideal for PIT
(Dewell et al. 2006, Waldner & Rosengren 2009). In our study, all the animals reached desirable levels of serum IgG through natural suckling.
It is important to be aware of not only the role of the concentration of blood serum parameters but also the im-pact of management practices in the exposure of animals to potential pathogens. Management practices must be diffe-rent between dairy and beef cows and its calves, since their environment in completely opposite (Feitosa et al. 2010). Beef calves are less challenged by pathogens in extensive management practices than dairy calves, that are conined (Costa et al. 2008). Feitosa et al. (2010) reported a lower serum concentration of IgG in Nelore calves when compa-red to Holstein calves at 24 hours of life, and that, conside-ring only the evaluation of IgG levels, beef calves presented a lower FPIT than dairy calves at 24 hours of age. The milk yield is also important, since primiparous beef cows may produce insuficient amounts of colostrum to feed and pro-tect their calves.
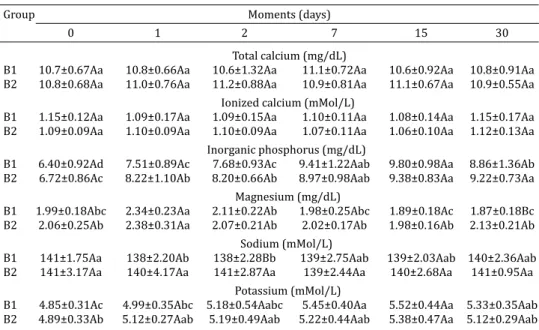
Table 3. Mean and standard deviation of mineral concentration in blood serum of Canchim-Nelore calves born to primiparous (B1) and multiparous (B2) cows before
colostrum intake (0) and after 1, 2, 7, 15, and 30 days of life
Group Moments (days)
0 1 2 7 15 30
Total calcium (mg/dL)
B1 10.7±0.67Aa 10.8±0.66Aa 10.6±1.32Aa 11.1±0.72Aa 10.6±0.92Aa 10.8±0.91Aa B2 10.8±0.68Aa 11.0±0.76Aa 11.2±0.88Aa 10.9±0.81Aa 11.1±0.67Aa 10.9±0.55Aa
Ionized calcium (mMol/L)
B1 1.15±0.12Aa 1.09±0.17Aa 1.09±0.15Aa 1.10±0.11Aa 1.08±0.14Aa 1.15±0.17Aa B2 1.09±0.09Aa 1.10±0.09Aa 1.10±0.09Aa 1.07±0.11Aa 1.06±0.10Aa 1.12±0.13Aa
Inorganic phosphorus (mg/dL)
B1 6.40±0.92Ad 7.51±0.89Ac 7.68±0.93Ac 9.41±1.22Aab 9.80±0.98Aa 8.86±1.36Ab B2 6.72±0.86Ac 8.22±1.10Ab 8.20±0.66Ab 8.97±0.98Aab 9.38±0.83Aa 9.22±0.73Aa
Magnesium (mg/dL)
B1 1.99±0.18Abc 2.34±0.23Aa 2.11±0.22Ab 1.98±0.25Abc 1.89±0.18Ac 1.87±0.18Bc B2 2.06±0.25Ab 2.38±0.31Aa 2.07±0.21Ab 2.02±0.17Ab 1.98±0.16Ab 2.13±0.21Ab
Sodium (mMol/L)
B1 141±1.75Aa 138±2.20Ab 138±2.28Bb 139±2.75Aab 139±2.03Aab 140±2.36Aab B2 141±3.17Aa 140±4.17Aa 141±2.87Aa 139±2.44Aa 140±2.68Aa 141±0.95Aa
Potassium (mMol/L)
B1 4.85±0.31Ac 4.99±0.35Abc 5.18±0.54Aabc 5.45±0.40Aa 5.52±0.44Aa 5.33±0.35Aab B2 4.89±0.33Ab 5.12±0.27Aab 5.19±0.49Aab 5.22±0.44Aab 5.38±0.47Aa 5.12±0.29Aab Mean values followed by the same upper case letters in the same column and lower case letters on the same
line do not differ signiicantly according to Tukey test (P<0.05).
Table 4. Mean and standard deviation of enzyme activity and protein concentrations in colostrum whey of primiparous (V1) and multiparous (V2) Canchim cows immediately after
parturition
Parameter Groups
V1 V2
Alkaline phosphatase (U/L) 572±251 A 646±468 A
Gamma-glutamyl transferase (U/L) 36,977±20,021 A 32,044±15,130 A
Total protein (g/dL) 14.3±3.48 B 16.5±2.59 A
Immunoglobulin A (mg/dL) 578±294 A 666±377 A
Heavy chain immunoglobulin G (mg/dL) 3,842±1,367 A 4,008±1,468 A
Light chain immunoglobulin G (mg/dL) 4,046±1,279 B 4,649±892 A
Total immunoglobulin G (mg/dL) 7,888±2,286 A 8,657±1,795 A
Heavy chain IgG and total IgG concentrations in colos-trum whey did not differ between groups V1 and V2; howe-ver, light chain IgG levels were higher in V2 cows (Table 4). IgG concentrations in the colostrum whey of both groups were higher than reported by Kehoe et al. (2007) in the co-lostrum of Holstein cows.
Sant’Ana (2004) reported inluence of lactation number in immunoglobulin concentrations in colostrum, with irst
lactation cows presenting an intermediate level of immuno-globulins, second lactation cows presenting lower values and cows of four or more lactations presenting higher values. In our study, the inluence of lactation number on immunoglo-bulin concentration was signiicant only for light chain IgG concentration, which was higher in multiparous cows.
Total IgG concentrations in colostrum whey of cows on the day of parturition presented a medium correlation with Table 5. Correlation between assessed parameters (g/dL) in blood
serum of Canchim-Nelore calves at one day of age and whey of Canchim cows immediately after parturition
Total proteinS GlobulinsS GGTS ALPS IgGS Total proteinW
Total proteinS 0.97** 0.52** 0.30**
GGTS 0.62**
IgAS 0.68** 0.60**
IgGS 0.85** 0.91** 0.69**
Total proteinW 0.53** 0.41*
IgGW 0.40* 0.70**
*P<0,05; ** P<0,01;
S = serum concentration at one day of age; W=whey concentration on the day of par-turition.
Table 6. Results from previous studies on serum concentration of total protein, albumin, globulins, activities of gamma-glutamyl transferase, alkaline phosphatase and minerals of calves from birth to 30 days of age and adult cattle
Parameter Author/year Breed Moments (days)
1 2 7 15 30
Total protein (g/dL) Fagliari et al. 1998 Nelore 6.07±0.73 - - 6.66±0.49 6.79±0.41
Fagliari et al. 1998 Holstein 6.52±0.94 - - 6.65±0.87 6.66±0.80
Ježek et al. 2006 Dairy calves 5.46±0.71 - 5.37±0.52 5.38±0.54 5.38±0.37 Rizzoli et al. 2006 Holstein 6.92±0.91 6.95±1.05 - 6.17±0.79 5.89±0.82 Kaneko et al. 2008 Adult cattle 6.74-7.46
Piccione et al. 2010 Limousin 5.77±1.11 6.53±1.20 5.37±0.72 5.96±1.28 5.56±0.82 Albumin (g/dL) Ježek et al. 2006 Dairy calves 2.65±0.16 - 2.94±0.23 3.09±0.19 3.22±0.19 Rizzoli et al. 2006 Holstein 2.12±0.23 2.23±0.27 - 2.34±0.28 2.37±0.22 Kaneko et al. 2008 Adult cattle 3.03-3.55
Globulin (g/dL) Fagliari et al. 1998 Nelore 3.38±0.48 - - 3.92±0.37 4.03±0.37 Fagliari et al. 1998 Holstein 3.93±0.69 - - 4.02±0.66 3.96±0.56 Kaneko et al. 2008 Adult cattle 3.00-3.48
ALP (U/L) Fagliari et al. 1998 Nelore 440±132 - - 357±107 281±93.0
Fagliari et al. 1998 Holstein 416±115 - - 338±101 280±75.4
Kaneko et al. 2008 Adult cattle 0-488
GGT (U/L) Fagliari et al. 1998 Nelore 718±215 - - 199±81.0 46.6±13.0
Fagliari et al. 1998 Holstein 790±296 - - 180±73.3 43.3±15.0
Ježek et al. 2006 Dairy calves 469±416 - 104±78 54±36 34±19
Kaneko et al. 2008 Adult cattle 6.1-17.4
Total Calcium (mg/dL) Ježek et al. 2006 Dairy calves 11.6±1.12 - 10.5±0.68 10.0±0.8 10.2±0.72 Rizzoli et al. 2006 Holstein 11.0±1.09 10.6±0.98 - 9.75±1.00 10.32±0.86 Kaneko et al. 2008 Adult cattle 9.7-12.4
Inorganic phosphate (mg/dL) Fagliari et al. 1998 Nelore 6.85±0.83 - - 6.90±1.01 6.38±1.09 Fagliari et al. 1998 Holstein 6.57±0.98 - - 6.66±0.95 6.20±0.99 Ježek et al. 2006 Dairy calves 8.27±1.15 - 9.72±0.99 9.32±0.93 8.85±0.96 Rizzoli et al. 2006 Holstein 7.12±0.94 7.86±0.87 - 8.53±1.00 7.95±0.85 Kaneko et al. 2008 Adult cattle 5.6-6.5
Piccione et al. 2010 Limousin 6.28±0.87 8.23±1.05 10.4±1.3 10.7±1.08 12.1±1.18 Magnesium (mg/dL) Fagliari et al. 1998 Nelore 2.22±0.19 - - 2.47±0.20 2.30±0.16 Fagliari et al. 1998 Holstein 2.24±0.28 - - 2.28±0.25 2.24±0.22 Rizzoli et al. 2006 Holstein 2.74±0.26 2.56±0.33 - 2.74±0.28 2.81±0.34 Kaneko et al. 2008 Adult cattle 1.8-2.3
Piccione et al. 2010 Limousin 1.80±0.02 1.75±0.02 1.82±0.02 1.80±0.02 1.80±0.02 Sodium (mmol/L) Ježek et al. 2006 Dairy calves 142±3.09 - 143±2.97 145±2.28 145±2.21 Kaneko et al. 2008 Adult cattle 132-152
Piccione et al. 2010 Limousin 132±2.48 135±3.58 136±5.31 136±3.37 133±4.56 Potassium (mmol/L) Ježek et al. 2006 Dairy calves 5.56±0.56 - 6.52±0.64 6.41±0.63 6.22±0.52 Kaneko et al. 2008 Adult cattle 3.9-5.8
total protein in the blood serum of calves 24 hours after birth (r=0.40; P<0.05) and a strong correlation with total protein (r=0.70; P<0.01) in colostrum whey, respectively (Table 5). This indicates that the rise in total protein con-centration in calves’ serum is due to intake of colostral pro-teins, remarkably immunoglobulin G.
No differences were found in the serum levels of total calcium and ionized calcium between groups B1 and B2 or moments (Table 3). However, although total calcium con-centrations in serum remained within the reference range of values for adult cattle (Kaneko et al. 2008) (Table 6), io-nized calcium levels were below the reference for this spe-cies (Kaneko et al. 2008).
Serum inorganic phosphorus concentrations from birth to 30 days old (Table 3) were higher than those reported by Fagliari et al. (1998) in Holstein and Nelore calves (Ta-ble 6). The serum inorganic phosphorus levels in groups B1 and B2 were higher than the reference values in adult cattle (Kaneko et al. 2008) (Table 6). According to Rosol & Capen (1997), this is due to the action of growth hormone, which is highly active in young animals and increases the renal absorption of inorganic phosphorus.
Serum magnesium levels increased after colostrum intake in both groups B1 and B2 (Table 3), but remained within the range of reference values for cattle (Kaneko et al. 2008) (Table 6) throughout the experimental period. Fagliari et al. (1998) and Piccione et al. (2010) found no age-related inluence in magnesium concentrations during the irst month of life in Nelore and Holstein, and Limousin calves, respectively.
Serum sodium concentrations (Table 3) in B1 calves va-ried in the irst month of life, with the highest values found on day 0 and the lowest on day 2, while group B2 presented no differences between moments. The absence of an age--related factor inluencing sodium concentrations, as found in calves born to multiparous cows, was also reported by Piccione et al. (2010) (Table 6). Potassium levels remained within the reference range for cattle throughout the expe-rimental period (Kaneko et al. 2008) (Table 6) and there were no differences between groups (Table 3). Age was found to inluence the serum concentrations of potassium in the irst month of life, unlike the indings of Piccione et al. (2010) (Table 6), who reported higher levels of potas-sium than we found in our study.
CONCLUSION
Based on our indings, it can be concluded that despite the differences in serum parameters between calves born to primiparous and multiparous cows, passive immunity transfer was satisfactory in all the calves of both experi-mental groups.
Acknowledgement.- To FAPESP (Brazil) for the inancial support and scholarships granted.
REFERENCES
Barrington G.M. & Parish S.M. 2001. Bovine neonatal immunology. Vet. Clin. Food Anim. 17:463-476.
Barrington G.M., Gay J.M. & Evermann J.F. 2002. Biosecurity for neonatal gastrointestinal diseases. Vet. Clin. Food Anim. 18:7-34.
Besser T.E. & Gay C.C. 1994. The importance of colostrum to the health of the neonatal calf. Vet. Clin. Food Anim. 10:107-117.
Borges A.S., Feitosa F.L.F., Benesi F.J., Birgel E.H. & Mendes L.C.N. 2001. In-luência da forma de administração e da quantidade fornecida de colos-tro sobre a concentração de proteína total e de suas frações elecolos-troforé- eletroforé-ticas no soro sangüíneo de bezerros da raça Holandesa. Arq. Bras. Med. Vet. Zootec. 53:629-634.
Callan R.J. & Garry F.B. 2002. Biosecurity and bovine respiratory disease. Vet. Clin. Food Anim. 18:57-77.
Costa M.C., Flaiban K.K.M.C., Coneglian M.M., Feitosa F.L.F., Balarin M.R.S. & Lisbôa J.A.N. 2008. Transferência de imunidade passiva em bezerros das raças Nelore e Limousin e proteinograma sérico nos primeiros quatro meses de vida. Pesq. Vet. Bras.28:410-416.
Dewell R.D., Hungerford L.L., Keen J.E., Laegreid W.W., Grifin D.D., Rupp G.P. & Grotelueschen D.M. 2006. Association of neonatal serum immuno-globulin G1 concentration with health and performance in beef calves. J. Am. Vet. Med. Assoc.228:914-921.
Dirksen G., Gründer H.D., Stöber M. 1993. Exame clínico dos bovinos. 3ª ed., Guanabara Koogan, Rio de Janeiro. 419p.
Eckersall P.D. 2008. Proteins, proteomics, and the dysproteinemias, p.117-155. In: Kaneko J.J., Harvey J.W. & Bruss M.L. (Eds), Clinical Biochemis-try of Domestic Animals. 6th ed. Academic Press, San Diego.
Fagliari J.J., Lucas A., Ferreira Neto J.M. & Oliveira J.A. 1986. Quadro se-roproteico de bezerros submetidos a 3 sistemas e imunização contra paratifo. Arq. Bras. Med. Vet. Zootec. 38:665-683.
Fagliari J.J., Oliveira E.C., Pegorer M.F., Ferrante Junior L.C. & Campos Filho E. 1996. Relação entre o nível sérico de gamaglobulinas e as atividades de gamaglutamiltransferase, fosfatase alcalina e aspartato aminotrans-ferase de bezerros recém-nascidos. Arq. Bras. Med. Vet. Zootec. 48:105-112.
Fagliari J.J., Santana A.E., Lucas F.A., Campos Filho E. & Curi P.R. 1998. Constituintes sanguíneos de bovinos recém-nascidos das raças Nelore (Bos indicus) e Holandesa (Bos taurus) e de bubalinos (Bubalus bubalis) da raça Murrah. Arq. Bras. Med. Vet. Zootec. 50:253-262.
Fagliari J.J., Rizzolli F.W. & Silva D.G. 2006. Proteinograma sérico de bezer-ros recém-nascidos da raça Holandesa obtido por eletroforese em gel de poliacrilamida. Arq. Bras. Med. Vet. Zootec.57:1-4.
Feitosa F.L.F., Birgel E.H., Mirandola R.M.S. & Perri S.H.V. 2001. Diagnóstico de falha de transferência de imunidade passiva em bezerros através da determinação de proteína total e de suas frações eletroforéticas, imu-noglobulinas G e M e da atividade da gamaglutamiltransferase no soro sangüíneo. Ciência Rural31:251-255.
Feitosa F.L.F., Camargo D.G., Yanaka R., Mendes L.C.N., Peiró J.R., Bovino F., Lisboa J.A.N., Perri S.H.V. & Gasparelli E.R.F. 2010. Índices de falha de transferência de imunidade passive (FTIP) em bezerros holandeses e nelores, às 24 e 48 horas de vida: valores de proteína total, de gamaglo-bulina, de imunoglobulina G e da atividade sérica de gamaglutamiltrans-ferase, para o diagnóstico de FTIP. Pesq. Vet. Bras. 30:696-704. Godden S. 2008. Colostrum management for dairy calves. Vet. Clin. Food
Anim.24:19-39.
Guy M.A., McFadden T.B., Cockrell D.C. & Besser T.E. 1994. Regulation of colostrum formation in beef and dairy cows.J. Dairy Sci. 77:3002-3007. Hoffmann W.E. & Solter P.F. 2008. Diagnostic enzymology of domestic
ani-mals, p.351-378. In: Kaneko J.J., Harvey J.W. & Bruss M.L. (Eds), Clinical Biochemistry of Domestic Animals. 6th ed. Academic Press, San Diego.
Hurley W.L. 2003. Immunoglobulins in mammary secretions, Vol.1 – Pro-teins, p.421-447. In: Fox P.F. & McSweeney P.H.L. (Eds), Advanced Dairy Chemistry. 3rd ed. Kluwer Academic, New York.
Ježek J., Klopčič M. & Klinkon M. 2006. Inluence of age on biochemical parameters in calves. Bull. Vet. Inst. Pulawy 50:211-214.
Kaneko J.J., Harvey J.W. & Bruss M.L. 2008. Clinical Biochemestry of Do-mestic Animals. 6th ed. Academic Press, San Diego. 916p.
Knowles T.G., Edwards J.E., Bazeley K.J., Brown S.N., Butterworth A. & War-riss P.D. 2000. Changes in the blood biochemical and haematological proile of neonatal calves with age. Vet. Rec. 147: 593-598.
Kurz M.M. & Willett L.B. 1991. Carbohydrate, enzyme, and hematology dy-namics in newborn calves. J. Dairy Sci.74:2109-2118.
Laemmli U.K. 1970. Cleavage of structural proteins during the assembly of the head of bacteriophage T4. Nature 227:680-685.
Pauletti P., Machado Neto R., Packer I.U. & Bessi R. 2002. Avaliação de ní-veis séricos de imunoglobulina, proteína e o desempenho de bezerras da raça Holandesa. Pesq. Agropec. Bras. 37:89-94.
Piccione G., Casella S., Pennisi P., Giannetto C., Costa A. & Caola G. 2010. Monitoring of physiological and blood parameters during perinatal and neonatal period in calves. Arq. Bras. Med. Vet. Zootec. 62:1-12.
Pritchett L.C., Gay C.C., Besser T.E. & Hancock D.D. 1991. Management and production factors inluencing IgG1concentration in colostrum from Holstein cows. J. Dairy Sci. 74:2336-2341.
Radostits O.M., Gay G.C., Blood D.C. & Hinchcliff K.W. 2007. Clínica Vete-rinária: Um tratado de doenças dos bovinos, ovinos, suínos, caprinos e equinos. 9ª ed. Guanabara Koogan, Rio de Janeiro. 1737p.
Rizzoli F.W., Fagliari J.J., Silva D.G., Silva S.L. & Jorge R.L.N. 2006. Proteino-grama e teores séricos de cálcio, fósforo, magnésio e ferro de bezerros recém-nascidos que mamaram colostro diretamente na vaca ou em ma-madeira. Ars Vet. 22:198-202.
Rosol T.J. & Capen C.C. 1997. Calcium regulating hormones and dis-eases of abnormal mineral (calcium, phosphorus, magnesium) me-tabolism, p.619-702. In: Kaneko J.J., Harvey J.W. & Bruss M.L. (Eds), Clinical Biochemistry of Domestic Animals. 5th ed. Academic Press,
San Diego.
Russel K.E. & Roussel A.J. 2007. Evaluation of the ruminant serum chemis-try proile. Vet. Clin. Food Anim.23:403-426.
Sant’Ana V.A.C. 2004. Proteinograma do leite de vacas: padrões e variabili-dade. Tese de Doutorado em Medicina Veterinária, Universidade de São Paulo, São Paulo, SP. 161p.
Zanker I.A., Hammon H.M. & Blum J.W. 2001. Activities of γ-glutamyl trans-ferase, alkaline phosphatase and aspartate-aminotransferase in colos-trum, mil k and blood plasma of calves fed irst colostrum at 0±2, 6±7, 12±13 and 24±25 h after birth. J. Vet. Med. A., Physiol. Pathol. Clin. Med. 48:179-185.
Zar J.H. 1999. Biostatistical Analysis. 4th ed. Prentice-Hall, New Jersey.
930p.
Zarcula S., Cernescu H., Mircu C., Tulcan C., Morvay A., Baul S. & Popovici D. 2010. Inluence of breed, parity and food intake on chemical composi-tion of irst colostrum in cow. Anim. Sci. Biotech. 43:154-157.