REPRODUCTION
RESEARCHMultivariate cluster analysis to study motility activation of Solea
senegalensis spermatozoa: a model for marine teleosts
Felipe Martı´nez-Pastor
1,2, Elsa Cabrita
3, Florbela Soares
3, Luis Anel
4and Maria Teresa Dinis
31Biology of Reproduction Group, National Wildlife Research Institute (IREC) (CSIC-UCLM-JCCM), 02071 Albacete, Spain,2Institute for Regional Development (IDR), UCLM, 02071 Albacete, Spain,3Center for Marine Sciences (CCMAR), University of Algarve, 8000-139 Faro, Portugal and4Animal Reproduction and Obstetrics,
University of Leo´n, 24071 Leo´n, Spain
Correspondence should be addressed to F Martı´nez-Pastor who is now at Ciencia y Tecnologı´a Agroforestal, ETSIA, University of Castilla-La Mancha, Av. Espan˜a s/n, 02071 Albacete, Spain; Email: [email protected]
Abstract
Computer-assisted sperm analysis (CASA) and clustering analysis have enabled to study sperm subpopulations in mammals, but their use in fish sperm has been limited. We have used spermatozoa from Senegalese sole (Solea senegalensis) as a model for subpopulation analysis in teleostei using two different activating solutions. Semen from six males was activated using 1100 mOsm/kg solutions: artificial seawater (ASW) or sucrose solution (SUC). Motility was acquired at 15, 30, 45, and 60 s post-activation. CASA parameters were combined into two principal components, which were used in a non-hierarchical clustering analysis, obtaining four subpopulations (CL): CL1 (slow/non-linear), CL2 (slow/linear), CL3 (fast/non-linear), and CL4 (fast/linear). We detected spermatozoa lysis, especially in ASW. Sperm motility was higher for SUC and decreased with time. The subpopulation proportions varied with time and activating treatment, showing both an increase in CL1 and CL2 and a decrease in CL3 and CL4 with time. Both CL3 and CL4 were higher in samples activated with SUC, at least in early post-activation. Proportions of CL3 and CL4 at 15 s were associated with higher quality at 60 s and with lower lysis. A second clustering analysis was conducted, classifying the males accordingly to their motility subpopulations. This analysis showed a high heterogeneity between samples. Subpopulation analysis of CASA data can be applied to Solea spermatozoa, allowing identification of potentially interesting sperm subpopulations. Future studies might benefit from these techniques to establish the relationship of these subpopulations with fish sperm quality and fertility, helping to characterize males according to their reproductive potential.
Reproduction (2008) 135 449–459
Introduction
The analysis of sperm motility has enhanced our knowl-edge of both sperm biology and the assessment of semen quality. The development of computer-assisted sperm analysis (CASA) has improved the utility of such studies, allowing tracking individual spermatozoa and obtaining objective and repeatable data. However, only recently have multivariate statistical analyses been used, taking advantage of the large quantity of data generated by CASA. These analyses allow classifying heterogeneous semen samples into homogeneous subpopulations, grouping spermatozoa with similar motility patterns. Once characterized, subpopulations can be related to treatments, male differences, sperm physiology, and, most importantly, sperm fertility (Davis et al. 1995,Abaigar et al. 1999, Quintero-Moreno et al. 2003, Martı´nez-Pastor et al. 2005a, 2005b, 2006). To date, not much research has been done on the origin and biological significance of sperm subpopulations. Thus, their mechanism of formation and physiological role are not clear yet
(Bedford 1983,Thurston et al. 1999). Nevertheless, several studies on mammals have suggested that these subpopulations can be related to fertility or the cryosurvi-val ability of sperm samples (Quintero-Moreno et al. 2003,
Martı´nez-Pastor et al. 2005b). The study of such subpopulations and their formation and evolution will probably enhance the knowledge of sperm physiology.
In fish, CASA has been successfully used after some modifications from mammal applications (Kime et al. 2001,Rurangwa et al. 2004). The study of sperm motility is especially appealing because of the need of activation to initiate it. Fish spermatozoa are immotile in the testicle, but become motile upon contact with external media. In freshwater fish, the motility activation is triggered by hypoosmolality and ionic changes (especially, KC
dilution in salmonids), whereas in marine fish it is mainly due to a hyperosmotic shock, although it can also depend on the presence of some cations or factors from the egg (Cosson 2004, Alavi & Cosson 2006). These mechanisms ensure that motility will occur only when sperm is ejaculated, preventing energy
waste and the formation of undesirable metabolical by-products. Moreover, sperm from aquatic organisms (sea urchin and several seawater and fresh water fish species) have been used extensively for the study of the basic physiology of spermatozoa, including sperm motility. An advantage of using these spermatozoa as model is that the sperm can be maintained immotile for long periods and then easily triggered to start motility.
Unfortunately, the existence of motility subpopulations in fish semen has been largely ignored, although membrane resistance studies in salmonids have indicated that several spermatozoa subpopulations indeed coexist within the semen samples (Cabrita et al. 1999, 2001). Nevertheless, some studies have considered the presence of several motility patterns within the sperm samples.
Lahnsteiner et al. (1995), working with perch semen, analyzed motility by CASA, classifying each spermato-zoon as immotile, locally motile, and motile (further divided among linear, non-linear, and circular). This methodology has been followed in other studies regard-ing different aspects of fish sperm biology and manipu-lation in many marine and freshwater species (Lahnsteiner & Patzner 1998, Lahnsteiner et al. 1998,
1999,2005,2006,Mansour et al. 2002). However, these studies rely on the classification of spermatozoa accor-ding to one or two motility parameters or on subjective measures, such as trajectory shape. This approach, although effective, does not render as much information as the use of multiparametric statistical techniques on large databases produced by CASA (where individual spermatozoa can be described as a function of many motility parameters). Recently, Le Comber et al. (2004)
applied a pattern analysis on three-spined stickleback (Gasterosteus aculeatus) semen. These researchers obtained four clusters, defined by velocity and linearity. They observed that a linear and very fast subpopulation reappeared after motility loss, when reactivating with saline solution.
The study of sperm subpopulations defined by motility has many implications in fish, not only regarding sperm quality assessment but also for the study of sperm and fish physiology (sperm activation in species living at varying salinities), behavior (competition), and genetics (reflected in different subpopulation patterns). In the present work, we present a study on Senegalese sole (Solea senegalensis), a marine flatfish, aimed at two major objectives. The first one was to characterize sperm subpopulations (clusters) in fish semen, using CASA and multivariate data analysis. This was an attempt aimed at testing a method similar to that proposed byMartı´nez-Pastor et al. (2005b)for finding and characterizing sperm subpopulations in red deer semen, using principal components analysis and data clustering methods. Our second objective was to use these subpopulations to interpret spermatozoa motility and between-male variation. Previous studies on flatfish (Chauvaud et al. 1995) and our own preliminary observations indicated that sperm motility in marine fish
could be activated by hyperosmotic solutions, not only based on saline but also on sugars. However, it is not clear how different solutions affect motility after activation. Thus, we tested the hypothesis that motility was affected by the activation solution (hyperosmotic sucrose solution (SUC) and artificial sea water (ASW)), using the subpopulation patterns to study these differences.
The reason for choosing S. senegalensis as model is that the spermatozoa of this species swim only for a very short time after activation, generally not lasting far beyond one minute. Thus, we could study the motility patterns in very different situations regarding motility vigor. Moreover, other marine teleostei have similar motility activation and short duration of the movement (sea bass, gilthead sea bream), and this kind of study may be applicable to these species. Next, although sole fish has a great economical importance and is attracting interest in the aquaculture industry in Europe, several reproductive problems related to sperm quality have been detected in males kept in captivity (Cabrita et al. 2006; T Dinis, personal communication). The identifi-cation of sperm subpopulations after activation could help to improve the knowledge of sperm physiology in these species and might be used in other kinds of study (breeding, toxicology, cryopreservation, etc).
Results
General results
Six samples (fluent males and urine free) were obtained during the course of the experiment (named 1–6). The median number of spermatozoa analyzed in each microscopic assessment (male!treatment!time) was 212 (e.g. for male 1 and SUC activation, we analyzed 201 tracks at 15 s, 180 tracks at 30 s, 145 tracks at 45 s, and 88 tracks at 60 s). The CASA rendered a database with 14 018 observations (8110 motile spermatozoa). As expected, spermatozoa were not motile when diluted in the non-activating dilution, and only a small percentage (below 1%) showed a very faint tail beating, with little or no movement. After diluting the samples with the activating solution, we observed an immediate and vigorous activation of motility. The motility remained vigorous for about 30 s, decreasing quickly afterwards, not only in percentage of motile spermatozoa but also regarding vigor. Spermatozoa lysis was frequent, some-times affecting more than 50% of the spermatozoa. When present, it occurred in the first seconds after dilution, generally increasing very little afterwards (effect of time on percentage of lysed cells: PZ0.581). Lysis was strongly influenced by male (P!0.001). Moreover, we found it to be much more important in the samples activated with artificial sea water (P!0.001). The median percentages of lysed spermatozoa for each sample in ASW versus SUC were: (1) 50 vs 60%; (2) 70 vs 50%; (3) 70 vs 0%; (4) 60 vs 20%; (5) 40 vs 0%; and (6) 60 vs 25%.
Total and progressive motility showed differences between sampling times (15, 30, 45, and 60 s) and between the two activating treatments (ASW and SUC;
Fig. 1). Both parameters decreased over time (P!0.001 for total and PZ0.006 for progressive). The SUC values were higher in both cases (P!0.001), although pro-gressive motility of SUC-activated samples nearly converged with ASW at 60 s (PZ0.117 for pairwise comparison at that time). Figure 1 shows a great variability between males, especially regarding total motility. However, the slope of decreasing motility was similar between males.
Principal component analysis (PCA) and clustering of motility data
The PCA rendered two principal components (PCs), which contained about 80% of the variability from the eight initial parameters (Table 1). These two PCs (PC1 and PC2) were used to characterize each spermatozoon and classify them in the subsequent cluster analysis. PC1 was positively related to the velocity parameters and, to a lesser degree, to
the linearity (LIN) parameters; therefore, it was termed ‘Speed’. PC2 was negatively related to the LIN parameters and positively to amplitude of the lateral displacement of the sperm head (ALH) and curvilinear velocity (VCL); therefore, it was termed ‘Erratic’ (low LIN and high ALH characterize spermatozoa with erratic trajectories). The cluster analysis yielded four clusters (sperm sub-populations). The clusters were examined in each sampling (treatment and time) using Chernoff faces (an example can be seen inFig. 2), finding that the patterns were very similar in all cases. Thus, we considered that clusters in different samplings could be treated as homologous.
Each cluster was characterized according to the value of the eight original motility descriptors (Tables 2 and 3). CL1 contained mostly slow and non-linear spermatozoa, with low beating; CL2, slow and linear spermatozoa; CL3, fast and non-linear spermatozoa, with high ALH; and CL4, fast and linear spermatozoa, showing vigorous beating. The analysis by linear mixed effect models showed that both treatment and time exerted a complex effect on motility parameters in each subpopulation, although the main characteristics of each cluster remained the same, as previously showed by the analysis by Chernoff faces. Considering the effect of post-activation time on motility parameters within each cluster, velocity decreased in CL3 and CL4 (PZ0.002 and P!0.001), LIN decreased in CL1 (PZ0.004), ALH decreased in CL2 and CL4 (PZ0.025 and PZ0.004), and BCF increased in CL4 (P!0.001). The effect of the activation treatment was also significant in many cases. Thus, SUC rendered higher results than ASW regarding CL3 and CL4 velocities (PZ0.021 and PZ0.011), CL4 LIN (PZ0.005), and CL4 ALH (PZ0.002;Fig. 1).
The proportion of spermatozoa included in each cluster varied greatly depending on post-activation time and activation treatment (Fig. 3). Considering only the relative proportions between clusters, not taking into account the proportion of immotile spermatozoa (Fig. 3,
Figure 1 Total and progressive motility after activation with ASW and SUC. The plots show individual observations (ASW, solid bullets; SUC, hollow bullets) and medians (ASW, solid lines; SUC, dotted lines). Total and progressive motility decreased with time (P!0.001 and PZ0.006), and SUC rendered significantly higher values (P!0.001).
Table 1 Summary results of the two principal component (PC) analyses conducted in this study. PC1 and PC2 are the first two PCs extracted from each analysis. For each PC, the table shows the loadings for each starting variable, their eigenvalues, the variance proportion explained by the PC, and its cumulative proportion. The eigenvalue of PC3 was below 1 in both cases; therefore, PCs 3–8 were discarded.
Motility analysis Male analysis
PC1 PC2 PC1 PC2 VCL 0.400 0.369 CL1 K0.171 0.674 VSL 0.445 0.019 CL2 K0.328 0.578 VAP 0.425 0.276 CL3 K0.467 K0.346 LIN 0.367 K0.431 CL4 K0.505 K0.303 STR 0.265 K0.498 CL5 0.625 K0.015 WOB 0.375 K0.150 ALH 0.174 0.569 BCF 0.294 K0.089 Eigenvalue 4.421 1.978 Eigenvalue 2.554 1.693
Proportion of variance 0.553 0.247 Proportion of variance 0.511 0.338
Cumulative proportion 0.553 0.800 Cumulative proportion 0.511 0.849
VCL, curvilinear velocity; VSL, straight-line velocity; VAP, averaged-path velocity; LIN, linearity; STR, straightness; WOB, wobble; ALH, amplitude of the lateral movement of the head; BCF, beat-cross frequency. CL1–CL4, percentage of each cluster as defined by the cluster analysis of motility data; CL5, cluster representing the percentage of immotile spermatozoa.
row A), CL1 increased considerably after activation (P!0.001), being higher for ASW than for SUC at all sampling times (PZ0.011). CL2 only increased when activating with SUC (PZ0.002). The percentage of CL2 for SUC activation was lower than ASW activation (P!0.001), but finally both treatments converged. CL3 and CL4 decreased with time (PZ0.012 and P!0.001), and in both cases the proportion of these clusters was higher after activating with SUC (P!0.001 and PZ0.021), although again the two curves converged in the last times (in the case of CL3, the decrease was significantly faster for SUC, P!0.001, as showed in the corresponding plot). These dynamics were different when taking into account the effect of the increasing proportion of immotile spermatozoa (Fig. 3, row B). The proportion of CL1 and CL2 did not vary with time or treatment, although SUC underwent a slight increase (PZ0.036 and PZ0.008) and the proportion of CL3 and CL4 was higher for SUC (P!0.001). CL4 decreased with time in both treatments (PZ0.025), faster for SUC (PZ0.043), but CL3 only decreased significantly in SUC (P!0.001). Summarizing, CL1 and CL2 increased with time respect to CL3 and CL4 that decreased; the general motility decrease dampened the changes in CL1
and CL2, except for SUC-activated samples, which rendered a higher proportion of CL3 and CL4 too.
We tested the association of the proportion of each cluster at 15 s post-activation with motility charac-teristics at 60 s (both cluster proportions and the medians of motility parameters). Table 4 shows that the initial cluster proportions influenced later motility. If taking the relative proportions of the clusters independently of immotile sperm, the analysis showed that a higher %CL1 at 15 s was positively associated with %CL1 at 60 s, and negatively with %CL2. It was also negatively associated with total motility, VCL, LIN and BCF at 60 s. %CL4 at 15 s resulted in the opposite, plus being positively associated with %CL4 at 60 s. Moreover, %CL2 at 15 s was negatively associated with motility at 60 s. We considered these associations as weak, since they were significant at the level of PO0.05 and with r values mostly between 0.5 and 0.7. Nevertheless, %CL3 at 15 s was strongly and positively associated with the sperm motility (rZ0.73, P!0.01). When taking into account the percentage of immotile spermatozoa, it resulted in %CL3 and %CL4 at 15 s being strongly and positively associated with total motility (rZ0.92, P!0.001, and rZ0.84, P!0.01 respectively). Moreover, %CL3 at 15 s
Figure 2 Example of the use of Chernoff faces for identifying patterns in the cluster composition of the samples. Each face represents a cluster and each facial feature depends on one of the motility variables defining the cluster. The eight motility parameters of each cluster were processed by an algorithm that displayed each one as a facial feature (for instance, hair and face size are related to velocity; compare withTables 2 and 3). The figure shows that the pattern was almost identical between ASW and SUC treatments after 15 s post-activation. This method to represent multiparametric data allows to finding changes and similarities easily, helping to the interpretation of complex arrays of data. The Chernoff faces of the rest of the treatments also showed a similar pattern (not displayed).
Table 2 Subpopulations after activating with artificial seawater (ASW). Median and interquartile range of each cluster obtained from the motility data (the proportion of each cluster is showed in Fig. 3).
Seconds post-activation Cluster VCL (mm/s) LIN (%) ALH (mm) BCF (Hz)
15 s CL1 22.7 (14.9–32.8) 24.2 (16.5–31.6) 1.4 (1.1–1.9) 3 (1.2–4.5) CL2 33.9 (21.3–52.7) 63.1 (53–77.4) 1.5 (1.2–2) 5 (3–7) CL3 159.5 (118.8–180.1) 30.6 (20.8–43.6) 4.3 (3.6–5.1) 4.8 (3–6.1) CL4 161.2 (135.8–183.1) 86.7 (72.5–94.3) 2.4 (1.8–3.2) 7 (5.9–9) 30 s CL1 20.2 (14.1–29.5) 20.7 (15.2–31.1) 1.3 (1–1.7) 2.3 (1–4) CL2 25.9 (17.1–41.4) 64.1 (53.8–76.3) 1.3 (1.1–1.8) 4 (2–6) CL3 130.7 (104.1–153.7) 31.8 (20.2–43) 3.5 (2.8–4) 4 (2–5) CL4 149.7 (128.9–173.4) 92.3 (82.7–97.6) 1.7 (1.3–2.3) 7 (5–9) 45 s CL1 20.4 (14–27.2) 19.7 (14.1–29.8) 1.3 (1–1.6) 2 (1–3.4) CL2 27.1 (17.4–41.3) 65.8 (53.4–80) 1.3 (1–1.6) 4 (2–7) CL3 131.9 (117.8–150) 51 (23.4–54.2) 3 (2.4–3.4) 3.5 (2.2–4.9) CL4 124.5 (101.9–147.1) 94.9 (90.3–97.7) 1.5 (1.3–2) 8 (7–10) 60 s CL1 20.5 (14.3–27.9) 19.5 (13.8–29) 1.3 (1–1.7) 2 (1–4) CL2 29.5 (18.2–47.2) 67.2 (51.3–80.9) 1.3 (1.1–1.6) 5 (3–7.4) CL3 101 (86–111.8) 20.5 (15.3–25.3) 3.9 (3–6.4) 5.7 (4.3–7.3) CL4 110.4 (83.2–127.8) 94.4 (89.2–97.1) 1.6 (1.3–1.8) 10.2 (8–11.2) VCL, curvilinear velocity; LIN, linearity; ALH, amplitude of the lateral movement of the head; BCF, beat-cross frequency.
was positively associated with %CL1 (strongly) and %CL2, while %CL4 at 15 s was positively associated with %CL2 (strongly) and %CL4 at 60 s. Interestingly, the proportion of lysed spermatozoa were negatively associated with the proportion of CL3 (rZK0.74, PZ0.006) and CL4 (rZK0.81, PZ0.001) at 15 s. Male variability
We found a great variability between samples, which is reflected in the cluster structure. Figure 4 displays the distribution of the VCL and PC1 variables for each male in ASW/15 s, ASW/60 s, SUC/15 s, and SUC/60 s, showing not only that samples from different males presented a particular distribution, but also that the response to different activating media and the changes through time were different. We attempted to describe this variability by classifying the males according to the previously defined cluster distribution, treating the percentage of immotile
sperm as a fifth cluster (CL5). Figure 5 shows the distribution of the males in the multidimensional space defined by the two PCs obtained in this analysis. These two PCs explained almost 85% of the variance (Table 1). The first one (PC1) was strongly and positively related to the proportion of immotile spermatozoa (CL5), and negatively to the proportion of CL3 and CL4. The second one (PC2) was positively related to the proportion of CL1 and CL2 and, less strongly and negatively, to CL3 and CL4. The biplot shows the variability between males regarding each activating treatment and time (15 and 60 s). For instance, at 15 s, males 5 and 6 showed a different cluster structure if activating with ASW (prevalence of CL1 and CL2) or SUC (prevalence of CL3 and CL4); at 60 s, the locations of both males had traversed the plot towards the origin, parallel to the corresponding eigenvectors, thus showing a decrease in the predominant clusters while increasing CL5 (immo-tile spermatozoa), and without much variation in the other two clusters. Samples from other males, such as 3 and 4,
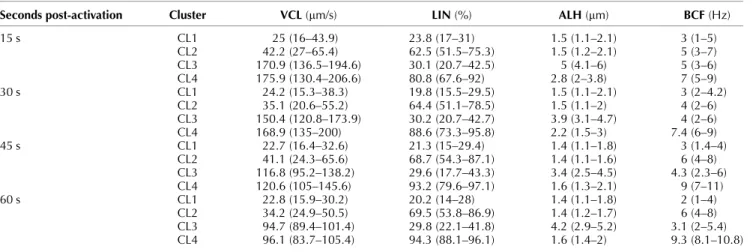
Table 3 Subpopulations after activating with SUC. Median and interquartile range of each cluster obtained from the motility data (the proportion of each cluster is showed in Fig. 1).
Seconds post-activation Cluster VCL (mm/s) LIN (%) ALH (mm) BCF (Hz)
15 s CL1 25 (16–43.9) 23.8 (17–31) 1.5 (1.1–2.1) 3 (1–5) CL2 42.2 (27–65.4) 62.5 (51.5–75.3) 1.5 (1.2–2.1) 5 (3–7) CL3 170.9 (136.5–194.6) 30.1 (20.7–42.5) 5 (4.1–6) 5 (3–6) CL4 175.9 (130.4–206.6) 80.8 (67.6–92) 2.8 (2–3.8) 7 (5–9) 30 s CL1 24.2 (15.3–38.3) 19.8 (15.5–29.5) 1.5 (1.1–2.1) 3 (2–4.2) CL2 35.1 (20.6–55.2) 64.4 (51.1–78.5) 1.5 (1.1–2) 4 (2–6) CL3 150.4 (120.8–173.9) 30.2 (20.7–42.7) 3.9 (3.1–4.7) 4 (2–6) CL4 168.9 (135–200) 88.6 (73.3–95.8) 2.2 (1.5–3) 7.4 (6–9) 45 s CL1 22.7 (16.4–32.6) 21.3 (15–29.4) 1.4 (1.1–1.8) 3 (1.4–4) CL2 41.1 (24.3–65.6) 68.7 (54.3–87.1) 1.4 (1.1–1.6) 6 (4–8) CL3 116.8 (95.2–138.2) 29.6 (17.7–43.3) 3.4 (2.5–4.5) 4.3 (2.3–6) CL4 120.6 (105–145.6) 93.2 (79.6–97.1) 1.6 (1.3–2.1) 9 (7–11) 60 s CL1 22.8 (15.9–30.2) 20.2 (14–28) 1.4 (1.1–1.8) 2 (1–4) CL2 34.2 (24.9–50.5) 69.5 (53.8–86.9) 1.4 (1.2–1.7) 6 (4–8) CL3 94.7 (89.4–101.4) 29.8 (22.1–41.8) 4.2 (2.9–5.2) 3.1 (2–5.4) CL4 96.1 (83.7–105.4) 94.3 (88.1–96.1) 1.6 (1.4–2) 9.3 (8.1–10.8) VCL, curvilinear velocity; LIN, linearity; ALH, amplitude of the lateral movement of the head; BCF, beat-cross frequency.
Figure 3 Proportion of each cluster (sub-population) obtained from the analysis of moti-lity data. The plots show individual observations (ASW, solid bullets; SUC, hollow bullets) and medians (ASW, solid lines; SUC, dotted lines). In the (A) row, the proportion of each cluster is relative to the total number of motile spermato-zoa, and in the (B) row, the proportion of each cluster is relative to the total number of spermatozoa (including immotile spermatozoa). The proportion of immotile spermatozoa increased post-activation, thus the differences between (A) and (B).
underwent a decrease in the proportion of all clusters while increasing CL5; other different pattern was showed by the samples from male 1 and 2, which, upon activation with SUC, underwent an increase in the proportion of CL1 and CL2, while decreasing CL3 and CL4 and increasing little CL5. The hierarchical clustering of the males helped to interpret the variability found. We found a very different clustering structure at 15 and 60 s when activating with ASW, whereas it varied little when activating with SUC. Thus, at 15 s after activating with ASW, males 1, 6, and 2 formed a cluster (prevalence of CL1 and CL2), 3 and 4 another one (low CL1 and CL2), and 5 was a cluster on its own (higher proportion of motile spermatozoa and prevalence of CL4); at 60 s, males 1, 2, 3, and 4 formed a cluster due to its low motility (high CL5), and male 5 and 6 formed other two clusters, characterized by higher motility (with prevalence of CL1 and CL2, 5 had higher motility than 6). When activating with SUC at 15 s, males 1, 2, and 4 formed a cluster (high CL5), 5 and 6 formed another one (low CL1, CL2 and CL5), leaving 3 in another cluster (low CL5); at 60 s, that structure remained almost the same, only leaving 5 in its own cluster due to its lower CL5.
Discussion
Our study suggests that sperm subpopulations with distinct characteristics exist in S. senegalensis sperm and that they can be successfully identified by using a multivariate clustering analysis. We support the idea that sperm subpopulations are primarily defined by male genetics, originating during spermatogenesis. Nevertheless, these subpopulations may be modified by other events such as sperm maturation or even sperm storage in the testes. Sample differences were evident throughout the experi-ment, although all males were exposed to the same conditions several months before the experiments started. Sperm aging, one of the possible causes of variability between analyzed samples, has been reported in turbot and sea bass (Suquet et al. 1998,Dreanno et al. 1999c), being associated with a decline in the percentage of motile cells and the appearance of several morphological changes in the sperm head, usually associated with changes in chromatin condensation (Suquet et al. 1998). Plasma membranes are also affected, which could reflect the high sensitivity of cells to environmental changes. Those environmental changes may cause alterations in the
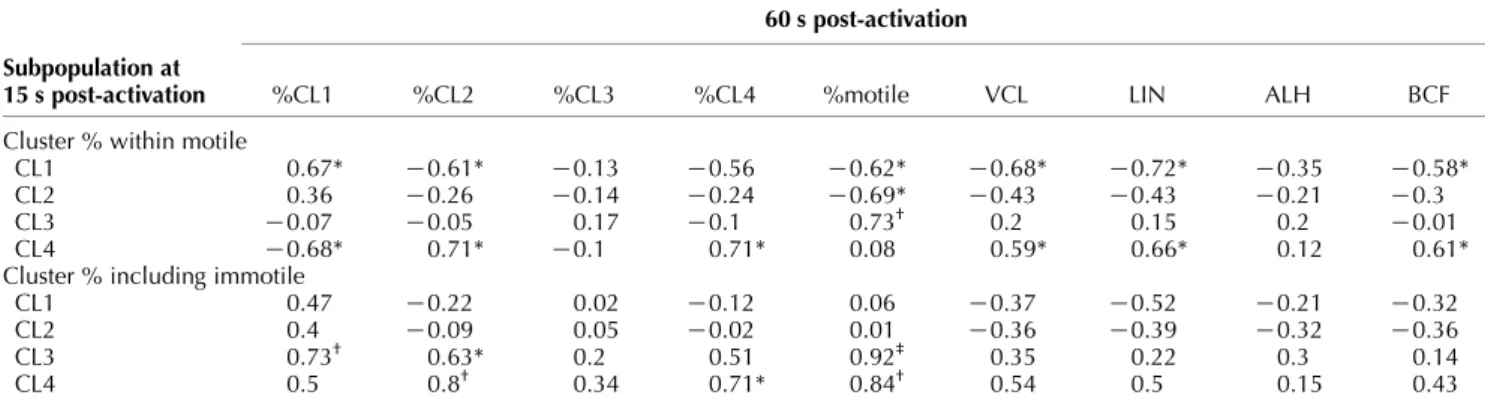
Table 4 Association of the proportion of each cluster at 15 s with the proportion of each cluster and motility parameters at 60 s. The analysis was carried out using the proportion of each cluster within motile spermatozoa, and the proportion of each cluster considering immotile spermatozoa as a fifth cluster.
60 s post-activation Subpopulation at
15 s post-activation %CL1 %CL2 %CL3 %CL4 %motile VCL LIN ALH BCF
Cluster % within motile
CL1 0.67* K0.61* K0.13 K0.56 K0.62* K0.68* K0.72* K0.35 K0.58*
CL2 0.36 K0.26 K0.14 K0.24 K0.69* K0.43 K0.43 K0.21 K0.3
CL3 K0.07 K0.05 0.17 K0.1 0.73† 0.2 0.15 0.2 K0.01
CL4 K0.68* 0.71* K0.1 0.71* 0.08 0.59* 0.66* 0.12 0.61*
Cluster % including immotile
CL1 0.47 K0.22 0.02 K0.12 0.06 K0.37 K0.52 K0.21 K0.32
CL2 0.4 K0.09 0.05 K0.02 0.01 K0.36 K0.39 K0.32 K0.36
CL3 0.73† 0.63* 0.2 0.51 0.92‡ 0.35 0.22 0.3 0.14
CL4 0.5 0.8† 0.34 0.71* 0.84† 0.54 0.5 0.15 0.43
VCL, curvilinear velocity; LIN, linearity; ALH, amplitude of the lateral movement of the head; BCF, beat-cross frequency. Numbers show Spearman’s rand significance level (*P!0.05,†P!0.01,‡P!0.001).
Figure 4 Violin plots showing between-male variability. The plots display the distribution of the data combining box-plots with kernel density plots (outer shapes). The box plots show the interquartile range (IQR; thick line), the median (white dot within IQR), and the extreme values within the range 1.5!IQR from the first and third quartiles (thin lines). Kernel density plots show the actual distribution of the data, highlighting its multimodality. The plots evidence the different distributions from activating with different solutions (ASW versus SUC), sampling times (15 s versus 60 s), and males (1–6). Just after activation (15 s), each male showed an individualized distribution, although at 60 s differences were less evident.
proportion and characteristics of sperm motility-defined subpopulations, revealing the status and quality of spermatozoa. In fact, the differences in the distribution of subpopulations (sperm clusters) between ASW and SUC treatments could be due to these membrane differences.
Many studies have been carried out on the basis that fish spermatozoa form an homogeneous population within a sample. Therefore, all spermatozoa would
show very similar characteristics at a defined time after activation (Cosson et al. 1999). The reason for the prevalence of this idea may be that many motility studies have relied on subjective motility assessment or have concentrated on flagellar beating analysis, assuming that the beating was uniform among all of the population. Furthermore, CASA has been frequently used only to obtain mean values for each parameter, ignoring the variability and multimodality of semen samples. None-theless, the results of studies in which the spermatozoa were considered individually indicate that there is an inherent within-sample variability (Toth et al. 1997,
Cosson et al. 2000, Casselman & Montgomerie 2004,
Holt & Van Look 2004). Our study seems to confirm that within-sample variability, one of our starting hypotheses, exists in S. senegalensis semen. Indeed, we avoided using means and standard deviations for describing our results, but instead we used median-based statistics and tech-niques that disclose multimodality. Previous studies have considered the existence of within-sample variability associated with motility characteristics (Lahnsteiner & Patzner 1998, Lahnsteiner et al. 1998, 2005, 2006, Le Comber et al. 2004), but they did not aim to develop specific approaches to describe this variability.
In our study, we obtained four clusters, potentially representing distinct sperm subpopulations. The subpopulation -pattern was strongly preserved, even though there were noticeable changes between the two activating treatments and sampling times. According to the subpopulation dynamics, our hypothesis is that a highly motile sperma-tozoon would not lose its motility suddenly (unless undergoing extensive damage due to osmotic shock), but rather it would be a progressive process. In other words, spermatozoa classified as CL3 and CL4, highly motile, would lose its motility more or less quickly, but gradually, and eventually they would be rather classified as CL1 or CL2 spermatozoa; afterwards, they would become slow enough to be considered immotile. These two facts, the decrease in the median velocity values of the fast subpopulations and the increase in the relative proportions of CL1 and CL2 with post-activation time, have been confirmed by our results. The different dynamics of CL1 and CL2 depending on whether or not the proportions of immotile spermatozoa were considered (see Fig. 3) may appear surprising, but it makes sense assuming that both subpopulations are simultaneously gaining events from CL3 and CL4 and losing them to CL5 (immotile spermatozoa).
Spermatozoa in CL1 and CL2 may have exhausted their ATP reserves, a likely cause of the short sperm motility in some fish species (Perchec et al. 1995, Dreanno et al. 1999a, Le Comber et al. 2004). Moreover, it has been proposed that marine fish spermatozoa could experience some kind of motility inhibition due to increasing internal osmolality after dilution in the hyperosmotic external environment (Cosson 2004, Alavi & Cosson 2006). It is possible that reactivation of motility would be possible
Figure 5 Clustering of the males according to the proportions of the motility subpopulations (CL5 is the percentage of immotile spermato-zoa). (A) The distribution of data points for the two first principal components extracted from the analysis (the eigenvectors for each cluster are overplotted), for ASW/15 s (hollow circles), ASW/60 s (solid circles), SUC/15 s (hollow squares), and ASW/60 s (solid squares); numbers represent males. (B) The hierarchical clustering of the males for each sampling. Note how the multidimensional positioning of each male in (A) relates to the clustering in (B).
after reversion to isoosmotic conditions, as demonstrated in turbot (Dreanno et al. 1999b), and it would be interesting to study the variations in the relative proportions of the subpopulations after this reactivation. Le Comber et al. (2004), working with G. aculeatus semen, found that, after activation, a slow/non-linear subpopulation increased its relative proportion with time, whereas other two ‘fast’ subpopulations decreased. When motility was reactivated, the proportion of the slow subpopulation decreased while the fastest subpopulation increased.
Whereas CL4 seemed to be the ‘ideal’ subpopulation (in fact, its prevalence at 15 s post-activation was associated with better motility characteristics at 60 s), CL3 represents an interesting case. Although fast, CL3 spermatozoa were characterized by their erratic trajectories, expressed in the low LIN and high ALH. Moreover, its proportion plummeted along post-activation time, contrarily to CL4, which showed a slow decrease. It is possible that CL3 spermatozoa are the product of defective spermatogenesis, resulting in mem-brane weakness, defective memmem-brane-associated enzy-matic activity, low glycolytic activity or low mitochondrial respiration. Another hypothesis is that the presence of CL3 spermatozoa at 15 s could be a consequence of the stripping method, which could induce the release of incompletely matured spermatozoa, which would not be released by males under physiological circumstances (natural fertilization). However, in turbot, another flatfish species, sperm is always collected using stripping, and this phenomenon (immature spermatozoa in semen) has never been reported during the peak of spawning season.
The interpretation of CL3 as being composed by defective or immature spermatozoa apparently contradicts the positive association found between the percentage of this subpopulation at 15 s and the total motility at 60 s. Our explanation is that, in samples of low general quality, CL3 spermatozoa would undergo lysis or lose velocity quickly, thus not being recognized as such at 15 s. Contrarily, in good quality samples, the general better condition of the spermatozoa (improved spermatogenesis, maturation, or low aging) would reflect in higher resistance of CL3 spermatozoa, and therefore a higher proportion of this subpopulation would be reported at 15 s. Thus, the presence of CL3 spermatozoa shortly after activation would indirectly indicate good condition of the sample, even though these spermatozoa would disappear quickly. The strong association between the proportion of CL3 and CL4 at 15 s with a lower proportion of lysed spermatozoa supports the endorsement of these subpopulations as markers of the general status of the sample. In fact, the proportion of CL3 in ASW, which induced a higher degree of lysis, was much lower at 15 s than that in the samples activated with SUC. This finding suggests that, indeed, one of the reasons for the low presence of CL3 spermatozoa in some samples was quick sperm lysis due to osmotic shock. Spermatozoa lysis has not been previously studied in fish spermatozoa, possibly because of the absence (differences between species or activation treatments)
of different techniques (lysed spermatozoa not visible), or simply because its presence was not reported.Dreanno et al. (1999a) proposed that, after activating sea bass spermatozoa, osmotic stress caused morphological changes affecting chromatin, mitochondria, and midpiece, thus limiting motility. However, these authors did not report whether spermatozoa lysis occurred in their experiments. Nevertheless, lysis may occur after acti-vation, at least in Solea (present study) and gilthead seabream (E Cabrita, personal communication). The most probable cause of spermatozoa lysis is the hyperosmotic shock caused by the activation medium, either because of the lack of resilience of the plasmalemma or of the failure of the osmotic regulatory systems of the cell. The regulation of cell volume and its response to osmotic changes depends on many factors, including ATP availability (Lang et al. 1998). This would be compatible with the idea of CL3 spermatozoa as cells with deficient ATP-restoring pathways. The lower degree of spermatozoa lysis in SUC could be due to the absence of external ions that might facilitate the equilibration with the environment through gradient-facilitated loss of ions. Moreover, the enhanced motility after activating with SUC could be due not only to a lesser degree of damage because of osmotic shock, but also because the loss of ions would slow or prevent the rise of internal ionic concentration, which has been proposed as a major inhibitor of the motility in marine fish (Cosson 2004). In fact, other studies have showed that diluted seawater supported motility longer than whole sea water (Billard 1978,Lahnsteiner & Patzner 1998).
The classification of the males according to the sperm subpopulations showed a great heterogeneity between samples. Males were different both within and between activating treatments. This suggests that, despite the homogeneity of the breeding conditions, many factors affected sperm quality (stripping procedure, different responses to stress, and sperm aging in the testicle). Moreover, the genetic information of each male may have an impact in the sperm quality through spermatogenesis and maturation. Considering the problems encountered in fertilization in this species (Cabrita et al. 2006), the influence of male genetics on sperm quality should be addressed as an important question and as an opportunity to exploit the individual variation in order to improve the breeding of this species. Studies in species with high sperm competition have showed that sperm quality varies between males, depending on the individual genetics (Fitzpatrick et al. 2007). Although this is not the case here, it shows how strongly sperm quality can be genetically affected. Other studies have showed the connection between individual variability, sperm traits (for instance, velocity), and fertility (Casselman et al. 2006).
In this study, we have showed that different sperm subpopulations could be identified in Solea semen and that their proportions varied with time post-activation and activating treatment. The statistical analysis was carried out using an open source and free statistical environment
that might aid on the reproducibility of the methods and the examination of the algorithms used here. The CASA systems have contributed considerably to the knowledge on sperm biology (Amann & Katz 2004,Rurangwa et al. 2004), and the study of sperm subpopulations defined by motility seems promising. Although commercial CASA systems are expensive, open source CASA software is starting to be developed (Wilson-Leedy & Ingermann 2007). These software solutions may allow the per-formance of CASA analysis in laboratories that cannot afford commercial options. We have to accept a limitation of conventional CASA systems, regarding their inability to follow the trajectory of individual spermatozoa for a long time. In this study, our results seem to suggest that Solea spermatozoa form sub-populations, and that spermatozoa might change their motility traits with time, thus reflecting in subpopulation sizes. However, these results must be confirmed by using tracking devices that are capable of following an individual spermatozoon for several minutes, registering its exact trajectory and motility variables over time.
The utility and biological significance of the sub-populations identified by us must be confirmed by further experimentation. We have proposed that some of the subpopulations (CL3 and CL4) may be important in being associated with good quality samples. Indeed, (Fauvel et al. 1999) obtained higher fertility when fertilizing sea bass eggs with semen with increasing BCF (one of the defining characteristics of CL4), and other studies have shown the relationship of sperm motility with fertility (Rurangwa et al. 2001). The association of these subpopulations with other physiological markers (sperm viability, ATP reserves, ATP restoring pathways, membrane composition, and resistance to osmotic shocks) and with controlled fertility trials must be established. Our results suggest that these subpopulations might have a biological meaning, and previous studies in mammals appear promising (Thurston et al. 2001,Quintero-Moreno et al. 2003, Martı´nez-Pastor et al. 2005b). Furthermore, the findings in this study may have an application in the field of marine fish aquaculture. The analysis of motility based on sperm subpopulations could improve the assessment of male differences, enabling the identification and selection of males producing sperm with given characteristics (for instance, more resistant to the osmotic conditions in which fertilization should occur). Nevertheless, our results must be contrasted with physiological and biochemical analysis, and with fertility trials, for establishing the usefulness of these findings.
Materials and Methods Reagents and media
All chemicals were acquired from Sigma and were of Reagent Grade or higher. The non-activating ionic solution was composed of 59.89 mmol/l NaCl, 1.48 mmol/l KCl, 12.92 mmol/l MgCl2,
3.51 mmol/l CaCl2, 20 mmol/l NaHCO3, and 10 mg/ml BSA (Fauvel et al. 1999). Osmolality was 310 mOsm/kg and the pH was 7.7. The activating solutions were artificial seawater (ASW) and sucrose medium (SUC). The composition of ASW was: 420.9 mmol/l NaCl, 9 mmol/l KCl, 9.25 mmol/l CaCl2, 25.5 mmol/l MgSO4, 22.9 mmol/l MgCl2, and 2.1 mmol/l NaHCO3(pH 8.0). The SUC was a simple sucrose dilution in distilled water (1.1 mol/l). Both media were adjusted to 1100 mOsm/kg, which is enough to totally activate sperm motility in flatfish.
Broodstock maintenance
Ten Senegalese sole males (S. senegalensis) captured from the wild (mean body weight 1190 g,S.D. 300) and were stocked in our facilities at the Ramalhete station (CCMAR, Faro, Portugal). Fish were kept in a 3000-l fiberglass tank with sand substrate and aeration. Water exchange was kept at 500 l/h. Light intensity on water surface was 150 lux and the photoperiod was 12 h light:12 h darkness. Temperature and salinity were normal for the season. All individuals were tagged with chips in order to identify each specimen. The fish were fed with 3% of biomass each day consisting of polychaete (Nereis diversicolor), mussel (Mytilus edulis), and squid (Loligo vulgaris) administered on the different days of the week.
Semen collection
Semen was collected from fluent males during the spawning season in the highest spermiation period (from late March to the end of May). For sperm extraction, individuals were collected from the broodstock tank and anesthetized in a water bath with 300 mg/l phenoxyethanol for 10 min. Sperm was extracted by pressing the abdominal area to gently squeeze the testis and the sperm emerging from the urogenital pore were collected using a syringe without a needle. Before extraction, the urogenital pore was free from mucus, feces, and water. The sperm was introduced in 1.5-ml tubes and stored at 7 8C for further analysis. Contaminated samples were discarded, and a total of six samples from different males were used for the analysis. The semen samples were processed independently for each male.
Pre-dilution and activation of semen motility
In order to improve CASA analysis, we had to lower sperm concentration before acquiring motility sequences. Too many motile spermatozoa decrease the reliability of the analysis, since there are too many tracks and crosses to resolve. However, very few motile spermatozoa would hinder the later subpopulation analysis because of low sample size. Therefore, considering that sperm concentration in S. senega-lensis is generally within 0.1–2!109spermatozoa/ml, we carried out a 1/50 dilution of the sample with the non-activat-ing solution. In this first dilution, the spermatozoa were still non-motile. Immediately after the first dilution, one droplet of 1 ml was deposited on a Makler chamber (Makler, Haifa, Israel) and activated with 5 ml activating solution (ASW or SUC). The final concentration was between 30 and 10 million of spermatozoa per milliliter (assessed using the CASA software).
Motility analysis
The CASA system consisted of a triocular optical phase contrast microscope (Nikon Labophot-2; Nikon; Tokyo, Japan), with an attached Basler 312fc/c digital camera (Basler Vision Tech-nologies, Ahrensburg, Germany). The camera was connected to a computer by an IEEE 1394 interface. Images were captured and analyzed using the Integrated System for Semen Analysis (ISAS) software (Proiser; Valencia, Spain). Sampling was carried out using a !10 negative phase contrast objective (no intermediate magnification). Motility was recorded at 15, 30, 45, and 60 s after activation. These times were decided previously in order to maintain repeatability between samplings (after activating the sample, the Makler chamber must be mounted with a special cover slip and positioned under the objective, and it is generally necessary to correct focus and field location). Image sequences were saved and analyzed afterwards. Spermatozoa lysis was observed in most samples (faint and enlarged sperm heads) and its incidence was estimated from the recorded images.
For each sperm analyzed, the CASA rendered the following data: VCL (velocity according to the actual path; mm/s), curvilinear velocity (VSL according to the straight path; mm/s), VAP (velocity according to the smoothed path; mm/s), LIN (LIN, VSL/VCL!100; %), STR (straightness, VSL/VAP! 100; %), WOB (wobble, VAP/VCL!100; %), ALH (mm), and BCF (beat-cross frequency; Hz). These parameters have been defined elsewhere (Boyers et al. 1989). CASA software settings were adjusted for analyzing fish spermatozoa. The CASA settings were: 30 frames/s for acquisition, for 1 s acquisition time; VCLO10 mm/s to classify a spermatozoon as motile; 10–80 mm2for head area (this wide range was necessary for acquiring all spermatozoa, including those undergoing lysis).
Data processing and statistical analysis
Statistical analyses were carried out using the R statistical environment (R Development Core Team 2006). Raw motility data were first processed to obtain the total motility of each sample, defined as the relation between motile spermatozoa (VCLO10 mm/s) and the total number of spermatozoa !100, and the progressive motility as the relation of spermatozoa swimming in a linear fashion (VCLO50 mm/s and STRO70%) and the total number of spermatozoa !100.
The clustering process was a modification of the one proposed byMartı´nez-Pastor et al. (2005a), based on a multi-step process. Data were first processed using PCA. The eight motility parameters were linearly combined to produce eight PCs. The number of PCs was decided using the Kaiser criterion, selecting only those with an eigenvalue equal or higher than 1. The selected PCs were used to group the observations (spermatozoa), using an algorithm for clustering large appli-cations (Kaufman & Rousseeuw 1990), based on the k-means method. The number of clusters (k) was decided based on the Hubert G statistic. This statistic was calculated for each kZ(2–12), choosing a k such that the Hubert G statistic was maximized. Each cluster was defined according to its median values for each motility parameter, and its relative proportion respect to the other clusters, both taking into account and not the proportion of immotile spermatozoa.
We tested that the clustering pattern was the same for all the samples by using Chernoff faces (Fig. 2). Chernoff faces represent multivariate data by using it to draw human faces whose features vary depending on the data. It is easy for humans to ascertain features in the faces and to notice differences between different faces (different datasets). This kind of representation has been used previously (Davis & Siemers 1995) for emphasizing differences between clusters obtained from sperm motility data. In this study, we obtained a set of Chernoff faces for each sample, thus we could identify if the pattern in each sample was homologous to that found in other sample, instead of comparing the eight variables defining each cluster. It must be emphasized that comparing the numbers is misleading, since values can vary between the same clusters in different samples, leading to the wrong conclusion that clusters are different, while the pattern indeed remains.
Hypothesis testing on clustering results was conducted using linear mixed effects models, with male as a random effect; time (covariate) and activation treatment were considered as fixed effects. When carrying out pairwise comparisons, we applied orthogonal contrasts, using Holm’s correction for multiple comparisons if needed. The degree of association between cluster proportions at 15 s and motility characteristics at 60 s was assessed by calculating Spearman’s r.
A second clustering analysis was carried out to characterize and group males according to the clustering structure of their sperm samples (proportion of each of four clusters, plus the proportion of immotile spermatozoa). A PC analysis was carried out on the five variables, and the two first PCs were used for agglomerative nesting processing (Kaufman & Rousseeuw 1990), a kind of hierarchical clustering (unweighted pair-group average method, UPGMA).
Acknowledgements
The authors thank Dr Joa˜o Reis, Miguel Viegas and Helena Dama´sio for their assistance in broodstock maintenance. This work was supported by Mare-Reprosol project (SFRH/BPD/12629/2003) and an Integrated Action Spain-Portugal (HP2005-0136). Felipe Martı´nez-Pastor was supported by the Juan de la Cierva program (Spanish Ministry of Education and Science), and Elsa Cabrita was supported by post-doctoral grant (SFRH/BPD/12629/2003). The authors declare that there is no conflict of interest that would prejudice the impartiality of this scientific work.
References
Abaigar T, Holt WV, Harrison RA & del Barrio G 1999 Sperm subpopulations in boar (Sus scrofa) and gazelle (Gazella dama mhorr) semen as revealed by pattern analysis of computer-assisted motility assessments. Biology of Reproduction 60 32–41.
Alavi SMH & Cosson J 2006 Sperm motility in fishes. (II) Effects of ions and osmolality: a review. Cell Biology International 30 1–14.
Amann RP & Katz DF 2004 Reflections on casa after 25 years. Journal of Andrology 25 317–325.
Bedford JM 1983 Significance of the need for sperm capacitation before fertilization in eutherian mammals. Biology of Reproduction 28 108–120. Billard R 1978 Changes in structure and fertilizing ability of marine and freshwater fish spermatozoa diluted in media of various salinities. Aquaculture 14 187–198.
Boyers SP, Davis R & Katz D 1989 Automated semen analysis. Current Problems in Obstetrics, Gynecology and Fertility 12 172–200. Cabrita E, Alvarez R, Anel E & Herraez MP 1999 The hypoosmotic swelling
test performed with coulter counter: a method to assay functional integrity of sperm membrane in rainbow trout. Animal Reproduction Science 55 279–287.
Cabrita E, Martinez F, Alvarez M & Herraez MP 2001 The use of flow cytometry to assess membrane stability in fresh and cryopreserved trout spermatozoa. Cryo Letters 22 263–272.
Cabrita E, Soares F & Dinis MT 2006 Characterization of senegalese sole, Solea senegalensis, male broodstock in terms of sperm production and quality. Aquaculture 261 967–975.
Casselman SJ & Montgomerie R 2004 Sperm traits in relation to male quality in colonial spawning bluegill. Journal of Fish Biology 64 1700–1711. Casselman SJ, Schulte-Hostedde AI & Montgomerie R 2006 Sperm quality
influences male fertilization success in walleye (Sander vitreus). Canadian Journal of Fisheries and Aquatic Sciences 63 2119–2125. Chauvaud L, Cosson J, Suquet M & Billard R 1995 Sperm motility in turbot,
Scophthalmus maximus: initiation of movement and changes with time of swimming characteristics. Environmental Biology of Fishes 43 341–349. Le Comber S, Faulkes C, Van Look K, Holt W & Smith C 2004 Recovery of
sperm activity after osmotic shock in the three-spined stickleback: implications for pre-oviposition ejaculation. Behaviour 141 1555. Cosson J 2004 The ionic and osmotic factors controlling motility of fish
spermatozoa. Aquaculture International 12 69–85.
Cosson J, Dreanno C, Billard R, Suquet M & Cibert C 1999 Regulation of axonemal wave parameters of fish spermatozoa by ionic factors. In The Male Gamete: From Basic Knowledge To Clinical Applications, pp 161–186. Ed. C Gagnon. St Louis, MO: Cache River Press.
Cosson J, Linhart O, Mims SD, Shelton WL & Rodina M 2000 Analysis of motility parameters from paddlefish and shovelnose sturgeon spermato-zoa. Journal of Fish Biology 56 1348–1367.
Davis R & Siemers R 1995 Derivation and reliability of kinematic measures of sperm motion. Reproduction, Fertility, and Development 7 857–869. Davis RO, Drobnis EZ & Overstreet JW 1995 Application of multivariate cluster, discriminate function, and stepwise regression analyses to variable selection and predictive modeling of sperm cryosurvival. Fertility and Sterility 63 1051–1057.
Dreanno C, Cosson J, Suquet M, Cibert C, Fauvel C, Dorange G & Billard R 1999a Effects of osmolality, morphology perturbations and intracellular nucleotide content during the movement of sea bass (Dicentrarchus labrax) spermatozoa. Journal of Reproduction and Fertility 116 113–125. Dreanno C, Cosson J, Suquet M, Seguin F, Dorange G & Billard R 1999b Nucleotide content, oxidative phosphorylation, morphology, and fertilizing capacity of turbot (Psetta maxima) spermatozoa during the motility period. Molecular Reproduction and Development 53 230–243. Dreanno C, Suquet M, Fauvel C, Le Coz J, Dorange G, Quemener L & Billard R 1999c Effect of the aging process on the quality of sea bass (Dicentrarchus labrax) semen. Journal of Applied Ichthyology 15 176–180.
Fauvel C, Savoye O, Dreanno C, Cosson J & Suquet M 1999 Characteristics of sperm of captive seabass in relation to its fertilization potential. Journal of Fish Biology 54 356–369.
Fitzpatrick JL, Desjardins JK, Milligan N, Montgomerie R & Balshine S 2007 Reproductive-tactic-specific variation in sperm swimming speeds in a shell-brooding cichlid. Biology of Reproduction 77 280–284. Holt WV & Van Look KJW 2004 Concepts in sperm heterogeneity, sperm
selection and sperm competition as biological foundations for laboratory tests of semen quality. Reproduction 127 527–535.
Kaufman L & Rousseeuw P 1990 Finding Groups in Data: An Introduction to Cluster Analysis, New York: Wiley.
Kime DE, Van Look KJW, McAllister BG, Huyskens G, Rurangwa E & Ollevier F 2001 Computer-assisted sperm analysis (CASA) as a tool for monitoring sperm quality in fish. Comparative Biochemistry and Physiology, Part C 130 425–433.
Lahnsteiner F & Patzner RA 1998 Sperm motility of the marine teleosts Boops boops, Diplodus sargus, Mullus barbatus and Trachurus mediterraneus. Journal of Fish Biology 52 726–742.
Lahnsteiner F, Berger B, Weismann T & Patzner R 1995 Fine structure and motility of spermatozoa and composition of the seminal plasma in the perch. Journal of Fish Biology 47 492–508.
Lahnsteiner F, Berger B, Weismann T & Patzner RA 1998 Determination of semen quality of the rainbow trout, Oncorhynchus mykiss, by sperm motility, seminal plasma parameters, and spermatozoal metabolism. Aquaculture 163 163–181.
Lahnsteiner F, Berger B & Weismann T 1999 Sperm metabolism of the teleost fishes Chalcalburnus chalcoides and Oncorhynchus mykiss and its relation to motility and viability. Journal of Experimental Zoology 284 454–465. Lahnsteiner F, Berger B, Grubinger F & Weismann T 2005 The effect of
4-nonylphenol on semen quality, viability of gametes, fertilization success, and embryo and larvae survival in rainbow trout (Oncorhynchus mykiss). Aquatic Toxicology 71 297–306.
Lahnsteiner F, Berger B, Kletzl M & Weismann T 2006 Effect of 17b-estradiol on gamete quality and maturation in two salmonid species. Aquatic Toxicology 79 124–131.
Lang F, Busch GL, Ritter M, Volkl H, Waldegger S, Gulbins E & Haussinger D 1998 Functional significance of cell volume regulatory mechanisms. Physiological Reviews 78 247–306.
Mansour N, Lahnsteiner F & Patzner RA 2002 The spermatozoon of the African catfish: fine structure, motility, viability and its behaviour in seminal vesicle secretion. Journal of Fish Biology 60 545–560. Martı´nez-Pastor F, Dı´az-Corujo AR, Anel E, Herra´ez P, Anel L & de Paz P
2005a Post mortem time and season alter subpopulation characteristics of Iberian red deer epididymal sperm. Theriogenology 64 958–974. Martı´nez-Pastor F, Garcı´a-Macı´as V, A´lvarez M, Herra´ez P, Anel L & de
Paz P 2005b Sperm subpopulations in Iberian red deer epididymal sperm and their changes through the cryopreservation process. Biology of Reproduction 72 316–327.
Martı´nez-Pastor F, Garcı´a-Macı´as V, A´lvarez M, Chamorro C, Herra´ez P, de Paz P & Anel L 2006 Comparison of two methods for obtaining spermatozoa from the cauda epididymis of Iberian red deer. Theriogenology 65 471–485. Perchec G, Jeulin C, Cosson J, Andre F & Billard R 1995 Relationship between sperm ATP content and motility of carp spermatozoa. Journal of Cell Science 108 747–753.
Quintero-Moreno A, Miro J, Teresa Rigau A & Rodriguez-Gil JE 2003 Identification of sperm subpopulations with specific motility charac-teristics in stallion ejaculates. Theriogenology 59 1973–1990. R Development Core Team 2006 R: A Language and Environment for Statistical
Computing. Vienna, Austria: R Foundation for Statistical Computing. Rurangwa E, Volckaert FAM, Huyskens G, Kime DE & Ollevier F 2001 Quality
control of refrigerated and cryopreserved semen using computer-assisted sperm analysis (CASA), viable staining and standardized fertilization in African catfish (Clarias glariepinus). Theriogenology 55 751–769. Rurangwa E, Kime DE, Ollevier F & Nash JP 2004 The measurement of
sperm motility and factors affecting sperm quality in cultured fish. Aquaculture 234 1–28.
Suquet M, Dreanno C, Dorange G, Normant Y, Quemener L, Gaignon JL & Billard R 1998 The ageing phenomenon of turbot spermatozoa: effects on morphology, motility and concentration, intracellular ATP content, fertilization, and storage capacities. Journal of Fish Biology 52 31–41. Thurston L, Watson P & Holt W 1999 Sources of variation in the
morphological characteristics of sperm subpopulations assessed objec-tively by a novel automated sperm morphology analysis system. Journal of Reproduction and Fertility 117 271–280.
Thurston L, Watson P, Mileham A & Holt W 2001 Morphologically distinct sperm subpopulations defined by Fourier shape descriptors in fresh ejaculates correlate with variation in boar semen quality following cryopreservation. Journal of Andrology 22 382–394.
Toth GP, Ciereszko A, Christ SA & Dabrowski K 1997 Objective analysis of sperm motility in the lake sturgeon, Acipenser fulvescens: activation and inhibition conditions. Aquaculture 154 337–348.
Wilson-Leedy JG & Ingermann RL 2007 Development of a novel CASA system based on open source software for characterization of zebrafish sperm motility parameters. Theriogenology 67 661–672.
Received 20 August 2007 First decision 24 September 2007
Revised manuscript received 7 December 2007 Accepted 3 January 2008