Interaction between Innovation in
Small Firms and their Environments:
An Exploratory Study
MARIA TERESA DE NORONHA VAZ, MARISA CESA
´ RIO &
SI´LVIA FERNANDES
Faculty of Economics, University of Algarve, Faro, Portugal
[Received June 2004; accepted September 2004]
ABSTRACT Small food firms make up an important sector in the European economy and are particularly significant in rural areas where they are potential sources of employment and growth. Despite this, their behaviour as regards innovation has been relatively little studied to date. This exploratory investigation finds different types of innovative behaviours among small agro-food firms in peripheral regions and identifies some of the factors with which they are associated. The research reported here is based on a sample of 323 small and very small food and drink (hereafter “food”) firms drawn from 11 regions in six European countries. The food industry is generally regarded as a mature, low-technology industry, but this study identifies different clusters of small food firms according to innovative behaviours. It finds that, although a substantial number of firms may be defined as non-innovators, by far the largest cluster of food firms is involved in multiple forms of innovative activity. Recent studies have demonstrated the complexity of the determinants of technological progress. This may be modelled as a learning process in which small innovative firms tend to draw on internal and external sources of expertise and are both influenced by and influence the broader socio-economic environment in which they operate. This study uses cluster analyses to identify four types of innovative behaviours and examines the factors influencing these. It takes first steps to incorporate both measures of innovative capacity at the firm level as well as of the local development environment in order to explore links between the innovative capacity of small food firms and the characteristics of their regional contexts.
Introduction
An appropriate questionnaire to enable the dynamic elements to be more easily cap-tured would improve the potential for further testing with multivariate analytical methods. Econometric techniques could also be applied providing discrete variables
Correspondence Address: Maria Teresa de Noronha Vaz, Faculdade de Economia, Campus de Gambelas, Universidade do Algarve, 8000 – 117 Faro, Algarve, Portugal. Email: [email protected]
ISSN 0965-4313 print=ISSN 1469-5944 online=06=010095 – 23 # 2006 Taylor & Francis
could be avoided. Still, this paper opens the possibilities for developing quantitative approaches that can be useful instruments to evaluate the interaction between firm performance and regional development. It also suggests their use as accompanying instruments for policy makers. (Noronha Vaz et al., 2004; Vaz et al., 2004)
The Theoretical Framework
The industrial structures of the regions within the European Union (EU) are very different. They lead to contrasting growth capabilities, in some cases generating vicious circles in the development track that are extremely difficult to overcome. The local development of rural areas in peripheral regions is heavily influenced by the behaviour of small and medium agro-food firms whose role is to add value to agricultural production that is generally important in these areas (McDonagh & Commins, 1999). Yet the food industry is generally regarded as a mature and low-technology industry which evolves slowly with little radical change (Galizzi & Venturini, 1996) and this and other aspects of small, rurally based food producers have received, so far, relatively little attention.
For a long time capital investment was considered to be the driving force in economic growth but, more recently, the importance of technological change has been stressed. A rich literature has developed in this area since the pioneering work of Solow (1956) who investigated the growth of output in the US using a neo-classical economic growth model. The initial model had been improved already with Arrow’s (1962) introduction of learning by doing as a determinant of technological development. The inclusion by Lucas (1988) of human capital as a determinant of technical change was another major step, and Romer (1986, 1990) incorporated technical change endogenously determined by research. The spillover effects resulting from such approaches were explored in the Marshall–Arrow– Romer model, as discussed by Audretsch (2002) and technological innovation output is now seen as the product of knowledge generating inputs. In spite of such a clear neo-classical path, the considerable economic literature regarding innovation shows a tendency to fuzziness in the use of concepts regarding the interface among technical change, innovation and knowl-edge (Markusen, 1999). The present paper follows Acs (2002) in viewing industrial inno-vation as the driving force behind long-run regional growth and accepting the role that technology and entrepreneurship can play in fostering and promoting growth at the local level. An important strand of the recent literature on innovation, following the earlier advances, conceptualizes technological advance at the firm level as the result of a learning process (see, for example, Lundvall, 1992). Learning is seen as allowing the development of technological capabilities needed to adopt new equipment and to create different products (Lundvall, 1992). Two factors affect a firm’s incentive and ability to learn. These are the available knowledge and the cost of learning which may be influenced both by the type of knowledge which is relevant to the industry and the features of the environment in which the firm operates (Cohen & Levinthal, 1989). The organization’s capacity to learn can be seen as related both to factors which are internal to the firm, such as the knowledge of the entrepreneur and skills of the workforce gained through earlier experience, and to external aspects such as interactions with suppliers, customers, industry associations and public support bodies.
The present empirical study of innovative activities in small firms is set within this context. It is concerned to investigate and measure the capability of small firms in the
agro-food sector to engage in innovative activities as well as the relationship with features of the environment in which they operate. While set in the context of the earlier theoretical literature, this paper suggests advances in the ways of clarifying inputs to knowledge creation for innovative firms and investigates them in the context of their behavioural patterns.
The paper is organized as follows. First, it sets the background for the study and relates the asymmetries in EU regional performance to the need for an active regional and indus-trial policy. The second part presents the study aims and design and discusses the choice of territories and samples, which includes 323 small and very small food firms drawn from 11 regions in six European countries, and the choice and derivation of the variables. The next part discusses the empirical results. It shows how the sample firms are divided into four different clusters according to innovative behaviour. It also explores the linkages between the innovative capacity of small food firms and the characteristics of their regional environment by incorporating both measures of innovative capacity at the firm level and variables of local development as variables in the subsequent quantitative ana-lyses. The last section concludes the study.
The Regional EU Diversity Measured by the Intensity of their Technological Activities Since the 1980s, concerns about reducing regional asymmetries have resulted in consider-able pressure for reform of the EU structural funds. The less developed regions of the EU have benefited from considerable support but the results from the various policy instru-ments can still not be identified clearly. Indeed, researchers have tried to find out why, despite the efforts to bring about cohesion, there were for many years increasing gaps in the economic performance of different regions (Neto, 1999).
This paradox of widening disparities in regional performance in the face of efforts to reduce inequalities between the regions through structural funds is compounded by the paradox inherent in science and technology policy. Cohesion goals have led to con-siderable aid being given to support formal scientific research, both private and public. However, when applying its research and development (R&D) policy, the EU has given preference to the most advanced regions and the so-called “high-tech” industries.
Many questions persist. Is there a relationship between policy support and technological advance? What are the complex links between technological development and economic growth? How can a technological policy be put into practice in the peripheral regions without a minimal clarification of the technological development conditions for their firms (namely the small ones)? Knowing that formal science often does not result in improved technological performance, is it not necessary to understand the complex relations among the different innovation components to ensure that investments in R&D can have positive results? What are these interactions in the peripheral areas? These types of issues motivate the present study that aims to contribute quantitative evidence to assist in the development of policy towards the peripheral regions.
The Agro-food Sector as an Observation Field
A major characteristic of the less dynamic regions in the EU is the high percentage of agri-cultural employment in total employment (see Landabaso, 1997). The low growth rate of
these regions and the frequently high unemployment rate are also associated with a lack of technological activities. More then half of such regions were classified 10 years ago as Objective I regions for the purposes of EU structural support. Now, the question is how to address the weak performance of such regions, bearing in mind that the agro-food firms, which should serve as the engines of industrialization and growth by adding value to the outputs of their agricultural sectors, actually appear to be poor innovators. Such an important question was not taken into account when the main strands of the Euro-pean cohesion policy were formulated. From a policy perspective therefore, there is con-siderable potential interest in analysing the problem of regional development based on the entrepreneurial dynamics resulting from innovative activities in the agro-food chain.
In a previously published paper (Noronha Vaz et al., 2004) we have observed that changes in the economic environment of EU rural areas are permanently happening. Also, we pointed out that local determinants for change are not constant and can be measured, even over short time periods. These findings suggest the need for a regional policy based on flexible accompanying measures (Asheim & Isaksen, 2003).
The agro-food sector has characteristics of structural heterogeneity, contrasting stra-tegic choices and increasingly interactive behaviours that make it a very attractive field to study. It is not surprising, therefore, that the sector is a traditional observation field for studies related to modelling technical change and growth patterns. During the last decade, several authors have tried to establish a link between food and drink firms, especially the smaller firms in the sector, and the possibilities for local development (Noronha Vaz, 1995; Connor & Schiek, 1997; Nicolas, 1997; Pitts & Lagnevik, 1998; Rastoin & Vissac-Charles, 1999).
The agro-food sector helps to illustrate three main concepts which seem important for the actual context of local development:
. Networking is a new specialization mechanism that allows the growth of competitive production outside the large enterprises’ hierarchical system. Sometimes the role of networks is analysed either as a general principle grounded in the duration of inter-organizationalconnections (Fischer & Johansson, 1993). At other times, it is seen as an important strategic choice of firms, which enables them to respond to the local environment (Camagni, 1991; Morgan, 1996).
. Flexible specialization, so often in practised in the agro-food sector, is based on the idea that it is possible to have a non-hierarchical organization unit allowing the social division of labour and the reintegration of production operations (Piore, 1991). . Territorial identity, is a specific attribute linked to the territorial dimension can help to
attract industry and services to lagging zones. In the food industry, it may be used to narrow market segments and create specific products associated with the region so helping food firms in their search for niche markets (Sylvander, 1998).
In the particular case of the agro-food industry, the problem is to know how the inter-actions along the supply chain (producers – clients) can evolve in the different regions as described by Landabaso (1997). Each region has an environment more or less suitable for encouraging the various interactions required to promote the learning process under-lying firms’ innovative activities. In this context, the small enterprise’s performance is directly connected with the variations in the supply of goods and services (Acs & Audretsch, 1984) due to the links established with other firms of the same chain.
The Objectives of the Study
In proposing this study, it was felt that the findings would bring some light on the questions raised earlier. The aims of the research are threefold:
(1) To study the capacity of small firms to develop innovative activities by analysing of the interdependencies between technological change and the local environment. (2) To define and measure the potential for technological innovation of small and micro
enterprises as well as to evaluate how such potential might be applied to promote local development and competitiveness in the rural regions of the EU.
(3) To determine the analytical methods shedding light on the technological learning pro-cesses used by such firms. Small and micro food firms interact with their industrial partners, local institutions and are affected by the several governance systems that exist at regional or local level. The aim is to observe such interactions as an input to the design of cooperation programmes.
The Conceptual Model
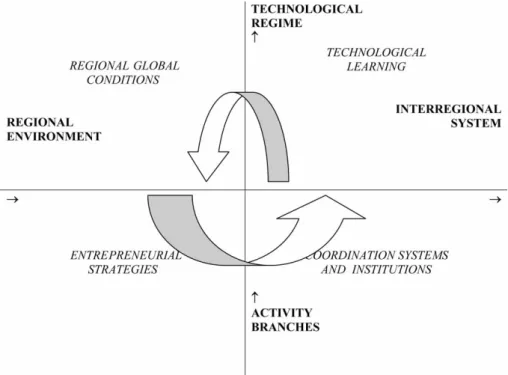
After reviewing the current literature and in the light of the defined goals, a schema has been developed to relate the four most important drivers referred to in recent theoretical works on innovation: regional global conditions for innovation, entrepreneurial strategies, institutional coordination systems and technological learning. It is not clear whether such drivers can be integrated in a cause – effect sequence. Instead they are seen as combining to affect two vectors of the dynamics undergoing development processes within territories: the capacity of regions to create technological regimes and their aptitude to interchange with others, starting or increasing interregional flows. Figure 1 presents a simplified scheme that encapsulates the conceptual framework underlying the empirical work in this paper.
Figure 1 represents a Cartesian space made up of two axes and four sets of variables. The horizontal axis shows the nature of the regional environment. The arrow indicates a development path that evolves from a closed regional environment, characterized by a restricted use of knowledge mainly based on routines and internal capacities, to an open interregional system where technologies and knowhow are often acquired from external sources and accessed by networking. In the present industrial model, the prevailing productive forms are increasingly related to open interregional systems. If tested using time-series analyses, the results should be able to detect a tendency for a natural move from the left part of the axis towards the right side over time.
The vertical axis indicates the evolution from simple forms of activity branches into complex technological regimes. The recent tendency to fragment industrial activities leads to the frequent desegregation of activity branches, earlier vertically integrated into more extended, not necessarily regionally localized, complex technological regimes. In this case, theoretically, only the introduction of long-term observations would be likely to show a tendency for changes that would displace regions or firms towards the top of the axis.
Regional global conditions for innovation, entrepreneurial strategies, institutional coordination systems and technological learning have been transformed, for estimation purposes, into four sets of different variables used to explain the interfaces for innovation. The representation expressed in Figure 1 indicates a dynamic approach.
In the model, improvements in regional global conditions for innovation and/or more adequate entrepreneurial strategies for innovation can pull the firm individually (or a region in a collective sense) to a hypothetical position located in the eastern quadrant, where technological learning and coordination are frequent requirements. On the other side, improvements in institutional coordination systems and new technological learning lead firms or regions to improve different regional global conditions for innovation and/or entrepreneurial strategies. The model suggests a spiral movement, difficult to demonstrate quantitatively, but useful in conceptualizing the complexity of structural change resulting from innovation.
The Methods Sampling
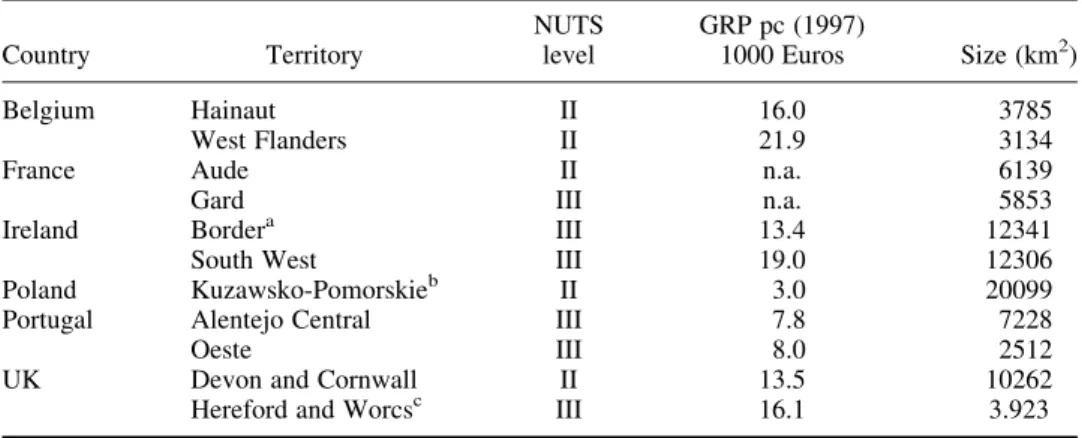
In order to carry out the empirical research, it was first necessary to identify suitable geographic areas to study. Two areas were selected from each of the five EU countries included in the research and one was chosen in Poland, resulting in a total of 11 regions (see Table 1). These territories are predominantly rural and are lagging. While lagging, the regions chosen in each country (with the exception of Portugal) show some contrast in performance in terms of economic growth. Each region was relatively homo-geneous internally in terms of its economic activities and social relations. Their discrete administrative borders (approximating NUTS II or III regions) facilitated the collection of secondary data.
Data on the activities of small agro-food and drink (hereafter “food”) firms were col-lected through fieldwork. The primary data focused on small and micro firms (between 3 and 49 employees) with the aim of collecting data for 30 such firms in each region. As a first step, it was necessary to identify the population of such enterprises located inside the selected territories. This was accomplished using a different and often multiple sources for each region, including official statistics (where available), databases from the relevant regional and local authorities, from chambers of commerce and from intermediary bodies such as national, regional and local food marketing organizations. Stratified sampling methods were then used based on the size distribution of firms (banded into three size bands: 3 – 9, 10 – 19, and 20 – 49 employees) so that the size distribution within the sample would reflect the importance of that size class in total employment among small food firms in the population. The final sample was composed of 323 small and micro firms and these were found to include the most important local activity branches within food processing in each territory.
Data Sources and Variables
Having chosen the territorial systems by reference to a limited set of economic and other criteria, a larger set of statistical information was collected from secondary sources as an input to the subsequent quantitative analysis. This included statistics on the demo-graphic structure, economic and social performance of the sample regions to reflect the environment within which the sample firms were operating. Considerable care was taken to ensure that only those variables and time periods were included in the analysis for which comparable data could be collected across the regions and this limited the indi-cators that could be used in the study considerably. Data were finally assembled for each year over the period 1994 – 1997 for 17 indicators reflecting aspects of the local capacity for industrial growth, as well as the financial support structure available to promote regional development as shown in Table 2.
Table 1.The territories studied
Country Territory NUTS level GRP pc (1997) 1000 Euros Size (km2) Belgium Hainaut II 16.0 3785 West Flanders II 21.9 3134
France Aude II n.a. 6139
Gard III n.a. 5853
Ireland Bordera III 13.4 12341
South West III 19.0 12306
Poland Kuzawsko-Pomorskieb II 3.0 20099
Portugal Alentejo Central III 7.8 7228
Oeste III 8.0 2512
UK Devon and Cornwall II 13.5 10262
Hereford and Worcsc III 16.1 3.923
a
Only part of a NUTS region was selected.
b
NUTS equivalent.
c
Warwickshire was excluded for the sake of homogeneity. n.a., information not available.
A detailed questionnaire composed mainly of closed questions was designed to collect the data from the sample of firms. The questionnaire was organized into seven sections:
(i) an overview of the firms;
(ii) the characteristics of the top manager; (iii) the history and the profile of the firm; (iv) manpower and training;
(v) products and processes produced and the changes in these; (vi) the forms of inter-company relationships;
(vii) relationships with support bodies and other aspects of the regional environment. The data was collected by fieldwork interviews with the firms’ owners or top managers. To ensure comparability in the fieldwork, those responsible for interviewing in each country were involved in the design of the questionnaire; a detailed interview guide was produced, and results at the pilot stage were carefully analysed so that any problems could be dealt with before the full scale survey. The response rates were generally high in each country and altogether a sample of 323 firms was included in the study.
The resulting data set included the measures required as proxies for different aspects of the variables discussed in Figure 1, namely, variables of entrepreneurial strategy, variables of coordination systems and institutions, variables of technological learning and, finally, those variables that indicate the overall regional conditions, as listed in Table 2. Further detail concerning the measurement of the variables derived from the questionnaire is given in the Appendix.
Turning now to the dependent variable, technical progress has been extensively studied in recent literature, but there is still no generally accepted way to define and measure innovation. Following the approach used in the Community Innovation Survey, a broad definition of innovation was adopted here so changes that were new to the firm were regarded as “innovation”. Innovation is a multidimensional concept and its measurement is particularly problematic in low technology industries where it is generally recognized
Table 2.Variables indicative of regional global conditions Internal regional product per capita
Gross added value per person employed
Gross added value per person employed in the primary sector Gross added value per person employed in the secondary sector Gross added value per person employed in the tertiary sector Proportion of active population with secondary level qualifications Proportion of active population with higher level qualifications
Investments in transports and communications in relation to surface area Employment in the primary sector as a percentage of total employment Employment in the secondary sector as a percentage of total employment Employment in the tertiary sector as a percentage of total employment
Number of enterprises in the primary sector as a percentage of total number of enterprises Number of enterprises in the secondary sectors as a percentage of total number of firms Number of enterprises in the tertiary sector as percentage of total number of enterprises Expenditure on food as a proportion of household expenditure
Expenditure on drink as a proportion of household expenditure
that R&D activities and patent data will not provide good proxies for innovation. Accord-ing to Lundvall (1995) innovation is “an ongoAccord-ing process of learnAccord-ing, searchAccord-ing, and exploring which results in new products, new techniques, new forms of organization and new markets”. In light of this, four main types of innovation were included in this study, namely: product innovation (I1), process innovation (I2), organizational innovation
(I3), and marketing innovation (I4). The presence or absence of process innovation in the
last 5 years was measured by a binary variable. The other types of innovation were measured by innovation indices that were each constructed using a combination of varia-bles obtained from the group of responses within the questionnaires. The weights used to construct these indices were decided on the basis of experts’ opinion derived in a face to face meeting between experts in the food industry representing the different countries participating in this study.
I1¼2=13v251 þ 1=13v340 þ 1=13v342 þ 4=13v346 þ 5=13v347
I2¼v252
I3¼1=6v396 þ 1=6v397 þ 1=6v398 þ 1=6v399 þ 1=6v401 þ 1=6v402
I4¼2=4v251 þ 1=4v344 þ 1=4v397
The variables included are shown in Table 3.
Each of the resulting indicators varies between zero and one. An overall innovation index was also calculated as a simple average of these four innovation indices. This method has similarities to the approach adopted by Diederen et al. (2000) in their analysis of innovation in the agriculture. The weights to be applied to the constituent parts of each indicator are clearly a matter of subjective judgement and would ideally be derived from a formal Delphi study incorporating a number of rounds of evaluation by experts in the industry. However, the weightings resulting from a consensus reached after one round of face to face discussion among industry experts was felt to be sufficiently robust to be used in this exploratory study.
The Analysis
The main focus of attention was on identifying whether there were different types of firms in terms of innovation patterns and exploring the behaviour of any different groups which emerged. Cluster analysis was applied to the 13 innovation variables to assess whether there were distinct groups of firms among the total sample. The square Euclidean distance was the measure of distance applied in the cluster analysis and hierarchical agglomeration was the aggregation method used, with the average linkage between groups as the aggre-gation procedure. The groups were then characterized in terms of differences highlighted by inspection of the mean values of the four composed variables explaining innovation (I1, I2, I3and I4) and an overall index calculated as an average of these four. Different
patterns of innovative behaviour between the groups were identified in terms of the variables that had contributed most to the clustering process.
An exploratory analysis of the patterns of association between the different groups and the variables of technological learning, entrepreneurial strategies, coordination systems and regional conditions was then carried out. These variables are listed in the Appendix. The average values of these variables for each of the groups of firms identified through the
cluster analysis were examined in order to detect differences in the patterns of innovative behaviour.
The Results
Detecting Patterns of Entrepreneurial Behaviour
The sample of firms was grouped into four distinct types according to their innovation characteristics: Group I – 175 firms, Group II – 84 firms, Group III – 31 firms, Group IV – 33 firms. As Table 4 shows, the firms within the clusters were spread amongst differ-ent territories studied. The resulting groups were characterized, respectively, as multiple innovators, non-innovators, focused innovators with higher performance levels, and focused innovators with lower performance levels on the basis of the results and with reference to the mean values of each one of the four innovation indices and the overall innovation index in each cluster (see Table A1 in the Appendix).
. Multiple innovators: The first cluster contains a large group of firms (175) that develop both product and process innovation at quite significant levels and combine these, also, with forms of marketing and organizational innovation. All the regions are represented
Table 3.
Variable Description Type of variable Coding
v251 New or substantially modified products
Dummy 1 if innovation; 0 otherwise v252 New or substantially modified
processes
Dummy 1 if innovation; 0 otherwise v340 Product innovation: new
ingredients
Dummy 1 if innovation; 0 otherwise v342 Product innovation: new packing
material
Dummy 1 if innovation; 0 otherwise v344 Product innovation: visual
appearance
Dummy 1 if innovation; 0 otherwise v346 When products new are
introduced which are new to firm, how often are they also new to the market
Categorical In bands, up to 4 (always)
v347 Percentage of turnover due to new products
Categorical In bands, up to 5 (21% þ ) v396 Organizational change in
management
Dummy 1 if innovation; 0 otherwise v397 Organizational change in
marketing structure
Dummy 1 if innovation; 0 otherwise v398 Organizational change in
financial structure
Dummy 1 if innovation; 0 otherwise v399 Organizational change in
production operations
Dummy 1 if innovation; 0 otherwise v401 Organizational change in
logistics management
Dummy 1 if innovation; 0 otherwise v402 Organizational change in other
functional areas
amongst the firms within this group but relatively few of them are found in Gard, Alentejo Central and West Flanders.
. Non-innovators: This is the second largest group (84 firms) and represents firms that are the least innovative. Among these firms, which are mainly located in Alentejo Central, south-west and West Flanders, process innovation occurs in a few cases but there is very little indication of product, organizational and marketing innovation.
. Focused innovators: The last two groups of firms, which are of approximately equal size and together, contain 64 firms, display similar behavioural patterns in terms of the types of innovation carried out. Product innovation is relatively frequent and there are some efforts to innovate in marketing or in the firm’s organization or processes but there is no evidence of process innovation. The overall level of innovative perform-ance, however, differs between these two groups. It is mainly the English, Irish and Polish firms which belong to the more innovative cluster.
A cross tab analysis was carried out to see whether the clusters of firms corresponded to the different industrial sub-sectors of the agro-food industry but there was no significant relationship between area of activity and cluster membership.
Factors Associated with the Different Types of Innovative Status
This analysis was based on the sets of variables that were used earlier to develop the theoretical framework: entrepreneurial strategies, coordination systems and institutions, technological learning and regional global conditions (the Appendix supplies the list of such variables and shows the methods of classification used). The average values of these variables were calculated, by cluster, and the most relevant ones in terms of a cross comparison between the patterns are shown in Table A2 in the Appendix.
The multiple innovators
These firms are slightly larger, in terms of the number of workers, than the other groups— about four employees more. On average, their top managers (TMs) have spent less time in
Table 4.Clustering and firms’ regional location
Clusters Multiple innovators Non-innovators Focused innovators—lower performance Focused innovators—higher performance Aude 20 5 4 1 Gard 8 9 11 2 Devon/Cornwall 17 2 5 6 Hereford/Worcester 17 3 2 8 Oeste 14 7 1 0 Alentejo Central 11 17 2 0 South-west 15 10 1 4 Border 18 9 1 2 West Flanders 12 11 2 4 Hainaut 20 3 2 1 Kuzawsko-Pomorskie 23 8 0 5 Total 175 84 31 33
this position and are clearly younger, although the firms were not recently formed and can be considered mature.
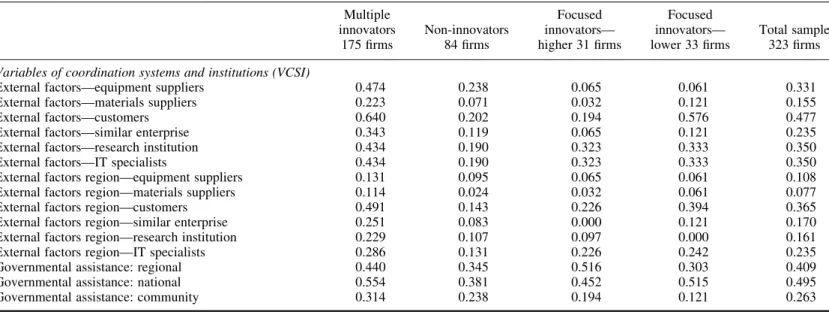
The concept of coordination systems and institutions within the theoretical framework was treated for estimation purposes as giving rise to a separate set of variables. In practice, however variables grouped under this heading can be seen as closely connected with the strategic choices of the firms. Cooperation is far more important in the group of multiple innovators and this is due to relations external to the regions. All the results concerning cooperation with suppliers of equipment, materials or customers, with similar firms or research institutions show much higher values then those for the other groups. In certain cases, the values double. Governmental support is clearly important also: these firms access EC programmes more than others, but national governmental assistance is still the most important source of state support, followed by the regional programmes.
A clear characteristic of multiple innovators is their engagement in technological learn-ing. The educational profile of their TMs indicates that, at a minimum, they hold college certificates in most cases. However, neither the area of qualification (business or econ-omics versus technology or engineering) nor the number of years the TMs have been in their firms appears to be related to the firms’ innovativeness. The personnel is more highly qualified then it is the case in other groups, and the training effort is mainly carried out in the firm. Also the expenditure on R&D as a percentage of turnovers is far greater than those of the other behavioural groups.
The non-innovators
This group shows a very low index of innovative performance. Few innovative activities are detected and these are concentrated mainly in forms of process innovation. When we look for reasons to justify such results in terms of entrepreneurial strategies, we find the oldest TMs of the four observed groups who have been firm leaders for a long time and are deeply involved within regional activities, carrying out other parallel businesses. On average these firms are more than 100 years old, have less employees then the preceding group and have almost no R&D expenditures.
As far as coordination systems and institutions are concerned these firms are extremely closed. Relationships with material suppliers or similar enterprises inside or outside the region are almost inexistent. The only established cooperative forms are those resulting from contacts with equipment suppliers or customers outside the region. There are, however, a few contacts with research institutions or high-tech specialists. This group uses governmental support less then the other groups and where it is accessed, it is generally under national schemes.
Technological learning is largely responsible for the performance failure in this group. A large number of TMs have no post school qualifications, the qualifications and training of employees is low, rarely using opportunities external to the region. The average turnover spent by these firms on R&D is more then seven times less than is the case for multiple innovators.
The focused innovators
The remaining firms form the focused innovators. They can be classified into two groups, low and higher performance, both with an interesting common characteristic: none of them has promoted process innovation at all. All the other innovative forms exist. The group of
higher performance focused innovators show twice as much product innovation on average compared with the lower performance firms.
Indeed, the entrepreneurial strategies variables related to these groups have values that approximate those for the multiple innovators with the slight difference that TMs are in this case older and the firms are much more recently founded. Also, one striking difference between the lower and higher innovative performance firms is their size as lower performance firms have, in average, three workers less than the others.
The variables related to coordination systems and institutions most clearly differentiate between the set of firms. Even when higher performance firms are considered, the values for external exchange within or out of the region are minimal. They do show support from customers inside the region and the use of scientific and IT support located nearby. As regards governmental assistance, the main difference between focused innovators and the other groups is the little use they have made of assistance from European support pro-grammes.
As regards the technological learning set of variables, it is notable that the lower performance firms have a more significant number of TMs with high qualification levels. At the same time they have a much lower number of technical qualified staff than the higher performance ones, where external training plays an important role.
Overall Regional Conditions
Very interesting and important conclusions arise in this section which show the point to which overall regional conditions may influence innovation in firms.
Although it has been always pointed out that the development of regions influences innovation positively in a number of ways including the easier access to finance, our multiple innovators are located in the set of regions that on average had lower values of IRP per capita in 1994. In contrast, lower performance focused innovators are located in the richest regions, where in addition, the highest added values are created in agriculture, industry and services.
A more qualified labour force (LFQ) is clearly associated with a tendency towards inno-vation, especially product innovation. It is interesting to note that focused innovators have a higher participation of regional LFQ, particularly at secondary level. It is exactly the same with investment in transport.
There is no correlation between regional employment in services and innovation, no matter what type of innovation is taking place. We can only say that focused innovators, whether lower or higher performers tend to be located in regions with more services. The regions which mostly contained higher performer focused innovators had a significant increase of new industrial activity in 1994. In 1997, during a stagnation period, the new agricultural activities were predominant in the areas where multiple innovators are located.
Conclusion
It is now widely recognized that the organization’s capacity to learn is related to both factors which are internal to the firm and external aspects such as interactions with suppliers, customers, and industrial associations and public bodies. At the same time, such interactions may have positive effects that go beyond the firms themselves, to
influence the broader socio-economic context in which they operate. Theoretically a two-way flow is established for which regional or local characteristics influence innovation in small firms while the regional economic development is affected by the innovative behaviour of the firms themselves. The transition from a closed regional environment to an open interregional system demands an evolution of economic activity from simple forms of activity branches into complex technological regimes. In such a dynamic system, technological learning, entrepreneurial strategies, coordination systems and institutions and overall regional conditions, are factors that determine firm attitudes to innovation. It is, however, quite difficult to group the variables within these four sets of factors which were summarized in the quadrant diagram and this is partly due to inter-relationships between the different aspects covered. One example is the variable “number of year the top manager has been in the enterprise” which could be a proxy for entre-preneurial strategy or technological learning. Following this point, the four quadrants of the theoretical approach are an attempt to elaborate a global framework but can be modified as a result of improvements in the modelling process.
In the present study we have separated out a number of variables which are able to characterize firms and regional performance towards different innovation forms. A quan-titative approach has been used to demonstrate that the capacity to innovate is a complex attribute whose determinants change within the different contexts but do allow direct quantification. Further, we are able to conclude that the environmental conditions might lead to different innovative patterns suggesting specific instruments for regional policy. This is an important conclusion for policy-makers.
The global behaviour of the sample was analysed and the performance of different regions and firms in different types of regions compared. In this exploratory study, a number of variables were found to be significantly associated with the behavioural pat-terns of firms towards innovation. Concerning the technological learning, factors like the TM high qualification, the technical qualification of firm workers and/or their training in the exterior have been identified; the recent and exclusive dedication of the TM seems also to be a signal of tendency for more innovative activities in the firms; coordination systems and institutions have been detected as constituting the most important group of factors, namely at the level of closed relations of suppliers and customers or interaction with research institutions. Governmental national assistance also indicated as highly associated to forms of innovativeness.
There is clearly scope to improve the estimation of the model through refinements of the questionnaire approach and by using bigger sets of firms to allow the definition of more specific behavioural patterns. An appropriate questionnaire to enable the dynamic elements to be more easily captured would improve the potential for further testing with multivariate analytical methods. Econometric techniques could also be applied providing discrete variables could be avoided. Still, this paper opens the possibilities for developing quantitative approaches that can be useful instruments to evaluate the inter-action between ily captured, firm performance and regional development. It also suggests their use as accompanying instruments for policy-makers.
Acknowledgements
This paper was made possible through an EU FP5 research grant (SERD-1999-00149). We are thankful to an anonymous reviewer whose comments were a precious contribution to
improve the quality of this work and to Eleanor Morgan due to her help in the technical translation and critical suggestions.
References
Acs, Z. (2002) Innovation and Growth of Cities (Cheltenham: Edward Elgar).
Acs, Z. & Audretsch, D. B. (1984) Small business in industrial economics: The new learning, Revue d”Economie Industrielle, 67, pp. 21 – 39.
Arrow, K. J. (1962) The economic implication of learning by doing, Review of Economic Studies, 29, pp. 155 – 173.
Asheim, B. & Isaksen, C. (2003) SMEs and the regional dimension of innovation, in: B. Asheim et al. (Eds) Regional Innovation Policy for Small-medium Enterprises, pp. 21 – 46 (Cheltenham: Edward Elgar). Audretsch, D. (2002) The innovative advantages of US cities, European Planning Studies, 10, pp. 165 – 176. Camagni, R. (1991) Innovation Networks: Spatial Perspectives (London: Belhaven Press).
Cohen, W. & Levinthal, D. (1989) Innovation and learning: The two faces of R&D— implications for the ana-lyses of R&D investment, Economic Journal, 99, pp. 569 – 596.
Connor, J. & Schiek, W. (1997) Food Processing—an Industrial Power House in Transition (New York: John Wiley & Sons).
Diederen, P., Van Meijl, H. & Wolters, A. (2000) Eureka! Innovatieprocessen en innovatiebeleid in de land-en tuinbouw (The Hague: LEI).
Fischer, M. & Johansson, B. (1993) Networks for process innovation by firms: Conjectures from observations in three countries, in: K. Johansson (Ed.) Patterns of a Network Economy (Berlin: Springer-Verlag). Galizzi, G. & Venturini, L. (Eds) (1996) Economics of Innovation: The Case of the Food Industry (Heidelberg:
Physica-Verlag).
Landabaso, M. (1997) The promotion of innovation in regional policy: Proposals for a regional innovation strategy, Entrepreneurship & Regional Development, 9(1), pp. 1 – 24.
Lucas, R. E. (1988) On the mechanics of economic development, Journal of Monetary Economics, 22, pp. 92 – 96. Lundvall, B. A. (1988) Innovation as an interactive process, in: Dosi et al. (Eds) Technical Change and Economic
Theory (London: Pinter), pp. 349 – 369.
Lundvall, B. A. (l995) National Systems of Innovation; Towards a Theory of Innovation and Interactive Learning (London: Pinter).
Markusen, A. (1999) Fuzzy concepts, scanty evidence, policy distance: The case for rigor and policy relevance, critical regional studies, Regional Studies, 33(9), pp. 869 – 884.
McDonagh, P. & Commins, P. (1999) Food chains, small scale food enterprises and rural development: Illustrations form Ireland, International Planning Studies, 4(3) pp. 349 – 371.
Morgan, K (1996) L’apprentissage par I’interaction: Re´seaux d’entreprises et services d’appui aux entreprises, Re´seaux d’Entreprises et De´veloppement Local, pp. 59 – 74 (Paris: OCDE).
Neto, P. (1999) A Integrac¸a˜o Espacial: Economias de Rede e Inovac¸a˜o (Lisbon: Instituto Piaget).
Nicolas, F. (1997) Globalization’s consequences for vertical coordination and competition in the food system, in: G. Galizzi & L. Venturini (Eds) Vertical Relationships and Coordination in the Food System, pp. 157 – 180 (Heidelberg: Physica-Verlag).
Noronha Vaz, M.-T. (1995) Internationalisation processes in SMEs of the agri-food sector in Portugal, Options Me´diterrane´ennes, 26, pp. 193 – 200.
Noronha Vaz, M.-T. & Cesa´rio, M. (2004) Territorial systems in the rural areas of the European Union, New Medit Journal, 4, pp. 11 – 22.
Noronha Vaz, M. T., de Viaene, J., Rastoin, J. L., Pitts, E., Morgan, E., Nicolas, F., Noime, C. & Wigier, M. (2004) Innovation in small firms and dynamics of local development. Final Report to the European Commis-sion, 5th Framework Program for Research, Technology, and Development Activities.
Piore, M. (1991) Nouvelles remarques sur les trajectoires technologiques, Figures de I’Irre´versibilite´ en Economie, pp. 137 – 150 (Paris: EHESS).
Pitts, E. & Lagnevik, M. (1998) What determine food industry competitiveness?, in: B. Traill & E. Pitts (Eds) Competitiveness in Food Industry, pp. 1 – 34 (London: Blackie Academic and Professional).
Rastoin, J.-L. & Vissac-Charles (1999) Le groupe strate´gique des PMEs de terroir, Revue Internationale des PME.
Romer, P. M. (1986) Increasing returns and long term growth, The Journal of Political Economy, 94, pp. 1002 – 1037.
Romer, P. M. (1990) Endogenous technological change, The Journal of Political Economy, 98(5) pp. 71 – 102. Solow, R. (1956) A contribution to theory of economic growth, The Quarterly Journal of Economics, 70,
pp. 65 – 94.
Sylvander, B. (1998) Innovation, coordination verticale, technologie et qualite´, Recherches pour et sur le De´velopment Territorial—Development Regional Agricole et Agro-Alimentaire, Etude et Valorisation, INRA. Vaz, M. T. N., Viaene, J. & Wigier, M. (Eds) (2004) Innovation in Small Firms and Dynamics of Local
Development (Warsaw: Scholar Publishers).
Appendix List of Variables
Variables of technological learning (VTL)
Internal factors of innovationTechnological resources – R&D expenses as percentage of turnover in 2000.
– Ownership of intellectual property—patents, licences, registered brands or designs (binary variable where 1 indicates ownership).
(1) Skills of the workforce
– Number of specialized workers, with managerial or technical functions. – Proportion of the previous staff categories in the total workforce.
– Presence or absence of training in 2000 (binary variable, 1 indicates presence). – Types of training carried out: technical, marketing, information technologies, food
safety and hygiene (variable ranging from 0 to 4, where 4 indicate all four types of training).
(2) Education of the TM
– First level school completion certificate (binary variable, 1 indicates completion). – Second level school completion certificate (binary variable, 1 indicates completion). – University bachelor, graduation or master’s degree (binary variable, 1 indicates
completion).
– Post school qualification in business or economics (binary variable, 1 indicates qualified).
– Post school qualification in technology or engineering (binary variable, 1 indicates qualified).
Variables of entrepreneurial strategy (VES) (1) Characteristics of the enterprise
– Size of the enterprise (number of employees). – Age of the enterprise.
(2) Profile of the TM
– Age of the owner/TM (variable divided into the following intervals: ,29, 30 – 39, 40 – 49, 50 – 59, 60 – 69, .70).
– Number of years active in the enterprise. – Number of years as the top manager.
– Owner inherited the enterprise or purchased from family (binary variable, 1 indicates inherited or purchased).
– Experience in a similar business (binary variable, 1 indicates such experience). – Owner is from region (binary variable, 1 indicates from region).
Variables of coordination systems and institutions (VCSI) External factors of innovation
– Use of inputs for developing R&D activities or product/process/organizational inno-vations. These may come from 6 types of external agents: equipment suppliers, material suppliers, customers, similar enterprises, research institutions, management consultants including IT specialists (binary variable for the presence or absence of interaction with each category of external agents and a variable with an interval from 0 to 6, where 6 indicates inputs from all six categories of agents).
– Using regional inputs for developing R&D activities or product/process/organizational innovations, which come from the same previous categories of external agents accord-ing to whether they are located in the same region as the enterprise (variable is defined like the previous one but with 0 if the input is from outside the region).
– Using structures of public support, such as: funds, subsidies, R&D grants, promotion of local industries, training support, etc. (three binary variables for the presence or absence of these supports at the regional, national and European level where 1 indicates presence of such support).
Table A1.Innovation functions by cluster Product innovation I1¼ 2/13v251 þ 1/13v340 þ 1/13v342 þ 4/13v346 þ 5/13v347 Process innovation I2¼ v252 Organizational innovation I3¼ 1/6v396 þ 1/6v397 þ 1/6v398 þ 1/6v399 þ 1/6v401 þ 1/6v402 Marketing innovation I4¼ 2/4v251 þ 1/4v344 þ 1/4v397 Multiple innovators (175 firms)
v251 New or substantially modified products 0.87 0.87
v252 New or substantially modified processes 1.00
v340 Product innovation: new ingredients 0.69
v342 Product innovation: new packing material 0.58
v344 Product innovation: visual appearance 0.64
v346 Products new to the market 2.90
v347 Percentage of turnover due to new products 3.47
v396 Organizational change in management 0.51
v397 Organizational change in marketing structure 0.33 0.33
v398 Organizational change in financial structure 0.33
v399 Organizational change in production operations 0.62
v401 Organizational change in logistics management 0.25
v402 Organizational change in other functional areas 0.10
Innovation function—average valuea 1.70 1.00 0.36 0.61
Total innovation indexb 0.92
Non-innovators (84 firms)
v251 New or substantially modified products 0.14 0.14
v252 New or substantially modified processes 0.37
v340 Product innovation: new ingredients 0.10
v342 Product innovation: new packing material 0.02
v344 Product innovation: visual appearance 0.14
v346 Products new to the market 0.17
v347 Percentage of turnover due to new products 0.26
M. T. De Noronha Vaz et al.
v397 Organizational change in marketing structure 0.10 0.10
v398 Organizational change in financial structure 0.06
v399 Organizational change in production operations 0.21
v401 Organizational change in logistics management 0.10
v402 Organizational change in other functional areas 0.05
Innovation function—average valuea 0.14 0.37 0.12 0.14
Total innovation indexb 0.19
Focused innovators with lower performance (31 firms)
v251 New or substantially modified products 0.81 0.81
v252 New or substantially modified processes 0.00
v340 Product innovation: new ingredients 0.58
v342 Product innovation: new packing material 0.32
v344 Product innovation: visual appearance 0.42
v346 Products new to the market 2.58
v347 Percentage of turnover due to new products 1.03
v396 Organizational change in management 0.16
v397 Organizational change in marketing structure 0.06 0.06
v398 Organizational change in financial structure 0.10
v399 Organizational change in production operations 0.29
v401 Organizational change in logistics management 0.06
v402 Organizational change in other functional areas 0.03
Innovation function—average valuea 1.06 0.00 0.12 0.43
Total innovation indexb 0.40
Focused innovators with higher performance (33 firms)
v251 New or substantially modified products 1.00 1.00
v252 New or substantially modified processes 0.00
v340 Product innovation: new ingredients 0.91
v342 Product innovation: new packing material 0.33
v344 Product innovation: visual appearance 0.33
v346 Products new to the market 2.94
v347 Percentage of turnover due to new products 3.76
v396 Organizational change in management 0.36
(Table continued ) Int eraction betwe en Innov ation in Small Firms and their Environm ents 113
Table A1. Continued Product innovation I1¼ 2/13v251 þ 1/13v340 þ 1/13v342 þ 4/13v346 þ 5/13v347 Process innovation I2¼ v252 Organizational innovation I3¼ 1/6v396 þ 1/6v397 þ 1/6v398 þ 1/6v399 þ 1/6v401 þ 1/6v402 Marketing innovation I4¼ 2/4v251 þ 1/4v344 þ 1/4v397
v397 Organizational change in marketing structure 0.24 0.24
v398 Organizational change in financial structure 0.15
v399 Organizational change in production operations 0.33
v401 Organizational change in logistics management 0.12
v402 Organizational change in other functional areas 0.06
Sample size
Innovation function—average valuea 1.79 0.00 0.21 0.52
Total innovation indexb 0.63
a
Resulted from the linear combination of the variable’s average value.
b
Average value between the Innovations function’s value.
M. T. De Noronha Vaz et al.
Table A2.Determinant variables: mean values by cluster Multiple innovators 175 firms Non-innovators 84 firms Focused innovators— higher 31 firms Focused innovators— lower 33 firms Total sample 323 firms Variables of technological learning (VTL)
Educational qualification of TM—post school 0.291 0.321 0.194 0.394 0.300
Educational qualification of TM—college certificate 0.234 0.190 0.129 0.061 0.195
Educational qualification of TM—higher degree 0.377 0.286 0.452 0.333 0.356
Area of qualification of TM: business/economics 0.240 0.190 0.355 0.333 0.248
Area of qualification of TM: technology 0.274 0.238 0.323 0.242 0.266
Qualified technical (2000) 2.794 1.012 1.839 2.152 2.173
Percentage qualified technical (2000) 0.053 0.063 0.085 0.060 0.059
Training carry out 0.794 0.536 0.677 0.727 0.709
Training carry out—types 1.451 0.762 1.032 0.758 1.161
Percentage of turnover spend on R&D (2000) 1.713 0.230 0.226 1.000 1.112
E13.cod Intellectual property 0.674 0.488 0.645 0.333 0.588
Variables of entrepreneurial strategies (VES)
Firm age 85.966 108.500 229.032 32.424 100.087
People normally working (2000) 18.589 14.595 13.774 16.242 16.848
Age of the TM (by ranges) 3.040 3.393 3.355 3.152 3.173
Number of years the TM enter in the firm initially 12.566 16.643 15.161 12.091 13.827
How did the TM enter this enterprise initially 0.149 0.179 0.258 0.152 0.168
How many years has the TM been TM 10.366 13.952 12.355 8.636 11.313
TM’s involvement within the region 0.737 0.798 0.581 0.636 0.728
Experience in similar business 0.469 0.571 0.323 0.394 0.474
(Table continued ) eraction betwe en Innov ation in Small Firms and their Environm ents 115
Table A2. Continued Multiple innovators 175 firms Non-innovators 84 firms Focused innovators— higher 31 firms Focused innovators— lower 33 firms Total sample 323 firms Variables of coordination systems and institutions (VCSI)
External factors—equipment suppliers 0.474 0.238 0.065 0.061 0.331
External factors—materials suppliers 0.223 0.071 0.032 0.121 0.155
External factors—customers 0.640 0.202 0.194 0.576 0.477
External factors—similar enterprise 0.343 0.119 0.065 0.121 0.235
External factors—research institution 0.434 0.190 0.323 0.333 0.350
External factors—IT specialists 0.434 0.190 0.323 0.333 0.350
External factors region—equipment suppliers 0.131 0.095 0.065 0.061 0.108
External factors region—materials suppliers 0.114 0.024 0.032 0.061 0.077
External factors region—customers 0.491 0.143 0.226 0.394 0.365
External factors region—similar enterprise 0.251 0.083 0.000 0.121 0.170
External factors region—research institution 0.229 0.107 0.097 0.000 0.161
External factors region—IT specialists 0.286 0.131 0.226 0.242 0.235
Governmental assistance: regional 0.440 0.345 0.516 0.303 0.409
Governmental assistance: national 0.554 0.381 0.452 0.515 0.495
Governmental assistance: community 0.314 0.238 0.194 0.121 0.263
M. T. De Noronha Vaz et al.
Table A3.Variables of regional global conditions: mean values by cluster Multiple innovators 175 firms Non-innovators 84 firms Focused innovators— higher 31 firms Focused innovators— lower 33 firms
IRP per capita 1994 11.632 11.302 14.214 12.953
GAV/empl 1994 41.344 39.016 65.580 37.650
GAV agric/Empl agric 1994 43.962 49.751 63.737 43.865
GAV ind/empl ind 1994 39.206 37.342 52.034 43.818
GAV serv/empl serv 1994 46.179 45.588 78.626 37.808
LFQ sec/actif pop 1994 0.377 0.322 0.339 0.506 LFQ high/actif pop 1994 0.144 0.124 0.103 0.190 Inv transp/surface 1994 39.522 27.267 30.859 41.880 % empl agric 1994 0.103 0.117 0.067 0.094 % empl ind 1994 0.295 0.312 0.311 0.271 % empl serv 1994 0.598 0.568 0.621 0.636
New agric/total agric 1994 0.187 0.161 0.110 0.150
New ind/total ind 1994 1.695 0.900 1.089 3.664
New ser/total ser 1994 0.191 0.163 0.201 0.170
Hous exp food/hous Exp total 1994 0.207 0.206 0.161 0.219
Hous exp drinks/hous Exp total 1994 0.031 0.028 0.029 0.037
Hous exp cat/hous exp total 1994 0.039 0.050 0.055 0.030
IRP per capita 1997 13.778 14.351 4.332 8.125
GAV/empl 1997 42.173 40.593 65.638 40.110
GAV agric/empl agric 1997 71.623 57.329 77.402 50.561
GAV ind/empl ind 1997 43.122 42.935 55.753 47.656
GAV serv/empl serv 1997 39.465 32.622 32.281 31.931
LFQ sec/actif pop 1997 0.312 0.277 0.294 0.343 LFQ high/actif pop 1997 0.156 0.134 0.111 0.203 Inv transp/surface 1997 45.193 30.049 32.977 42.184 % empl agric 1997 0.097 0.109 0.065 0.087 % empl ind 1997 0.278 0.265 0.288 0.274 % empl serv 1997 0.610 0.579 0.632 0.640
New agric/total agric 1997 0.205 0.173 0.103 0.172
New ind/total ind 1997 0.124 0.106 0.115 0.123
New ser/total ser 1997 0.178 0.155 0.179 0.168
Hous exp food/hous exp total 1997 0.202 0.203 0.159 0.214
Hous exp drinks/hous exp total 1997 0.028 0.027 0.026 0.028