CFRP-BASED CONFINEMENT STRATEGIES FOR RC COLUMNS-EXPERIMENTAL AND ANALYTICAL RESEARCH
Débora Ferreira
1University of Minho, Department of Civil Engineering Azurém - 4810-058 Guimarães, Portugal
Joaquim Barros
2University of Minho, Department of Civil Engineering Azurém - 4810-058 Guimarães, Portugal
ABSTRACT
The present work aims to compare the confinement efficacy of full and partial wrapping of concrete elements under compression loads. The main results of the experimental program are presented and analysed. The Lam and Teng analytical model was applied to predict the compression stress-strain behaviour of concrete column elements partially confined by strips of CFRP lay-up sheets. The model performance is assessed using the experimental results.
1.INTRODUCTION
It is well recognized that both the strength and ductility of concrete compressive members can be greatly enhanced using transverse carbon fiber reinforced polymer (CFRP) wraps. These non-corrosive and lightweight wraps, which are easy of installing, can be used to rehabilitate damaged concrete columns, increase the load capacity of under strength members, and retrofit seismically inadequate bridges and buildings. Among many possible applications of CFRP materials, one of the most attractive is their use as confining systems for concrete columns, which may results in remarkable increase of strength and ductility. The current CFRP-based confinement strategy is wrapping the exposed area of the concrete column. Preliminary tests with concrete elements submitted to direct compressive loading have, however, revealed that partial wrapping (strips of CFRP sheets) is also a promising confinement technique, since significant increments on the load carrying capacity and energy absorption capacity were obtained using this type of discrete confinement Barros and Ferreira (2005), Ferreira and Barros (2004). Saadatmanesh (1994, 1996) found that the strength and
1
PhD Student
2
ductility of bridge concrete columns can be significantly increased by wrapping FRP strips around the columns due to the concrete confinement and prevention of the buckling of longitudinal reinforcement bars.
To assess the efficacy of the partial wrapping technique, 108 prototypes of reinforced concrete (RC) columns were confined by distinct CFRP arrangements and tested under direct compression. The experimental program was designed to evaluate the influence of the concrete strength class, the stiffness of the wet lay-up CFRP sheet, the distance between strips, the width of the strip, and the number of layers per each strip. The present work describes the experimental program and analyses the main obtained results, especially those related to the load carrying capacity and deformation capacity of the tested RC elements, provided by the considered confinement arrangements.
The Lam and Teng (2003) analytical model was adopted to predict the compression stress-strain behaviour of the RC elements partially confined. Some of the parameters of this model were calibrated from the results obtained in the present experimental program.
2. CONFINEMENT ARRANGEMENTS AND EXPERIMENTAL PROGRAM
The experimental program deals with direct compression tests with reinforced concrete column elements of 600 mm length and 200 mm diameter. This program is composed by several groups of tests in order to evaluate the influence of the following parameters on the compressive strength and deformation capacity of RC elements submitted, predominantly, to compression loading: concrete strength class (two compressive strengths, 16MPa and 32MPa); stiffness of the confinement CFRP system (two CFRP sheets, one of 300 g/m2 of fibers and the other of 200 g/m2 of fibers); width (W) and spacing (s’) of the CFRP strips; number of CFRP layers per strip (L); percentage of the longitudinal, ρsl, and transversal, ρst, steel reinforcement ratio. Due to lack of space, only the groups of tests C32S200Φ8 and C32S300Φ8, indicated in Table 1, are analyzed in the present paper. In this designation, C32 means specimens of a concrete of average compressive strength of 32 MPa, while S200 and S300 indicate the type of CFRP sheet, 200 g/m2 and 300 g/m2, respectively. Finally, Φ8 indicates the diameter, in mm, of the steel longitudinal bars.
One group was confined with a CFRP sheet of 300 g/m2 of fibers, with the tradename of CF130 S&P 240, while the specimens of the other group were confined with a CFRP sheet of 200 g/m2 of fibers, with the tradename of CF120 S&P 240.
Table1 – Experimental program
200mm
600
mm
4Ø8 Ø6//0.096
CFRP w
s'
SG1
SG2
200mm
60
0mm
SG1
W [mm] Designation s’ [mm] W [mm] Designation
W45S6L3 45
W45S6L5
55 W600S1L3
W60S6L3 60
W60S6L5
40
600
W600S1L5
Concrete of average compressive strength: 32 MPa
Longitudinal bars: φ8
CF130 S&P 240 (300 gm/m2) C32S300φ8 Type of CFRP sheet CF120 S&P 240 (200 gm/m2
) Group of test series C32S200φ8
W45S6 W60S6 W600S1 Figure 1 - Confinement arrangements
3. MATERIALS
The CFRP sheets used have the trade name of Mbrace CF-130 (300 g/m2 of fibers) and CF-120 (200 g/m2 of fibers). According to the supplier, CF-130 and CF-120 sheets have a thickness of 0.176 mm and 0.117mm, respectively, and have a tensile strength higher than 3700 MPa, and an elasticity modulus and an ultimate strain in the fibre direction of about 240 GPa and 15‰, respectively, (degussa 2003). To check to values of these properties, samples of CFRP were tested according to ISO recommendations (2003), see Barros and Ferreira (2005). The obtained results are presented in Table 2. The values determined experimentally for the thickness, included in Table 2, were used in the evaluation of the elasticity modulus and tensile strength of the CFRP sheets.
Table 2 – CFRP properties (average of five tests)
CFRP Sheets Thickness (mm)
Tensile strength (MPa)
Ultimate strain (%)
Elasticity modulus (GPa)
CF120 0.113 3535 1.52 232
CF130 0.176 3070 1.33 230
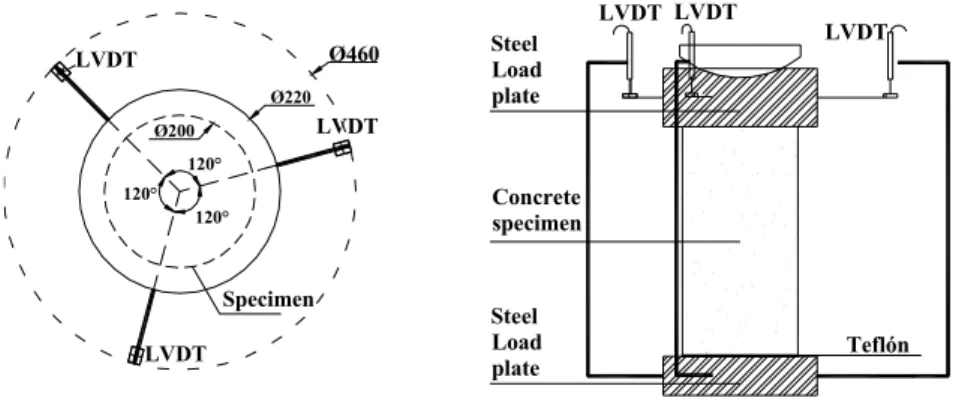
4. TEST SETUP
Three displacement transducers were positioned at 120 degrees around the specimen and registered the displacements between the steel load plates of the equipment (see figure 2). This test setup avoids that the deformation of the test equipment is added to the values recorded by the LVDTs. Taking the values registered in these displacement transducers, the displacement at the specimen axis was determined for each scan reading (Ferreira and Barros 2004), and the corresponding strain was obtained dividing this displacement by the measured specimen’s initial height. To decrease the restriction imposed by the machine load plates to the radial expansion of the specimen’s extremities, a system of two sheets of teflon with oil between them was applied in-between the bottom plate of the test machine and the bottom specimen’s extremity. The Teflon system was not applied in-between the top plate and the top specimen’s extremity, since this plate was connected to a spherical steel hinge. Strains in the CFRP fiber direction were measured by strain gauges (SG1 and SG2) fixed on the specimen according to the arrangements indicated in the figures into Table 1. A detailed description of the test equipment and test procedures can be found elsewhere (Ferreira and Barros 2004).
120° 120° 120°
Ø220 Ø200
Specimen
LVDT Ø460
LVDT
LVDT
Concrete specimen
Steel Load plate
LVDT LVDT
LVDT Steel
Load plate
Teflón
5. EXPERIMENTAL RESULTS
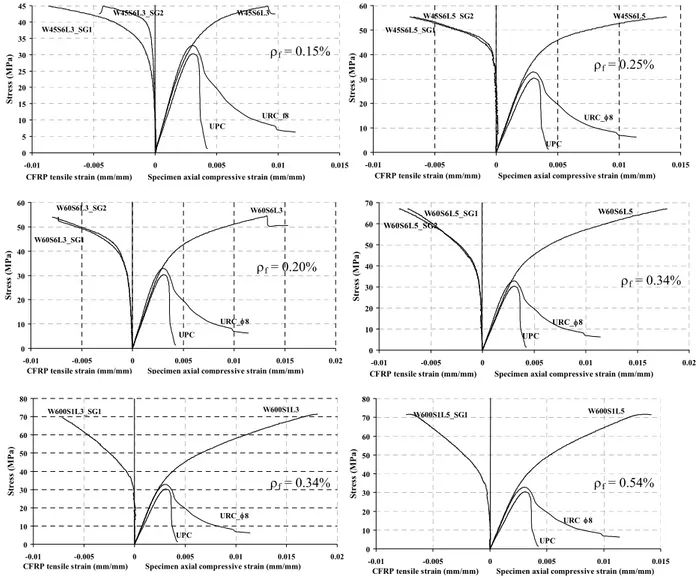
Figures 3 and 4 show the relationships between concrete stress and both the concrete axial strain and the CFRP strain in the fiber direction for the groups of tests C32S200Φ8 and C32S300Φ8 confined with strips of 45 mm, 60 mm and 600 mm of width. Each curve represents the average response registered in the two specimens that compose each series. The concrete stress is the ratio between the applied load and the specimen cross section.
In these figures, UPC represents the unconfined plain concrete specimens, URC_φ8 the unconfined reinforced (longitudinally and transversally) concrete specimens. In each graph, the CFRP confinement ratio is also included, where ρf = Af/Ac,t, with
Af = 2×S×W×L×tf mm2 being the cross sectional area of the confinement system (tf is the
thickness of the CFRP sheet), and Ac,t is the area of specimen longitudinal cross section
(Ac,t = 200×600 mm2). In general, the stress-strain relationship of the confined specimens is
composed by two quasi-linear branches, connected by a nonlinear transition branch.
0 5 10 15 20 25 30 35 40 45
-0.01 -0.005 0 0.005 0.01 0.015
CFRP tensile strain (mm/mm) Specimen axial compressive strain (mm/mm)
S tr ess ( M Pa) UPC URC_f8 W45S6L3 W45S6L3_SG2 W45S6L3_SG1 0 10 20 30 40 50 60
-0.01 -0.005 0 0.005 0.01 0.015
CFRP tensile strain (mm/mm) Specimen axial compressive strain (mm/mm)
S tr ess (M P a ) UPC
URC_φ8 W45S6L5_SG1
W45S6L5 SG2 W45S6L5
0 10 20 30 40 50 60
-0.01 -0.005 0 0.005 0.01 0.015 0.02
CFRP tensile strain (mm/mm) Specimen axial compressive strain (mm/mm)
S tr ess ( M Pa ) W60S6L3_SG1 W60S6L3_SG2 W60S6L3 UPC
URC_φ8
0 10 20 30 40 50 60 70
-0.01 -0.005 0 0.005 0.01 0.015 0.02
CFRP tensile strain (mm/mm) Specimen axial compressive strain (mm/mm)
Str es s ( M P a ) UPC URC_φ8
W60S6L5 W60S6L5_SG2 W60S6L5_SG1 0 10 20 30 40 50 60 70 80
-0.01 -0.005 0 0.005 0.01 0.015 0.02
CFRP tensile strain (mm/mm) Specimen axial compressive strain (mm/mm)
Str es s (M P a ) UPC
URC_φ8
W600S1L3_SG1 W600S1L3 0 10 20 30 40 50 60 70 80
-0.01 -0.005 0 0.005 0.01 0.015
CFRP tensile strain (mm/mm) Specimen axial compressive strain (mm/mm)
S tr ess ( M Pa) UPC URCφ8
W600S1L5_SG1 W600S1L5
Figure 3 - Test group C32S200φ8.
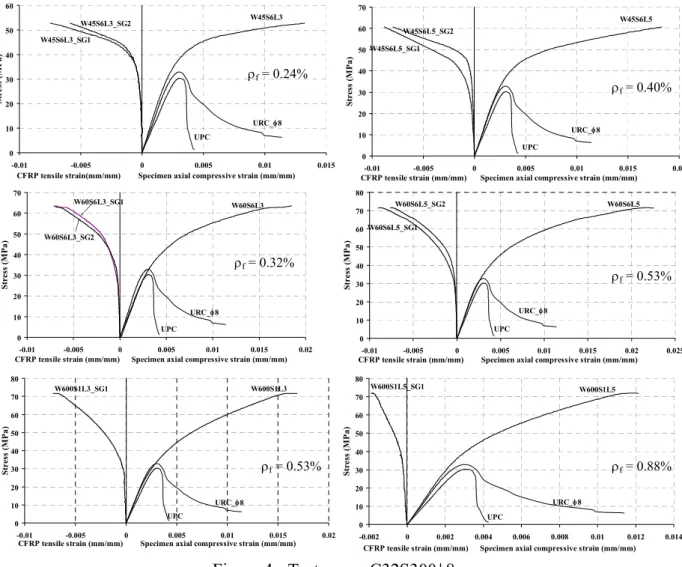
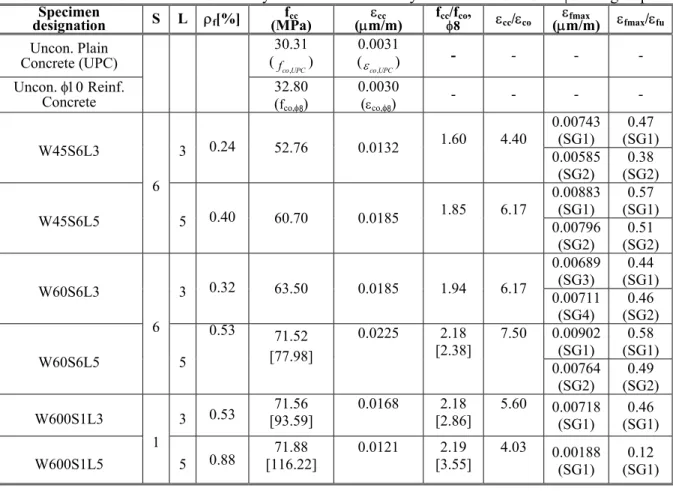
Tables 3 and 4 include de main indicators of the efficacy provided by the applied confinement arrangements. In these tables, fco,UPC and fco,φ8 are the compressive strength of
UPC and URC_φ8 specimens, respectively, εco,UPC and εco,φ8 are the specimen axial strain at
ρf = 0.15%
ρf = 0.25%
ρf = 0.20%
ρf = 0.34%
fco,UPC and fco,φ8, respectively, fcc is the maximum compression stress of the confined
specimens, εcc is the confined-specimen axial strain at fcc, εfmax is the maximum tensile strain
in the CFRP fiber’s direction and εfu is the CFRP failure strain indicated in Table 2. Each
value of Tables 3 and 4 is the average of the values obtained in the two specimens of each series. 0 10 20 30 40 50 60
-0.01 -0.005 0 0.005 0.01 0.015
CFRP tensile strain(mm/mm) Specimen axial compressive strain (mm/mm)
S tr ess ( M Pa) UPC
URC_φ8 W45S6L3_SG1 W45S6L3_SG2 W45S6L3 0 10 20 30 40 50 60 70
-0.01 -0.005 0 0.005 0.01 0.015 0.02
CFRP tensile strain (mm/mm) Specimen axial compressive strain (mm/mm)
S tr ess ( M P a ) UPC
URC_φ8
W45S6L5 W45S6L5_SG1 W45S6L5_SG2 0 10 20 30 40 50 60 70
-0.01 -0.005 0 0.005 0.01 0.015 0.02
CFRP tensile strain (mm/mm) Specimen axial compressive strain (mm/mm)
Stres s (M P a ) UPC URC_φ8
W60S6L3 W60S6L3_SG1 W60S6L3_SG2 0 10 20 30 40 50 60 70 80
-0.01 -0.005 0 0.005 0.01 0.015 0.02 0.025
CFRP tensile strain (mm/mm) Specimen axial compressive strain (mm/mm)
St re ss ( M P a ) UPC URC_φ8
W60S6L5 W60S6L5_SG2 W60S6L5_SG1 0 10 20 30 40 50 60 70 80
-0.01 -0.005 0 0.005 0.01 0.015 0.02
CFRP tensile strain (mm/mm) Specimen axial compressive strain (mm/mm)
S tr ess ( M Pa) UPC
URC_φ8 W600S1L3 W600S1L3_SG1 0 10 20 30 40 50 60 70 80
-0.002 0 0.002 0.004 0.006 0.008 0.01 0.012 0.014
CFRP tensile strain (mm/mm) Specimen axial compressive strain (mm/mm)
St re ss (M P a ) UPC
URC_φ8 W600S1L5 W600S1L5_SG1
Figure 4 - Test group C32S300φ8.
The load carrying capacity of the test equipment was attained in the W600S1L5 series of C32S200Φ8 group and in the W60S6L5, W600S1L3 and W600S1L5 series of C32S300Φ8 group, without the occurrence of the rupture of the specimens. Since the load carrying capacity of equipment can be doubled if the tests are carried out in a non-closed loop control, the specimens of these series were again tested, up to its failure, and the attained fcc values are
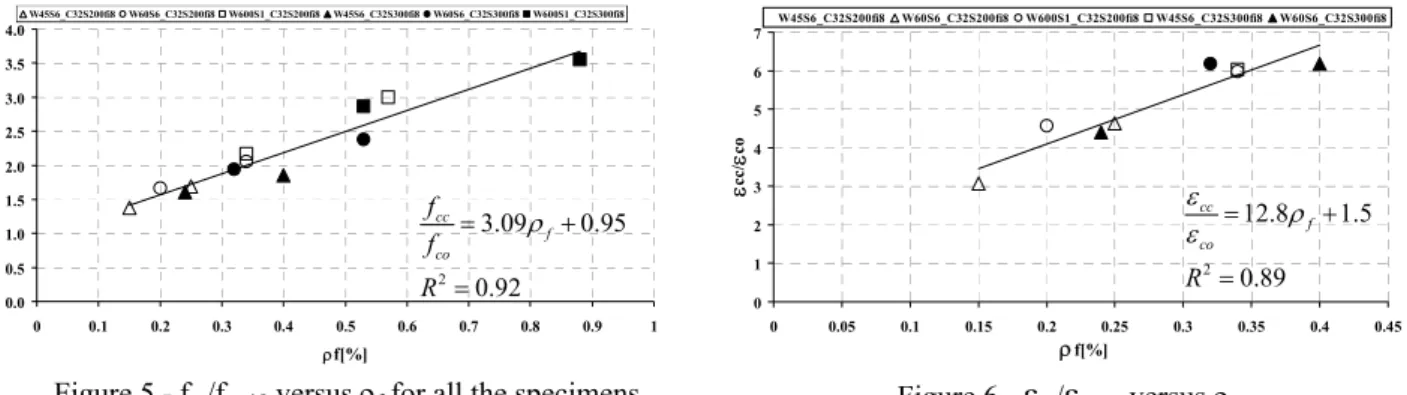
indicated in Tables 3 and 4, in square brackets. The relationship between the normalized strength of the confined specimens (fcc/fco) and ρf, represented in Figure 5, shows a linear
increasing trend between these two parameters. In this figure, the fcc corresponds to the
compressive strength at the failure of the specimens. Figure 6 shows that εcc/εco has also a
linear increase trend with the increase of ρf. Since in the manually controlled tests the strains
were not measured, this figure only includes the results obtained in the specimens that failed when the tests were carried out under closed loop control.
ρf = 0.24%
ρf = 0.40%
ρf = 0.32%
ρf = 0.53%
0.0 0.5 1.0 1.5 2.0 2.5 3.0 3.5 4.0
0 0.1 0.2 0.3 0.4 0.5 0.6 0.7 0.8 0.9 1
ρf[%]
fc
c/
fco
W45S6_C32S200fi8 W60S6_C32S200fi8 W600S1_C32S200fi8 W45S6_C32S300fi8 W60S6_C32S300fi8 W600S1_C32S300fi8
0 1 2 3 4 5 6 7
0 0.05 0.1 0.15 0.2 0.25 0.3 0.35 0.4 0.45
ρf[%]
ε
cc/
ε
co
W45S6_C32S200fi8 W60S6_C32S200fi8 W600S1_C32S200fi8 W45S6_C32S300fi8 W60S6_C32S300fi8
Figure 5 - fcc/fco,φ8 versus ρf for all the specimens Figure 6 - εcc/εco,φ8 versus ρf
In series of equal ρf, such is the case of series W60S6L5 and W600S1L3, the confinement was a little bit more effective in the specimens fully wrapped, but the time consumed in the confinement procedures was higher and the failure modes were more violent. The last column of Tables 3 and 4 shows that, at the failure of the specimens, which always occurred by the CFRP tensile rupture, the maximum tensile strain in the direction of the fibers, εfmax, varied from 27% up to 85% of the CFRP ultimate tensile strain, εfu. These values
are just for specimens that have failed up to the load carrying capacity of the equipment working in closed-loop control. As Lam and Teng, (2003) have already reported, the variation of the strain field in CFRP depends considerably on the distribution of the damage in the concrete specimen. Taking this into account and considering that only one or two strain gauges were applied, per specimen, for recording the CFRP strain variation, it is not surprising that a tendency was not determined for the εfmax/εfu ratio. A high scatter was
registered on the maximum strain values in the CFRP, since the recorded values only represent the areas where the strain gauges are placed, and are too dependent on specimen failure mode configuration.
Table 3 - Main indicators of the efficacy of the confinement systems in the C32S200φ8 test group.
Specimen
designation S L ρf[%] (MPa) fcc (µm/m) εcc fccφ/f8co, εcc/εco (µεm/m) fmax εfmax/εfu Uncon. Plain Concrete
(UPC)
30.31 (fco,UPC)
0.0031 (εco,UPC)
- - - -
Uncon. φ10 Reinf.
Concrete 32.80 (fco,φ8)
0.0030 (εco,φ8)
- - - -
0.00867 (SG1)
0.56 (SG1)
W45S6L3 3 0.15 44.80 0.0092 1.37 3.07 0.00422
(SG2) 0.27 (SG2) 0.00702 (SG1) 0.45 (SG1) W45S6L5 6
5 0.25 55.36 0.0139 1.69 4.63 0.00672 (SG2) 0.43 (SG2) 0.00731 (SG1) 0.47 (SG1)
W60S6L3 3 0.20 54.37 0.0137 1.66 4.57 0.00822
(SG2) 0.53 (SG2) 0.00721 (SG1) 0.47 (SG1) W60S6L5 6
5 0.34 67.09 0.0179 2.05 5.97 0.00804 (SG2)
0.52 (SG2)
W600S1L3 3 0.34 71.37 0.0181 2.17 6.03 0.0131 (SG1) (SG1) 0.85
W600S1L5
1
5 0.57 [98.36] 71.51 0.014 [3.0] 2.18 4.67 0.00735 (SG1) (SG1) 0.47
2 12.8 1.5 0.89 cc f co R ε ρ
ε = +
Table 4 - Main indicators of the efficacy of the confinement systems in the C32S300φ8 test group. Specimen
designation S L ρf[%] (MPa) fcc (µm/m) εcc fccφ/f8co, εcc/εco (µεm/m) fmax εfmax/εfu Uncon. Plain
Concrete (UPC)
30.31 (
,
co UPC
f )
0.0031 (
,
co UPC
ε ) - - - -
Uncon. φ10 Reinf. Concrete
32.80 (fco,φ8)
0.0030 (εco,φ8)
- - - -
0.00743 (SG1)
0.47 (SG1)
W45S6L3 3 0.24 52.76 0.0132 1.60 4.40 0.00585
(SG2)
0.38 (SG2) 0.00883
(SG1)
0.57 (SG1) W45S6L5
6
5 0.40 60.70 0.0185 1.85 6.17 0.00796 (SG2)
0.51 (SG2) 0.00689
(SG3)
0.44 (SG1)
W60S6L3 3 0.32 63.50 0.0185 1.94 6.17 0.00711
(SG4)
0.46 (SG2) 0.00902
(SG1)
0.58 (SG1) W60S6L5
6
5
0.53 71.52
[77.98]
0.0225 2.18 [2.38]
7.50
0.00764 (SG2)
0.49 (SG2)
W600S1L3 3 0.53
71.56 [93.59]
0.0168 2.18 [2.86]
5.60 0.00718 (SG1)
0.46 (SG1)
W600S1L5
1
5 0.88
71.88 [116.22]
0.0121 2.19 [3.55]
4.03 0.00188 (SG1)
0.12 (SG1)
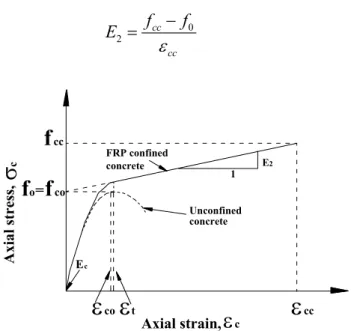
6. ANALITICAL MODEL
To simulate the behavior of concrete specimens fully wrapped with CFRP sheets, submitted to direct compression loading, several analytical models have been proposed Saaman et. al. (1998), Toutanji (1999), Xiao and Wu (2000), Untiveros (2002), Lam and Teng (2003). To simulate the behavior of the partially confined concrete specimens tested in the present work, the model developed by Lam and Teng (2003) was adopted. According to this model, the stress in the confined concrete (σc) is determined by the following expressions (see
Figure 7):
(
)
20 2 2
4 c
c c c c
f E E
Eε ε
σ = − − for 0 ≤εc ≤εt (1)
c
c f Eε
σ = 0 + 2 for εt≤εc ≤εcc (2)
where fo was assumed equal to fco, εt is the strain at the transition between the domain of these
two equations,
(
2)
0
2 E E
f
c
t = −
with E2 being the slope of the equation (2):
0 2
cc
cc
f f
E
ε
−
= (4)
FRP confined concrete
1 2 E
concrete Unconfined
σ
c
Axi
a
l stress,
=
o
f f
f
co cc
Axial strain,
ε
cc E
t
ε
ε
coε
ccFigure 7 – Proposed stress-strain Lam and Tend model for FRP confined concrete. To simulate the behavior of the specimens partially confined, the fcc/fco,φ8-ρf and εcc/εco,φ8-ρf
relationships registered experimentally were used (see Figures 5 and 6):
3.09 0.95
cc
f co
f
f = ρ + for 0.15≤ρf ≤0.88 (5)
12.8 1.5
cc
f co
ε ρ
ε = + for 0.15≤ρf ≤0.34 (6)
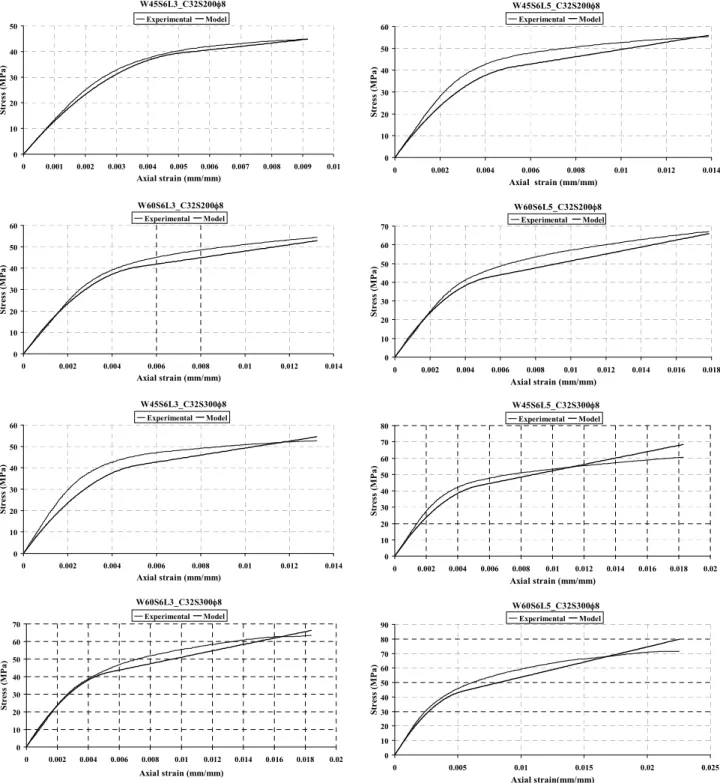
Using the Ec = 14166 MPa obtained from the stress-strain curves of the URC_φ8
specimens, the analytical and experimental stress-strain axial relationships (σc-εc) of the series
of specimens partially confined are compared in Figure 8. For the series confined with CFRP sheets of 200 g/m2 of fibers, the analytical model predicted the experimental stress-strain response with high accuracy, mainly the compressive strength. However, for the series confined with CFRP sheets of 300 g/m2 of fibers, the analytical model shows a tendency of predicting a load carrying capacity higher than the one registered experimentally. Furthermore, in the εt ≤ εc ≤ εcc strain field the experimental σc-εc relationship was not as
W45S6L3_C32S200φ8 0 10 20 30 40 50
0 0.001 0.002 0.003 0.004 0.005 0.006 0.007 0.008 0.009 0.01
Axial strain (mm/mm)
S tr ess ( M Pa ) Experimental Model
W45S6L5_C32S200φ8
0 10 20 30 40 50 60
0 0.002 0.004 0.006 0.008 0.01 0.012 0.014
Axial strain (mm/mm)
S tr ess ( M Pa) Experimental Model
W60S6L3_C32S200φ8
0 10 20 30 40 50 60
0 0.002 0.004 0.006 0.008 0.01 0.012 0.014
Axial strain (mm/mm)
S tr ess ( M Pa ) Experimental Model
W60S6L5_C32S200φ8
0 10 20 30 40 50 60 70
0 0.002 0.004 0.006 0.008 0.01 0.012 0.014 0.016 0.018
Axial strain (mm/mm)
S tr ess ( M Pa) Experimental Model
W45S6L3_C32S300φ8
0 10 20 30 40 50 60
0 0.002 0.004 0.006 0.008 0.01 0.012 0.014
Axial strain (mm/mm)
S tr ess ( M Pa ) Experimental Model
W45S6L5_C32S300φ8
0 10 20 30 40 50 60 70 80
0 0.002 0.004 0.006 0.008 0.01 0.012 0.014 0.016 0.018 0.02
Axial strain (mm/mm)
S tres s (M P a ) Experimental Model
W60S6L3_C32S300φ8
0 10 20 30 40 50 60 70
0 0.002 0.004 0.006 0.008 0.01 0.012 0.014 0.016 0.018 0.02
Axial strain (mm/mm)
S tr ess ( M Pa) Experimental Model
W60S6L5_C32S300φ8
0 10 20 30 40 50 60 70 80 90
0 0.005 0.01 0.015 0.02 0.025
Axial strain(mm/mm) Str es s (M P a ) Experimental Model
Figure 8 – Comparison between analytical model and experimental results for the group of series C32S200φ8 and C32S300φ8.
7. CONCLUSIONS
the thickness of the CFRP were also parameters considered in the experimental program. The RC elements had 200 mm diameter and 600 mm length, were manufactured by concrete of average compressive strength of 32 MPa, were reinforced longitudinally by four steel bars of 8 mm diameter and were confined by steel hoops of 6 mm diameter, spaced at 96 mm.
The experimental results showed that, the load carrying capacity of CFRP-confined elements has a linear increasing tendency with the increase of the CFRP confinement ratio,
f
ρ . The normalized maximum compressive strength (fcc/fco, where fco is the compressive
strength of unconfined elements) varied from 1.37 for ρf=0.15% up to 3.55 for ρf =0.88%. A linear increasing trend was also observed for the εcc/εco-ρf relationship, having εcc/εco ranged
from 3.0 for ρf=0.15% up to 7.5 for ρf =0.53%. For the specimens that, when failed, the strains in the fiber direction of the CFRP were registered, the maximum strain varied from 27% up to 58% of the CFRP ultimate tensile strain. For the specimens of equal ρf, the load carrying capacity of partially confined specimens was a little bit lower than the one of the fully confined specimens. However, partial confinement arrangements were easier and faster to apply than full confinement arrangements.
From the experimental results, two equations were derived, one to evaluate fcc/fco and
the other to determine εcc/εco, both in function of the confinement ratio, ρf. These two
equations, plus the initial concrete Young’s Modulus, provide the basic data of an analytical model used to predict the stress-strain diagrams registered in the partially confined specimens. The accuracy of the simulation was reasonable, but it can be improved if a nonlinear equation was assumed for the phase when plastic deformation occurs in the longitudinal steel bars and/or in the transversal steel hoops. For the sake of simplicity, in the present model a linear relationship was assumed for the fcc/fco-ρf and εcc/εco-ρf. However, the increase ratio of fcc/fco
and εcc/εco should decrease with the increase of ρf. When more data are available, more
accurate fcc/fco-ρf and εcc/εco-ρf functions can be determined, which will improve the
performance of the used analytical model.
8. ACKNOWLEDGMENTS
The authors of the present work wish to acknowledge the generous support provide by MBT Bettor Portugal and S&P Clever Reinforcement. The first author would like to thank the financial support by PRODEP action 5.3/N/199.014/01.
9. REFERENCES
Barros, J.A.O., Ferreira, D.R.S.M., Partial versus full wrapping confinement systems for concrete columns, accepted to be published in the International Conference on Concrete Repair, Rehabilitation and Retrofitting, South Africa, November (2005).
Degussa - Construction Chemicals, in : Technical and commercial document, (2003). Ferreira, D.R.S.M., Barros, J.A.O., Confinamento por cintagem total e parcial de elementos de betão com mantas de fibras de carbono, Technical Report 04-DEC/E-29, Dep. Civil Eng., University of Minho, 165 p., (http://www.civil.uminho.pt/composites), November (2004). In Portuguese.
Lam L., and Teng J.G., Design-oriented stress strain model for FRP-confined concrete, in: Elsevier Construction and building materials, 17, 471-489, (2003).
Saadatmanesh H., Ehsani M.R., Strength and ductility of concrete columns externally reinforced with fiber composite straps, ACI Structural Journal, 91 (4) 434-447, (1994).
Saadatmanesh H., Ehsani M.R., Seismic strengthening of circular bridge pier models with fiber composite, ACI Structural Journal, 93 (6) 639-647, (1996).
Samaan, M., Mirmiran, A., Shahawy, M., Model of concrete confined by fiber composites, Journal of Structural Engineering, ASCE, 124(9), 1025-1031,(1998).
Toutanji, H. A., Stress-strain characteristics of concrete columns externally confined with advanced fiber composites sheets, ACI Material Journal, 96(3), 397-404, (1999).
Untiveros, C. M. A., Estudio experimental del comportamiento del hormigón confinado sometido a compresión, Tesis doctoral, Barcelona, septiembre, (2002).