a Universidade Federal de Goiás, Goiânia, GO, Brasil.
Received: 31 Mar 2017 • Accepted: 26 Jun 2018 • Available Online: 23 Nov 2018
Analysis of the efficiency of strengthening design
models for reinforced concrete columns
Análise da eficiência de modelos para dimensionamento
do reforço em pilares de concreto armado
P. C. RODRIGUES a patriciarodgs@gmail.com
D. L. ARAÚJO a dlaraujo@ufg.br
Abstract
Resumo
This paper develops a comparative analysis of the main design models used for predicting the strengthening of reinforced concrete columns subjected to uniaxial compression. The study evaluated four strengthening design models with concrete jackets and eleven strengthening design
models with wrapping in Carbon Fiber-Reinforced Polymer (CFRP). All models consider the effect of confinement provided by the transverse steel
reinforcement and the CFRP sheet wrapping on the gain in resistance of the column. For the validation, a database was formulated containing 135 experimental results of columns tested by several researches, which was used to analyze all design models and identify which was best for
expressing the behavior of the strengthened column. At the end of the study, one confinement design model with transverse reinforcement and eleven design models with confinement provided by CFRP sheet wrapping and transverse steel reinforcement which showed the best resistance
predictions were selected.
Keywords: strengthening, confinement, carbon fibers, concrete jacketing, design models.
Este trabalho desenvolve uma avaliação comparativa dos principais modelos empíricos de dimensionamento utilizados no reforço de pilares
de concreto armado submetidos a carregamento axial centrado. Foram avaliados quatro modelos de confinamento por armaduras transver
-sais, utilizados no dimensionamento do reforço por aumento de seção transversal de concreto, e onze modelos para o dimensionamento do
reforço por encamisamento por polímero reforçado com fibras de carbono. Todos eles consideram o efeito do confinamento, proporcionado
pela armadura transversal e pelo reforço com fibras, no ganho de resistência do pilar. Para a validação, foi montado um banco de dados con
-tendo 135 pilares ensaiados em diversas pesquisas, ao qual foram aplicados os modelos em análise de modo a identificar aqueles que melhor expressam o comportamento do pilar reforçado. Ao final do trabalho, foi selecionado um modelo de confinamento por armadura transversal e onze combinações entre modelos de confinamento por fibras de carbono e armadura transversal que conduziram às melhores previsões de resistência dos pilares do banco de dados.
1. Introduction
Reinforced concrete structures are designed and built to withstand the stresses imposed throughout their life cycles. Occasionally, however, in the case of constructive defects or accidents, the
con-structions require retrofitting to improve their structural strength,
increase their load capacity, expand their life cycles, or change the function of the building. This show the importance of developing adequate strengthening design models for concrete structures to guarantee their technical and economic viability.
Among the strengthening techniques for concrete structures, the use of concrete jackets and Carbon Fiber-Reinforced Polymer (CFRP) sheets is highlighted. In recent years, these techniques
have been heavily used in columns, significantly increasing their
load capacity.
Strengthening with a concrete jacket involves wrapping the column in a concrete layer. According to Takeuti [1], transverse and longi-tudinal steel reinforcements can be added to the concrete jacket, improving the column resistance for loads. In the case of strength-ening by wrapping with CFRP, the column is surrounded by a
com-posite material formed by carbon fibers filled with epoxy resin. Both techniques are effective, and it is necessary to carry out adequate
studies of cost, availability of trained labor, and impact on the lay-out of the building to evaluate the most adequate solution.
The literature contains several design methods to evaluate the gain resistance of strengthened columns. However, since these
models are mostly empirical, there is significant variability in the
coefficients suggested by different authors. Moreover, the varia
-tion in the results of design models is due to the different consid
-erations adopted by each author. Therefore, different amounts of
reinforcement and CFRP sheet wrapping are obtained.
Thus, the main objective of this paper is to compare the com-mon design models available in the literature. For this purpose, they were applied to a database with 135 columns tested in the laboratory and the models that achieved the highest
ef-ficiency were selected to represent the results of tests by
means of statistical inference analysis. To evaluate strength-ening with a concrete jacket, the design models proposed by Cusson and Paultre [2], Saatcioglu and Razvi [3], Frangou et
al. [4], and the fib Model Code 2010 [5] were used. With re
-gard to strengthening with CFRP sheet wrapping, 11 em-pirical models available in the literature were evaluated.
2. Strengthening models for reinforced
concrete columns
The capacity of strengthened concrete columns subjected to uniaxial compression is calculated from the sum of resistances of concrete and steel reinforcement in the longitudinal direction. However, several researches showed the importance of the
con-finement by a concrete jacket for the capacity of the strengthened
concrete columns.
According to Carrazedo [6], when the columns are loaded by longi-tudinal loads, they show lateral expansion because of the Poisson
coefficient. However, when the columns are laterally restrained, tri
-axial compression stresses are induced, generating a gain in
longi-tudinal resistance in the element. The confinement can be induced
by CFRP sheet wrapping or transverse steel reinforcement. This paper considers that in the columns wrapped by CFRP, the
confinement is provided by both the transverse reinforcement and
the CFRP sheet wrapping. For columns strengthened with
con-crete jackets, the confinement is provided by both transverse steel
reinforcement in the concrete core and transverse steel reinforce-ment in the concrete jacket.
2.1 Confinement due to transverse
steel reinforcement
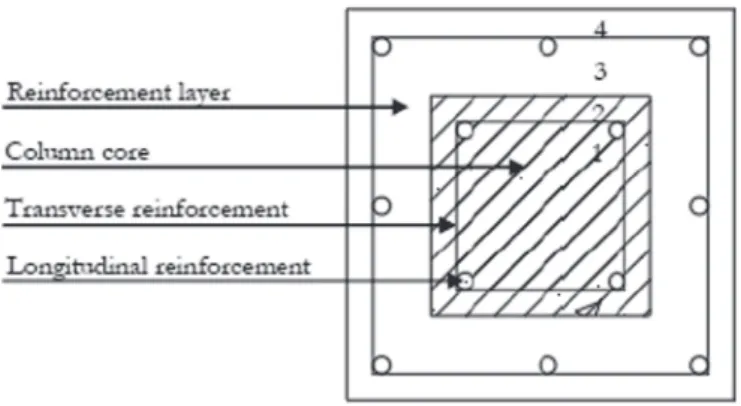
The basic principle of strengthening with a concrete jacket is that the resistance of the strengthened column is due to the concrete and the longitudinal steel present in the core and in the concrete jacket. Takeuti [1] adds that the transverse steel reinforcement in
Figure 1
Column region that is confined by transverse reinforcement.. (a) Cross-section of circular confined
columns; (b) Cross-section of rectangular confined columns; (c) Longitudinal section of confined
columns (confinement between stirrups)
Source: Adapted from Cusson and Paultre [2]
(c)
(b)
the core and in the concrete jacket ensures the confinement of the
column, which consequently increases the strength of column. The four design models analyzed considered that there is an
inter-nal area of the concrete core defined by the transverse reinforce
-ment which is effectively confined, as shown in the hatched area in Figure 1. In circular columns, the confined area of the concrete
core is the same as the edge of the transverse steel reinforcement. In columns with square or rectangular sections, there is an
arch-ing action of the confinarch-ing stress due to transverse reinforcement,
generating stress peaks in the corners where the transverse rein-forcement meets the longitudinal reinrein-forcements. The part of the
section outside the confined area is considered as concrete cover
and does not contribute to the strength of the column [2–4]. Takeuti [1] and Carrazedo [6] point out that cracking and spalling of concrete cover can happen with the application of axial loading on the column. Therefore, these authors recommend disregarding the concrete cover external to the transverse reinforcement.
2.1.1 Cusson and Paultre model
Based on experimental tests, Cusson and Paultre [2] defined a re
-lationship between the strength gain of confined concrete and the effective confinement index (fle/fc) defined from the nominal lateral
pressure of transverse reinforcement, which is given by Equation (1):
(1)
where:
fcc is the compressive strength of confined concrete,
fc is the compressive strength of the original concrete, fle is the nominal lateral pressure.
The authors adopt a confinement effectiveness coefficient, Ke, for a
rectangular cross-section, which was evaluated by Mander, Priest-ley, and Park [7] as follows:
with:
(2)
where:
fl is the lateral pressure of transverse reinforcement,
wi is the clear spacing between adjacent longitudinal steel bars, cx and cy are the dimensions of the column core perpendicular to the directions x and y, respectively, measured between centers of the transverse reinforcements,
s' is the clear spacing of stirrups,
ρl is the longitudinal reinforcement ratio in the core section.
Mander, Priestley, and Park [7] also establish the coefficient of confine
-ment effectiveness Ke for circular columns reinforced with conventional
stirrups and with spirals according to Equations (3) and (4), respectively.
(3)
(4)
where:
di is the diameter of circular stirrups or spiral between bar centers,
The lateral confining stress on the concrete for rectangular col -umns is obtained from Equation (5):
(5)
where:
fy,t is the yield strength of transverse reinforcement,
As,tx and As,ty are the total areas of the transverse reinforcement parallel to the y-axis and x-axis, respectively, corresponding to twice the cross-sectional area of the stirrups,
s is the center-to-center spacing between stirrups.
Cusson and Paultre [2] do not evaluate the lateral confining stress
on the concrete for circular columns.
2.1.2 Saatcioglu and Razvi’s model
The second model analyzed was proposed by Saatcioglu and
Raz-vi [3] and was based on the same confinement principle as was used by Cusson and Paultre [2]. The difference lies in the empirical
correlation between the variables.
The gain in concrete strength is evaluated as a function of the nominal lateral pressure by Equation (6).
(6)
The nominal lateral pressure is given by:
with:
for rectangular sections,
for circular sections.
(7)
and the lateral pressure of transverse reinforcement is given by Equation (8).
(8)
where:
bc is the distance between the centers of the longitudinal bars, As,t is the area of the transverse reinforcement,
θ is the angle between the transverse reinforcement and bc and is
equal to 90° for rectangular columns.
2.1.3 Model of Frangou et al.
Frangou et al. [4] proposed a model to evaluate the strength of
confined concrete based on Eurocode 8 (CEN [8]) recommenda
-tions. This model differs from the others in that it considers the gain resistance of concrete as a function of its mechanical confinement
rate ωw, as shown in Equations (9) and (10).
(9)
where:
α' is a reduction factor, calculated from Equation (11),
d is the diameter of the concrete section confined by the stirrups. To evaluate the effective confinement on the column, Eurocode 8
(CEN [8]) uses a reduction factor α' given by:
(11)
where:
As,l is the total area of longitudinal reinforcement of the column.
2.1.4 fib Model Code
The fib Model Code 2010 [5] determines the gain resistance of the
transverse reinforced confined column from Equation (12):
(12)
The nominal lateral confinement pressure for circular and rectangu
-lar cross-sections is given by Equations (13) and (14), respectively.
(13)
with: (14)
2.2 CFRP confinement models
The design models for confinement with CFRP sheet wrapping are
based on the same confinement principles as are used for confine
-ment with steel reinforce-ment. The load capacity of the column is
Table 1
Expressions for evaluating the compressive strength of confined concrete with FRP
Reference Confinement type fcc
Samaan et al. [10] GFRP
Miyauchi et al. [11] CFRP
Kono et al. [12] CFRP
Toutanji [13] CFRP GFRP
Saafi et al. [14] CFRP GFRP
Spoelstra and Monti [15] CFRP GFRP
Fardis and Khalili [16] GFRP
Karbhari and Eckel [17] CFRP GFRP AFRP
Mirmiran and Shahawy [18] GFRP
Shehata, Carneiro, and Shehata [19] CFRP
guaranteed by the strength of the confined concrete and the longi -tudinal steel of the core.
There are several researches in the literature about the confine
-ment of concrete by CFRP sheet wrapping. Table 1 lists some of empirical models that were analyzed in this paper, which depend of
the strength of confined concrete. On the other hand, the strength of confined concrete as a function of the strength of the existing
concrete and the lateral pressure from the CFRP sheet wrapping and can be calculated from Equation (15).
for circular columns
for rectangular columns
(15)
where:
fl,f is the lateral pressure from the CFRP sheet wrapping, n is the number of CFRP sheets,
tf is the thickness of the CFRP sheet, ff is the tensile strength of the CFRP sheet,
ka is the confinement effectiveness coefficient. For circular col
-umns, it is considered to be full confinement, that is, ka = 1.0,
D is the diameter of the circular columns,
b and h are the width and height of the cross-section of the rectan-gular columns, respectively.
Note from Equation (15) that lateral pressure in the column de-pends on the tensile strength of the CFRP sheet, which is directly
influenced by several properties of the FRP (Fiber Reinforced
Polymers), such as the modulus of elasticity and deformation of
fibers, thickness, and number of FRP layers. Several researches
have carried out tests to propose expressions that already include these basic parameters for the main types of commercialized FRP systems, that is, CFRP, GFRP (Glass Fiber Reinforced Polymers), and AFRP (Aramid Fiber Reinforced Polymers). Thus, the
expres-sions obtained from tests with other types of fibers can also be efficiently applied in the calculation of the confinement with CFRP
sheets and are included in Table 1.
The expressions in Table 1 were obtained from tests with col-umns strengthened only with FRP sheets, without transverse or
longitudinal reinforcements. Thus, they depend only on the lateral pressure due to the FRP jacket. For columns strengthened with CFRP sheets and transverse reinforcement, the equations shown
in Table 1 can be associated with the confinement models with
transverse reinforcement described in Subsection 2.1, as shown in Figure 2 and discussed in the next section.
2.3 Models for evaluation of confinement
with transverse reinforcement and FRP
sheet wrapping
The confinement of the concrete core of columns with transverse
reinforcement is well-known. However, there are still doubts about the interaction between FRP sheet wrapping and transverse
rein-forcement used to confine the concrete core of columns. Carraze
-do [6] considers that the interaction of FRP sheets and transverse
reinforcement in the confinement of concrete can be evaluated by
adding the strength gain obtained for each strengthening system
individually. That is, initially the transverse reinforcement confines
the concrete of the column and offers a resistance gain of fcc,e.
Subsequently, the FRP sheet wrapping provides a resistance gain of fcc,f to the unconfined concrete core. The total resistance of the
confined concrete is given by Equation (16):
(16)
Another proposal that considered this interaction was presented by Machado [9] and was based on the recommendations of ACI 440.
According to this author, the strength of the confined concrete of
the reinforced column can be evaluated from an empirical equation that considers the lateral pressure generated by the strengthen-ing system and the strength of the original concrete, as shown in Equation (17).
(17)
This formulation is based on the hypothesis that the total lat-eral pressures on the column are due to the sum of the latlat-eral
Figure 2
Effectively confined area of column. (a) Confinement with CFRP; (b) Confinement with transverse reinforcement.
Source: Modified from Machado [9]pressures of the different strengthening systems, that is, FRP
sheet wrapping and transverse reinforcement, as shown in Figure 3. Then, the total lateral pressure fl is calculated from Equation
(18), in a different procedure from Equation (16), which evalu
-ates the strength of confined concrete independently from each
strengthening system.
(18)
where:
fl,e is the lateral pressure from the transverse reinforcement, fl,f is the lateral pressure from the CFRP sheet wrapping.
The lateral pressures from the CFRP sheet wrapping and the transverse reinforcement are evaluated by Equations (15) and (19), respectively. In circular sections, the pressure distribution is uniform, while the lateral pressure is proportional to the cross-sec-tional dimensions of the rectangular column.
(19)
where:
kb is the coefficient of confinement effectiveness,
Full confinement of circular columns section is considered, thus
kb = 1.0. For rectangular columns, Machado [9] uses Equation (20)
to evaluate the confinement effectiveness coefficients ka and kb
re-quired in Equations (15) and (19).
(20)
where:
ρt is the ratio between transverse reinforcement and the column section area,
Ag is the cross-sectional area of the column.
3. Analysis of design models
for strengthening of reinforced
concrete columns
The analysis of the design models described was done using a da-tabase of 135 columns that have been tested and are available in the literature. The design models shown in Section 2 were applied to this database and the results were compared to the resistance gain observed in the experimental tests. The analysis was subdi-vided into two parts, that is, strengthening with a concrete jacket and strengthening with CFRP sheet wrapping. Later, strengthening with both transverse reinforcement and CFRP sheet wrapping was also analyzed.
3.1 Strengthening with concrete jacket
A set of four columns tested by Takeuti [1] was used to evaluate
the efficiency of the design models for predicting the resistance
of reinforced columns strengthened with concrete jackets. All col-umns had an original square cross-section of 15 × 15 cm and were placed in concrete jackets of either 3 or 4 cm thick. Longitudinal and transverse reinforcements were added to the core and con-crete jacket, as shown in Figure 4. The database for this strength-ening system is small since there are few studies in the literature on reinforcement by wrapping with a concrete jacket.
The four design models for evaluating the confinement with trans
-verse reinforcement were applied to this database. The strength of the column with the concrete jacket was determined by adding the strength of longitudinal reinforcements to the strength of concrete
Figure 3
Lateral pressure due to CFRP sheet wrapping. (a) Circular columns; (b) Rectangular columns
Source: Modified from Machado [9]shown in Regions 1, 2, and 3 in Figure 4. Region 4, which is ex-ternal to the transverse reinforcement, was disregarded. Only the
cross-section of the original column was considered to be confined by the transverse reinforcement. Region 1 was confined due to
transverse reinforcement placed on the concrete core and on the
concrete jacket, while Region 2 was confined only by the trans
-verse reinforcement placed on the concrete jacket.
Table 2 shows the comparison between the strength predicted by each model and the strength obtained experimentally for each column. It is observed that, on average, all models predicted val-ues within the acceptable range for safety , that is, valval-ues for the ratio of maximum theoretical strength to maximum experimental strength (Fu,theor ⁄ Fu,exp) smaller than one. In addition, all models
showed similar effectiveness, although different expressions were used, with an average difference of 10% from values obtained in
the tests.
3.2 Strengthening with CFRP sheet wrapping
Several tests of strengthening of reinforced concrete columns with CFRP have been presented in the literature. Three situations shown
in Figure 5 were analyzed. Initially, the confinement models with
CFRP sheet wrapping (Table 1) were applied to columns that were wrapped with FRP and without transverse reinforcement. Then, the
confinement models with transverse reinforcement shown in Sub
-section 2.1 were applied to circular columns with transverse rein-forcement and without the presence of the CFRP sheet. The results
Figure 4
Cross-sectional area of column strengthened with
concrete jacket
Table 2
Comparison between the design models for strengthening with concrete jacket Δ = F
u,theor/F
u,expModel Fu,exp
(kN)
Cusson and Paultre [2] Saatcioglu and Razvi [3] Frangou et al. [4] fib Model Code 2010 [5]
Fu,theor
(kN) Δ
Fu,theor
(kN) Δ
Fu,theor
(kN) Δ
Fu,theor
(kN) Δ
S1C1S 1540 1356 0.88 1394 0.91 1324 0.86 1340 0.87
S1C2S 1749 1276 0.73 1295 0.74 1320 0.75 1259 0.72
S2C1S 1850 1841 0.99 1876 1.01 1813 0.98 1823 0.99
S1C2S 1840 1749 0.95 1765 0.96 1780 0.97 1727 0.94
Mean – – 0.89 – 0.90 – 0.89 – 0.88
CV* – – 0.13 – 0.13 – 0.12 – 0.13
* CV = coefficient of variation
Figure 5
Table 3
Database of reinforced circular columns strengthened with FRP
Reference Column
Dimensions FRP Experimental conditions D (mm) H (mm) λ Fiber type tf (mm) ξf (‰) Ef (MPa) ff (MPa) n fc (MPa) fl (MPa) fcc,exp (MPa)
Carrazedo [6] C1 190 570 12 CFRP 0.130 11.92 218950 2610 1 26.16 3.57 38.81
C2 190 570 12 CFRP 0.130 10.89 218950 2384 2 26.16 6.53 53.08
Shehata, Carneiro, and
Shehata [19]
C1-25a 150 300 8 CFRP 0.165 15.00 235000 3525 1 25.60 7.76 43.90
C2-30a 150 300 8 CFRP 0.165 15.00 235000 3525 1 29.80 7.76 57.00
C1-25b 150 300 8 CFRP 0.165 15.00 235000 3525 2 25.60 15.51 59.60
C2-30b 150 300 8 CFRP 0.165 15.00 235000 3525 2 29.80 15.51 72.10
Samaan et al. [10]
DA11 153 305 8 GFRP 0.240 – – 579.2 6 30.86 10.94 53.66
DA13 153 305 8 GFRP 0.240 – – 579.2 6 30.86 10.94 56.50
DB11 153 305 8 GFRP 0.240 – – 579.2 6 29.64 10.94 67.12
DB12 153 305 8 GFRP 0.240 – – 579.2 6 29.64 10.94 55.29
DB13 153 305 8 GFRP 0.240 – – 579.2 6 29.64 10.94 60.23
DC11 153 305 8 GFRP 0.240 – – 579.2 6 31.97 10.94 59.06
DC12 153 305 8 GFRP 0.240 – – 579.2 6 31.97 10.94 60.79
DA21 153 305 8 GFRP 0.220 – – 579.2 10 30.86 16.71 72.92
DA22 153 305 8 GFRP 0.220 – – 579.2 10 30.86 16.71 65.67
DA23 153 305 8 GFRP 0.220 – – 579.2 10 30.86 16.71 77.99
DB21 153 305 8 GFRP 0.220 – – 579.2 10 29.64 16.71 74.56
DB22 153 305 8 GFRP 0.220 – – 579.2 10 29.64 16.71 93.02
DB23 153 305 8 GFRP 0.220 – – 579.2 10 29.64 16.71 71.77
DC21 153 305 8 GFRP 0.220 – – 579.2 10 31.97 16.71 77.35
DC22 153 305 8 GFRP 0.220 – – 579.2 10 31.97 16.71 77.08
DA31 153 305 8 GFRP 0.212 – – 579.2 14 30.86 22.56 85.72
DA33 153 305 8 GFRP 0.212 – – 579.2 14 30.86 22.56 86.76
DB31 153 305 8 GFRP 0.212 – – 579.2 14 29.64 22.56 86.22
DB32 153 305 8 GFRP 0.212 – – 579.2 14 29.64 22.56 114.66
DB33 153 305 8 GFRP 0.212 – – 579.2 14 29.64 22.56 87.44
DC31 153 305 8 GFRP 0.212 – – 579.2 14 31.97 22.56 86.11
DC32 153 305 8 GFRP 0.212 – – 579.2 14 31.97 22.56 83.99
Eid, Roy, and Paultre [20]
N1 152 300 8 CFRP 0.381 13.40 78000 1045 1 32.10 5.24 39.71
N2 152 300 8 CFRP 0.381 13.40 78000 1045 2 32.10 10.48 57.58
N3 152 300 8 CFRP 0.381 13.40 78000 1045 3 33.60 15.72 74.24
M1 152 300 8 CFRP 0.381 13.40 78000 1045 1 48.00 5.24 59.80
M2 152 300 8 CFRP 0.381 13.40 78000 1045 2 48.00 10.48 80.04
M3 152 300 8 CFRP 0.381 13.40 78000 1045 3 48.00 15.72 99.84
Wang et al. [21]
C1H0L1M 305 915 12 CFRP 0.167 17.79 244000 4340 1 24.50 4.75 35.00
C1H0L2M 305 915 12 CFRP 0.167 17.79 244000 4340 2 24.50 9.51 55.30
C2H0L1M 204 612 12 CFRP 0.167 17.79 244000 4340 1 24.50 7.11 46.10
C2H0L2M 204 612 12 CFRP 0.167 17.79 244000 4340 2 24.50 14.21 65.20
Lee et al. [22]
S0F1 150 300 8 CFRP 0.110 18.04 250000 4510 1 36.20 6.61 41.70
S0F2 150 300 8 CFRP 0.110 18.04 250000 4510 2 36.20 13.23 57.80
S0F3 150 300 8 CFRP 0.110 18.04 250000 4510 3 36.20 19.84 69.10
S0F4 150 300 8 CFRP 0.110 18.04 250000 4510 4 36.20 26.46 85.40
S0F5 150 300 8 CFRP 0.110 18.04 250000 4510 5 36.20 33.07 104.30
Table 4
Comparison between theoretical and experimental results for columns strengthened with FRP
Reference
fcc,theor/fcc,exp
Fardis and Khalili [16] Karbhari and Eckel [17] Mirmiran and Shahawy [18] Miyauchi et al. [11]
Samaan et al. [10]
Saafi et al. [14] Toutanji [13] Spoelstra and Monti [15] Kono et al. [12] Shehata, Carneiro, and Shehata [19]
Mean 0.90 0.96 0.78 1.20 1.04 0.99 1.29 1.01 0.85 0.89
were analyzed to verify the effectiveness of each model separately
to predict the resistance of strengthened concrete columns. Finally, the interaction between the two strengthening systems was inves-tigated in columns with transverse reinforcement and wrapped with FRP. For this purpose, the association between the calculation mod-els presented in Sections 2.1 and 2.2 was investigated.
3.2.1 Columns strengthened only with CFRP
The first analysis considered a database with 43 columns strength
-ened only with FRP (Table 3). The database contained twenty-two columns tested by Samaan et al. [10], two tested by Carrazedo [6], four tested by Shehata, Carneiro, and Shehata [19], six tested by
Eid, Roy, and Paultre [20], four tested by Wang et al. [21], and five
tested by Lee et al. [22]. They were all short columns, with a cir-cular cross-section, a diameter varying between 150 and 305 mm, and concrete compressive strength varying from 24.5 to 48 MPa.
Twenty-one columns were strengthened with glass fibers and twenty-two with CFRP. Table 3 compares the strength of confined
concrete obtained from confinement models with FRP (fcc,theor) with
the values obtained from the experiments (fcc,exp). These columns
did not have longitudinal reinforcement, so their strength was due
only to the strength of confined concrete.
A general view shows that the models of Fardis and Khalili [16],
Karbhari and Eckel [17], Samaan et al. [10], Saafi et al. [14], and
Spoelstra and Monti [15] achieved the best predictions, with an
error of less than 10% compared to the experimental values. The coefficient of variation for all models also remained acceptable at around 12%.
Due to the bigger database, a bilateral paired Student’s t-test was performed. The t-test is used to determine whether two sets of data
are significantly different from each other [25]. The population vari
-ance was unknown and a signific-ance level (α) of 10% was used
for analysis. Table 5 shows the results obtained for the test vari-able (t) and the critical value of this varivari-able (t critical). From this
Table 5
Results of student’s t–test for columns strengthened
with FRP. t-critical = 2.01808
Reference T
Fardis and Khalili [16] 5.57413
Karbahari and Eckel [17] 2.83641
Mirmiran and Shahawy [18] 8.84600
Miyauchi et al. [11] –7.66059
Samaan et al. [10] –0.83592
Saafi et al. [14] 1.08314
Toutanji [13] –11.17020
Spoelstra and Monti [15] –0.10101
Kono et al. [12] 6.71226
Shehata, Carneiro and Shehata [19] 6.08063
Figure 6
Variability of confinement models with FRP
when compared to experimental values
Figure 7
Comparison of theoretical and experimental results of compressive strength of confined concrete (f
cc) due to
confinement with FRP. (a) Samaan’s model; (b) Saafi’s model; (c) Spoelstra’s model. CC: Correlation coefficient;
SD: Standard deviation
(b)
(c)
analysis, it is concluded that only the models of Samaan et al.
[10], Saafi et al. [14], and Spoelstra and Monti [15] are not signifi
-cantly different from the experimental results. Therefore, it is pos
-sible to accept the hypothesis that only these models can predict
a strength of confined concrete equal to the values observed in tests at a significance level of 10% (Figure 6). When comparing the
results predicted by these models with the experimental results for
this data set of columns tested, a correlation coefficient that ranges
from 0.63 to 0.75 is obtained, as shown in Figure 7, and the best correlation is presented by the model of Spoelstra and Monti [15] (Figure 7 (c)).
3.2.2 Columns strengthened only
with transverse reinforcement
The database used for the second analysis contains 25 circular col-umns reinforced with transverse and longitudinal reinforcements
Table 6
Database of reinforced columns confined with transverse reinforcement
Reference Model
Dimensions Longitudinal
reinforcement Transverse reinforcement
Experimental conditions D (mm) H (mm) λ φl (cm) nº fy,l (MPa) Type φt (cm) s (mm) fy,t (MPa) c (cm) fc (MPa) fcc,exp (MPa) Carrazedo [6]
C0S50 190 570 12 0.8 6 554.8 Spirals 0.50 50 756 1.5 26.16 39.44
C0S25 190 570 12 0.8 6 554.8 Spirals 0.50 25 756 1.5 28.86 60.52
Eid, Roy, and Paultre
[20]
C4NP0C 303 1200 16 1.6 6 423 Spirals 1.13 100 456 2.5 31.70 2930
C4N1P0C 303 1200 16 1.6 6 423 Spirals 1.13 100 456 2.5 36.00 3235
C2NP0C 303 1200 16 1.6 6 423 Spirals 1.13 65 456 2.5 31.70 3000
C2N1P0C 303 1200 16 1.6 6 423 Spirals 1.13 65 456 2.5 36.00 3490
Wang et al. [21]
a 500 1500 12 1.6 12 295 Spirals 1.20 52 310 2.5 28.00 38.0
b 500 1500 12 1.6 12 295 Spirals 1.20 52 340 2.5 31.00 48.0
c 500 1500 12 1.6 12 295 Spirals 1.20 52 340 2.5 33.00 47.0
1 500 1500 12 1.6 12 295 Spirals 1.20 41 340 2.5 28.00 51.0
Mander, Priestley, and Park
[7]
2 500 1500 12 1.6 12 295 Spirals 1.20 69 340 2.5 28.00 46.0
3 500 1500 12 1.6 12 295 Spirals 1.20 103 340 2.5 28.00 40.0
4 500 1500 12 1.6 12 295 Spirals 1.00 119 320 2.5 28.00 36.0
5 500 1500 12 1.6 12 295 Spirals 1.00 36 320 2.5 28.00 47.0
6 500 1500 12 1.6 12 295 Spirals 1.60 93 307 2.5 28.00 46.0
7 500 1500 12 2.8 8 296 Spirals 1.20 52 340 2.5 31.00 52.0
8 500 1500 12 2.4 11 260 Spirals 1.20 52 340 2.5 27.00 49.0
9 500 1500 12 2.0 16 286 Spirals 1.20 52 340 2.5 31.00 52.0
10 500 1500 12 1.6 24 295 Spirals 1.20 52 340 2.5 27.00 50.0
11 500 1500 12 1.6 36 295 Spirals 1.20 52 340 2.5 27.00 54.0
12 500 1500 12 1.6 24 360 Spirals 1.20 52 340 2.5 31.00 52.0
C2H2L0M 204 612 12 1.0 6 312 Stirrups 0.60 60 397 1.5 24.50 30.1
C2H2L0M 204 612 12 1.0 6 312 Stirrups 0.60 60 397 1.5 24.50 30.1
C2H2L0M 204 612 12 1.0 6 312 Stirrups 0.60 60 397 1.5 24.50 30.1
C2H2L0M 204 612 12 1.0 6 312 Stirrups 0.60 60 397 1.5 24.50 30.1
Table 7
Comparison between theoretical and experimental
results for columns strengthened with transverse
reinforcement
Reference
Fu,theor/Fu,exp
Cusson and Paultre [2] Saatcioglu and Razvi [3] Frangou
et al. [4]
fib Model
Code 2010 [5]
Mean 0.90 1.02 0.88 0.97
CV 0.06 0.08 0.06 0.08
Table 8
Results of student’s t-test for columns strengthened
with transverse reinforcement. t-critical = 1.71088
Reference t
Cusson and Paultre [2] 5.40745
Saatcioglu and Razvi [3] –0.02044
Frangou et al. [4] 5.91667
fib Model Code 2010 [5] 1.99189
Figure 8
(Table 6). Two columns were tested by Carrazedo [6], four by Eid,
Roy, and Paultre [20], four by Wang et al. [21], and fifteen by Man
-der, Pristley, and Park [7]. All columns were short, with diameters vary-ing between 190 and 500 mm and concrete compressive strength ranging from 24.5 to 36 MPa. The results of this analysis are present-ed in Table 7. The columns’ resistance in this analysis was evaluatpresent-ed
by adding the confined concrete resistance and the resistance due to
the longitudinal reinforcement. The contribution of the concrete cover of the column was disregarded.
The comparison shows that all four design models predicted the
experimental columns’ strength with a difference of less than 12%
and a coefficient of variation of around 8%. Saatcioglu and Razvi’s
[3] overestimated the resistance, since the authors considered the
coefficient of confinement effectiveness to be equal to 1.0 for cir
-cular columns. However, this model showed a difference from the experimental results of only 2%.
From the bilateral paired Student’s t-test with a level of significance
(α) of 10% (Table 8), it is concluded that only the prediction by Saa
-tcioglu and Razvi’s model [3] is not significantly different from the
experimental results. Thus, only this model can predict the strength of reinforced concrete column equal to the value observed in tests
of columns confined with transverse reinforcement at a signifi
-cance level of 10% (Figure 8). When comparing the results pre
-dicted by Saatcioglu and Razvi’s model [3] with the experimental
results for this data set of columns, a correlation coefficient of 0.98
is obtained (Figure 9).
3.2.3 Columns strengthened with CFRP and transverse reinforcement
The database for this analysis contains 63 columns, that is, six columns tested by Huang et al. [23], four tested by Carrazedo [6], thirteen tested by Eid, Roy and Paultre [20], fourteen tested by Lee et al. [22], nine-teen tested by Yin et al. [24], and eight tested by Wang et al. [21]. All columns were short, with diameters varying from 150 to 305 mm and compressive concrete strength varying from 24.5 to 50.8 MPa. Six col-umns were strengthened with GFRP sheet wrapping and 57 with CFRP sheet wrapping. Moreover, 12 columns were made with conventional stirrups and 51 were made with circular spiral reinforcements (Table 9). For this analysis, the theoretical resistance of strengthened columns was calculated using Equation (16). Four design models
with confinement by transverse reinforcement, shown in Subsec
-tion 2.1, were combined with ten models of confinement by FRP,
shown in Subsection 2.2, generating a total of 40 combinations. Moreover, Machado’s proposal [9] of considering simultaneous
confinement by CRFP and stirrups was analyzed. The results are
shown in Table 10. In this analysis, the columns’ strength was
Figure 9
Comparison of theoretical and experimental
results of ultimate load of the column (F
u)
for Saatcioglu and Razvi’s model [3]. CC:
Correlation coefficient; SD: Standard deviation
Figure 10
evaluated by adding the resistance due to confined concrete to the
resistance of the longitudinal reinforcement.
The general view shows that the results of all 41 analyses were close to the values obtained from the tests. However, all
combina-tions showed a coefficient of variation greater than 20%.
From the results of the bilateral paired Student’s t-test with a level
of significance (α) of 10% shown in Table 11, it can be concluded
that the predicted and experimentally determined resistance were
not significantly different in eleven combinations (Table 12). Thus,
only these models can predict the strength of a reinforced concrete
column equal to the value observed in tests of columns confined
with transverse reinforcement and CFRP sheet wrapping at a
sig-nificance level of 10% (Figure 10). When comparing the results
predicted by these eleven models with the experimental results
for this data set of columns, a correlation coefficient that varies
from 0.88 to 0.92 is obtained (Figure 11). The best correlation is
observed from the combination of the fib Model Code 2010 [5] and
Spoelstra and Monti’s model [15], that is, combination number 36 (Figure 11 (j)). Moreover, the ratio between the axial strength pre-dicted by the eleven models and the experimental results of the columns in the data set ranged from 0.93 to 1.00.
The proposal of Machado [9] overestimated the resistance of the
data-set columns, on average, by 6%. When it was analyzed statistically, this proposal was significantly different from the experimental results at a
significance level of 10%. Therefore, the combinations of strengthen
-ing systems shown in Table 12 were considered more efficient than
Machado’s proposal [9] in the prediction of the resistance of columns strengthened by transverse reinforcement and CFRP sheet wrapping.
4. Conclusions
In this paper, some of main models used for strengthening of concrete columns with concrete jacket or wrapping with CFRP sheets were analyzed. They were applied to a database with 135
columns tested in the laboratory to evaluate the effectiveness of
the design models and the results were statistically analyzed. The main conclusions are as follows:
n For strengthening with a concrete jacket, the design models proposed by Cusson and Paultre [2], Saatcioglu and Razvi [3], Frangou et al. [4], and the fib Model Code 2010 [5] showed good correlation with the experimental results. However, when
they were applied to columns confined with transverse rein
-forcement (Subsection 3.2.2), only Saatcioglu and Razvi’s
model [3] was efficient, showing a correlation coefficient of 0.98
with the database columns;
n For columns wrapped exclusively with CFRP sheets, the mod-els of Samaan et al. [10], Saafi et al. [14], and Spoelstra and Monti [15] predicted the experimental results best. Spoelstra and Monti’s model [15] showed a better correlation with the strength of the columns in the database;
Table 9
Database of reinforced columns confined with FRP and transverse reinforcement (part 1)
Reference Model
Dimensions of column
and concrete strength FRP
Longitudinal
reinforcement Transverse reinforcement D (mm) H (mm) c (cm) fc (MPa) Fiber type tf (mm) ξf (‰) Ef (MPa) n φl (cm) nº fy,l (MPa) Type φt (cm) s (mm) fy,t (MPa) Carrazedo [6]
C1S50 190 570 1.5 26.16 CFRP 0.130 11.00 218950 1 0.8 6 554.8 Spirals 0.50 50 756
C2S50 190 570 1.5 26.16 CFRP 0.130 8.78 218950 2 0.8 6 554.8 Spirals 0.50 50 756
C1S25 190 570 1.5 28.86 CFRP 0.130 10.63 218950 1 0.8 6 554.8 Spirals 0.50 25 756
C2S25 190 570 1.5 28.86 CFRP 0.130 10.65 218950 2 0.8 6 554.8 Spirals 0.50 25 756
Eid, Roy, and Paultre [20]
A5NP2C 303 1200 2.5 29.40 CFRP 0.381 13.40 78000 2 1.6 6 423 Stirrups 0.95 150 602
A3NP2C 303 1200 2.5 31.70 CFRP 0.381 13.40 78000 2 1.6 6 550 Stirrups 0.95 70 602
A1NP2C 303 1200 2.5 31.70 CFRP 0.381 13.40 78000 2 1.6 6 486.5 Stirrups 0.95 45 602
C4NP2C 303 1200 2.5 31.70 CFRP 0.381 13.40 78000 2 1.6 6 423 Stirrups 1.13 100 456
C4N1P2C 303 1200 2.5 36.00 CFRP 0.381 13.40 78000 2 1.6 6 423 Spirals 1.13 100 456
C4NP4C 303 1200 2.5 31.70 CFRP 0.381 13.40 78000 4 1.6 6 423 Spirals 1.13 100 456
B4NP2C 303 1200 2.5 31.70 CFRP 0.381 13.40 78000 2 1.6 6 550 Stirrups 1.13 100 456
C4MP2C 303 1200 2.5 50.80 CFRP 0.381 13.40 78000 2 1.6 6 423 Spirals 1.13 100 456
C2NP2C 303 1200 2.5 31.70 CFRP 0.381 13.40 78000 2 1.6 6 423 Spirals 1.13 65 456
C2N1P2C 303 1200 2.5 36.00 CFRP 0.381 13.40 78000 2 1.6 6 423 Spirals 1.13 65 456
C2N1P4C 303 1200 2.5 36.00 CFRP 0.381 13.40 78000 4 1.6 6 423 Spirals 1.13 65 456
C2MP2C 303 1200 2.5 50.80 CFRP 0.381 13.40 78000 2 1.6 6 423 Spirals 1.13 65 456
C2MP4C 303 1200 2.5 50.80 CFRP 0.381 13.40 78000 4 1.6 6 423 Spirals 1.13 65 456
Huang et al. [23]
P1S1 150 300 0 30.04 GFRP 0.436 16.00 60800 1 – – – Spirals 0.80 25 356
P2S1 150 300 0 30.04 GFRP 0.436 16.00 60800 2 – – – Spirals 0.80 25 356
P3S1 150 300 0 30.04 GFRP 0.436 16.00 60800 3 – – – Spirals 0.80 25 356
P1S2 150 300 0 30.04 GFRP 0.436 16.00 60800 1 – – – Spirals 0.80 50 356
P2S2 150 300 0 30.04 GFRP 0.436 16.00 60800 2 – – – Spirals 0.80 50 356
n From the 41 combinations of the reinforced column
strength-ened with FRP and transverse reinforcement analyzed, only
eleven combinations predicted a resistance that did not differ
statistically from the resistance of columns evaluated in the data set (Table 12). The best correlation was obtained for the
combination of the fib Model Code 2010 [5] and Spoelstra and
Monti [15],
n For column strengthening with FRP and transverse
reinforce-ment, it was shown that there is simultaneous confinement due to both materials. Moreover, the hypothesis that the confined
concrete strength can be obtained by adding the parcels of resistance due to CFRP sheet wrapping and due to transverse
reinforcement separately was more effective than the hypoth
-esis that the confined concrete r-esistance would be obtained
from the sum of the lateral pressure due to the CFRP and transverse reinforcement.
Table 9
Database of reinforced columns confined with FRP and transverse reinforcement (part 2)
Reference Model
Dimensions of column
and concrete strength FRP
Longitudinal
reinforcement Transverse reinforcement D
(mm) H (mm)
c (cm)
fc
(MPa) Fiber type
tf
(mm)
ξf
(‰) Ef
(MPa) n
φl
(cm) nº fy,l
(MPa) Type
φt
(cm) s (mm)
fy,t
(MPa)
Lee et al. [22]
S6F1 150 300 0.725 36.20 CFRP 0.110 18.04 250000 1 – – – Spirals 0.55 60 569.6
S6F2 150 300 0.725 36.20 CFRP 0.110 18.04 250000 2 – – – Spirals 0.55 60 569.6
S6F4 150 300 0.725 36.20 CFRP 0.110 18.04 250000 4 – – – Spirals 0.55 60 569.6
S6F5 150 300 0.725 36.20 CFRP 0.110 18.04 250000 5 – – – Spirals 0.55 60 569.6
S4F1 150 300 0.725 36.20 CFRP 0.110 18.04 250000 1 – – – Spirals 0.55 40 569.6
S4F2 150 300 0.725 36.20 CFRP 0.110 18.04 250000 2 – – – Spirals 0.55 40 569.6
S4F3 150 300 0.725 36.20 CFRP 0.110 18.04 250000 3 – – – Spirals 0.55 40 569.6
S4F4 150 300 0.725 36.20 CFRP 0.110 18.04 250000 4 – – – Spirals 0.55 40 569.6
S4F5 150 300 0.725 36.20 CFRP 0.110 18.04 250000 5 – – – Spirals 0.55 40 569.6
S2F1 150 300 0.725 36.20 CFRP 0.110 18.04 250000 1 – – – Spirals 0.55 20 569.6
S2F2 150 300 0.725 36.20 CFRP 0.110 18.04 250000 2 – – – Spirals 0.55 20 569.6
S2F3 150 300 0.725 36.20 CFRP 0.110 18.04 250000 3 – – – Spirals 0.55 20 569.6
S2F4 150 300 0.725 36.20 CFRP 0.110 18.04 250000 4 – – – Spirals 0.55 20 569.6
S2F5 150 300 0.725 36.20 CFRP 0.110 18.04 250000 5 – – – Spirals 0.55 20 569.6
Yin et al. [24]
1L-50-N1 150 300 0.5 30.60 CFRP 0.167 15.00 213000 1 – – – Spirals 0.60 50 335
1L-50-N2 150 300 0.5 30.60 CFRP 0.167 15.00 213000 1 – – – Spirals 0.60 50 335
1L-50-N3 150 300 0.5 30.60 CFRP 0.167 15.00 213000 1 – – – Spirals 0.60 50 335
1L-25-N1 150 300 0.5 30.60 CFRP 0.167 15.00 213000 1 – – – Spirals 0.60 25 335
1L-25-N2 150 300 0.5 30.60 CFRP 0.167 15.00 213000 1 – – – Spirals 0.60 25 335
1L-25-N3 150 300 0.5 30.60 CFRP 0.167 15.00 213000 1 – – – Spirals 0.60 25 335
2L-50-N1 150 300 0.5 30.60 CFRP 0.167 15.00 213000 2 – – – Spirals 0.60 50 335
2L-50-N2 150 300 0.5 30.60 CFRP 0.167 15.00 213000 2 – – – Spirals 0.60 50 335
2L-50-N3 150 300 0.5 30.60 CFRP 0.167 15.00 213000 2 – – – Spirals 0.60 50 335
2L-25-N1 150 300 0.5 30.60 CFRP 0.167 15.00 213000 2 – – – Spirals 0.60 25 335
2L-25-N2 150 300 0.5 30.60 CFRP 0.167 15.00 213000 2 – – - Spirals 0.60 25 335
2L-25-N3 150 300 0.5 30.60 CFRP 0.167 15.00 213000 2 – – – Spirals 0.60 25 335
3L-50-N1 150 300 0.5 30.60 CFRP 0.167 15.00 213000 3 – – – Spirals 0.60 50 335
3L-50-N2 150 300 0.5 30.60 CFRP 0.167 15.00 213000 3 – – – Spirals 0.60 50 335
3L-50-N3 150 300 0.5 30.60 CFRP 0.167 15.00 213000 3 – – – Spirals 0.60 50 335
3L-25-N1 150 300 0.5 30.60 CFRP 0.167 15.00 213000 3 – – – Spirals 0.60 25 335
3L-25-N2 150 300 0.5 30.60 CFRP 0.167 15.00 213000 3 – – – Spirals 0.60 25 335
3L-25-N3 150 300 0.5 30.60 CFRP 0.167 15.00 213000 3 – – – Spirals 0.60 25 335
Wang et al. [21]
C1H1L1M 305 915 2.1 24.50 CFRP 0.167 17.79 244000 1 1.2 8 340.0 Stirrups 0.60 80 397
C1H1L2M 305 915 2.1 24.50 CFRP 0.167 17.79 244000 2 1.2 8 340.0 Stirrups 0.60 80 397
C1H2L1M 305 915 2.1 24.50 CFRP 0.167 17.79 244000 1 1.2 8 340.0 Stirrups 0.60 40 397
C1H2L2M 305 915 2.1 24.50 CFRP 0.167 17.79 244000 2 1.2 8 340.0 Stirrups 0.60 40 397
C2H1L1M 204 612 1.5 24.50 CFRP 0.167 17.79 244000 1 1 6 312.0 Stirrups 0.60 120 397
C2H1L2M 204 612 1.5 24.50 CFRP 0.167 17.79 244000 2 1 6 312.0 Stirrups 0.60 120 397
C2H2L1M 204 612 1.5 24.50 CFRP 0.167 17.79 244000 1 1 6 312.0 Stirrups 0.60 60 397
Table 10
Comparison between the theoretical and experimental results for columns strengthened with FRP
and transverse reinforcement
Comb. References Mean CV
1 Cusson and Paultre [2] and Samaan et al. [10] 0.97 0.22
2 Cusson and Paultre [2] and Miyauchi et al. [11] 1.05 0.20
3 Cusson and Paultre [2] and Kono et al. [12] 0.84 0.24
4 Cusson and Paultre [2] and Toutanji [13] 1.13 0.20
5 Cusson and Paultre [2] and Saafi et al. [14] 0.93 0.21
6 Cusson and Paultre [2] and Spoelstra and Monti [15] 0.93 0.20
7 Cusson and Paultre [2] and Fardis and Khalili [16] 0.86 0.21
8 Cusson and Paultre [2] and Karbhari and Eckel [17] 0.91 0.21
9 Cusson and Paultre [2] and Mirmiran and Shahawy [18] 0.80 0.26
10 Cusson and Paultre [2] and Shehata, Carneiro, and Shehata [19] 0.86 0.21
11 Saatcioglu and Razvi [3] and Samaan et al. [10] 1.06 0.21
12 Saatcioglu and Razvi [3] and Miyauchi et al. [11] 1.15 0.20
13 Saatcioglu and Razvi [3] and Kono et al. [12] 0.93 0.24
14 Saatcioglu and Razvi [3] and Toutanji [13] 1.22 0.20
15 Saatcioglu and Razvi [3] and Saafi et al. [14] 1.02 0.21
16 Saatcioglu and Razvi [3] and Spoelstra and Monti [15] 1.02 0.20
17 Saatcioglu and Razvi [3] and Fardis and Khalili [16] 0.95 0.21
18 Saatcioglu and Razvi [3] and Karbhari and Eckel [17] 1.00 0.21
19 Saatcioglu and Razvi [3] and Mirmiran and Shahawy [18] 0.89 0.26
20 Saatcioglu and Razvi [3] and Shehata, Carneiro, and Shehata [19] 0.95 0.21
21 Frangou et al. [4] and Samaan et al. [10] 0.96 0.22
22 Frangou et al. [4] and Miyauchi et al. [11] 1.04 0.21
23 Frangou et al. [4] and Kono et al. [12] 0.83 0.24
24 Frangou et al. [4] and Toutanji [13] 1.12 0.20
25 Frangou et al. [4] and Saafi et al. [14] 0.92 0.22
26 Frangou et al. [4] and Spoelstra and Monti [15] 0.92 0.20
27 Frangou et al. [4] and Fardis and Khalili [16] 0.85 0.22
28 Frangou et al. [4] and Karbhari and Eckel [17] 0.90 0.22
29 Frangou et al. [4] and Mirmiran and Shahawy [18] 0.79 0.26
30 Frangou et al. [4] and Shehata, Carneiro, and Shehata [19] 0.85 0.22
31 fib Model Code 2010 [5] and Samaan et al. [10] 1.00 0.21
32 fib Model Code 2010 [5] and Miyauchi et al. [11] 1.09 0.19
33 fib Model Code 2010 [5] and Kono et al. [12] 0.87 0.23
34 fib Model Code 2010 [5] and Toutanji [13] 1.16 0.19
35 fib Model Code 2010 [5] and Saafi et al. [14] 0.97 0.21
36 fib Model Code 2010 [5] and Spoelstra and Monti [15] 0.97 0.19
37 fib Model Code 2010 [5] and Fardis and Khalili [16] 0.90 0.21
38 fib Model Code 2010 [5] and Karbhari and Eckel [17] 0.94 0.21
39 fib Model Code 2010 [5] and Mirmiran and Shahawy [18] 0.83 0.25
40 fib Model Code 2010 [5] and Shehata, Carneiro, and Shehata [19] 0.89 0.21
41 Machado [9] 1.06 0.23
5. Notation
AFRP Aramid Fiber Reinforced Polymers,
Ac,n Area of core of section within center lines of transverse reinforcement, Ag Gross area of column,
As,tx Total area of transverse reinforcement parallel to y-axis, As,ty Total area of transverse reinforcement parallel to x-axis, As,l Total area of longitudinal reinforcement of the column, As,t Area of the transverse reinforcement,
b Rectangular column width,
bc Distance between centers of longitudinal bars,
c Concrete cover,
cx Core dimension of the column perpendicular to the x direction, measured between centers of transverse reinforcement, cy Core dimension of the column perpendicular to the y direction,
measured between centers of transverse reinforcement, CFRP Carbon Fiber Reinforced Polymers,
d Diameter of the concrete section confined by the stirrups,
D Diameter of circular columns, Ef Modulus of elasticity of FRP,
fc Compressive strength of concrete of the column, fcc Compressive strength of confined concrete,
fcc,e Compressive strength of confined concrete with transverse reinforcement,
fcc,exp Experimental compressive strength of confined concrete, fcc,f Compressive strength of confined concrete with RFP, ff Tensile strength of FRP,
fl Lateral pressure, fle Nominal lateral pressure,
fl,e Lateral pressure of transverse reinforcement, fl,f Lateral pressure of CFRP,
fl,f(b) Lateral pressure applied on side b of cross-section, fl,f(h) Lateral pressure applied on side h of cross-section, fy,t Yield strength of transverse steel,
fy,l Yield strength of longitudinal steel, FRP Fiber Reinforced Polymers,
Fu,exp Experimental ultimate load of the column, Fu,theor Theoretical ultimate load of the column, GFRP Glass Fiber Reinforced Polymers,
h Cross-section height of the rectangular column,
H Column height,
ka, kb, k2, Ke Coefficient of confinement effectiveness,
n Number of CFRP sheets,
nº Number of longitudinal reinforcements, r' Ratio of the column dimensions, s Center-to-center spacing between stirrups, s' Clear spacing of stirrups,
tf Thickness of the CFRP sheet,
w_i Clear spacing between adjacent longitudinal steel bars, α Level of significance for Student’s t-test,
αn, αs, α' Reduction factor,
θ Angle between the transverse reinforcement and bc,
λ Slenderness index,
ξf CFRP deformation,
ρl Longitudinal reinforcement ratio in the core section,
ρt Transverse reinforcement ratio in the core section,
φl Longitudinal reinforcement diameter,
φt Transverse reinforcement diameter,
ωc, ωw Confinement rate.
6. References
[1] TAKEUTI, A. R. Strengthening of reinforced concrete col
-umns by means of high-performance concrete jacketing,
1999 – Escola de Engenharia de São Carlos, Universidade
de São Carlos, 184 p. [in Portuguese]
[2] CUSSON, D., PAULTRE, P. Stress-strain model for confined
high-strength concrete. Journal of Structural Engineering, ASCE, v. 121, n. 3, 1995, pp.. 468–477.
[3] SAATCIOGLU, M., RAZVI, S. R. Strength and ductility of confined concrete. Journal of Structural Engineering. ASCE.
v. 118, n. 6, 1992, pp. 1590–1607.
[4] FRANGOU, M., PILAKOUTAS, K. DRITSOS, S. Structural
repair/strengthening of RC columns. Construction and Build
-ing Materials, v. 9, n. 5, 1995, pp. 259–266.
[5] FIB: FÉDERATION INTERNATIONALE DU BETÓN. Model
Code 2010 – Final draft, v. 2. Bulletin 66. 2012, pp. 16–26.
[6] CARRAZEDO, R. Confinement effects and their implication
on the strengthening of concrete columns by wrapping with
carbon fiber composites. São Paulo, 2002 – Escola de En
-Table 11
Results of Student’s t-test for columns strengthened
with FRP and transverse reinforcement.
t-critical = 1.99897
References t
Cusson and Paultre [2] and Samaan et al. [10] –0.12386 Cusson and Paultre [2] and Miyauchi et al. [11] –3.05512 Cusson and Paultre [2] and Kono et al. [12] 5.66179
Cusson and Paultre [2] and Toutanji [13] –4.95605
Cusson and Paultre [2] and Saafi et al. [14] 1.58771 Cusson and Paultre [2] and Spoelstra and Monti [15] 2.15434 Cusson and Paultre [2] and Fardis and Khalili [16] 5.33989 Cusson and Paultre [2] and Karbahari and Eckel [17] 2.77478 Cusson and Paultre [2] and Mirmiran and Shahawy [18] 6.74943
Cusson and Paultre [2] and Shehata, Carneiro
and Shehata [19] 5.66797
Saatcioglu and Razvi [3] and Samaan et al. [10] –2.85229 Saatcioglu and Razvi [3] and Miyauchi et al. [11] –5.52444 Saatcioglu and Razvi [3] and Kono et al. [12] 1.99897
Saatcioglu and Razvi [3] and Toutanji [13] –6.67271 Saatcioglu and Razvi [3] and Saafi et al. [14] –1.78451 Saatcioglu and Razvi [3] and Spoelstra and Monti [15] –1.72622 Saatcioglu and Razvi [3] and Fardis and Khalili [16] 0.73222 Saatcioglu and Razvi [3] and Karbahari and Eckel [17] –0.96384 Saatcioglu and Razvi [3] and Mirmiran and Shahawy [18] 2.56853
Saatcioglu and Razvi [3] and Shehata, Carneiro
and Shehata [19] 0.98920
Frangou et al. [4] and Samaan et al. [10] 0.23657 Frangou et al. [4] and Miyauchi et al. [11] –2.70569
Frangou et al. [4] and Kono et al. [12] 6.19093
Frangou et al. [4] and Toutanji [13] –4.71205
Frangou et al. [4] and Saafi et al. [14] 2.02394 Frangou et al. [4] and Spoelstra and Monti [15] 2.64534 Frangou et al. [4] and Fardis and Khalili [16] 5.87421 Frangou et al. [4] and Karbahari and Eckel [17] 3.24570 Frangou et al. [4] and Mirmiran and Shahawy [18] 7.20314 Frangou et al. [4] and Shehata, Carneiro, and Shehata [19] 6.20487 fib Model Code 2010 [5] and Samaan et al. [10] –1.35751 fib Model Code 2010 [5] and Miyauchi et al. [11] –4.28415 fib Model Code 2010 [5] and Kono et al. [12] 3.95378
fib Model Code 2010 [5] and Toutanji [13] –5.88707 fib Model Code 2010 [5] and Saafi et al. [14] 0.13277 fib Model Code 2010 [5] and Spoelstra and Monti [15] 0.48751 fib Model Code 2010 [5] and Fardis and Khalili [16] 3.50500 fib Model Code 2010 [5] and Karbahari and Eckel [17] 1.20664 fib Model Code 2010 [5] and Mirmiran and Shahawy [18] 5.19730
fib Model Code 2010 [5] and Shehata, Carneiro
and Shehata [19] 3.81781
Table 12
Design models with the best predictions of column strengthening
Comb. References Mean CV
1 Cusson and Paultre [2] and Samaan et al. [10] 0.97 0.22
5 Cusson and Paultre [2] and Saafi et al. [14] 0.93 0.22
13 Saatcioglu and Razvi [3] and Kono et al. [12] 0.93 0.24
17 Saatcioglu and Razvi [3] and Fardis and Khalili [16] 0.95 0.22
18 Saatcioglu and Razvi [3] and Karbhari and Eckel [17] 1.00 0.22
20 Saatcioglu and Razvi [3] and Shehata, Carneiro, and Shehata [19] 0.95 0.22
21 Frangou et al. [4] and Samaan et al. [10] 0.96 0.22
31 fib Model Code 2010 [5] and Samaan et al. [10] 1.00 0.21
35 fib Model Code 2010 [5] and Saafi et al. [14] 0.97 0.21
36 fib Model Code 2010 [5] and Spoelstra and Monti [15] 0.97 0.20
38 fib Model Code 2010 [5] and Karbhari and Eckel [17] 0.94 0.21
genharia de São Carlos, Universidade de São Carlos, 173 p.
[in Portuguese]
[7] MANDER, J., PRIESTLEY, M., PARK, R. Theoretical
stress-strain model for confined concrete. Journal of Structural En
-gineering, v. 114, n. 8, 1988, pp. 1804–1826.
[8] CEN: EUROPEAN COMMITTEE FOR STANDARDIZA
-TION. Eurocode 8: Design of structures for earthquake re-sistance – Part 1: General rules, seismic action and rules for buildings, Brussels, 2003, 215 p.
[9] MACHADO, A. P. Reforço de Estruturas de Concreto Ar-mado com Fibras de Carbono: Características, dimension-amento e aplicação. São Paulo: PINI, 1ed, 2002, 271 p. [in Portuguese]
[10] SAMAAN, M., MIRMIRAN, A., SHAHAWY, M. Model of con
-crete confined by fiber composites. Journal of Structural En
-gineering, v. 124, 1998, pp. 1025–1031.
[11] MIYAUCHI, K., NISHIBAYASHI, S., INOUE, S. Estimation of strengthening effects with carbon fiber sheet for concrete
column. International Symposium. Tokyo, v. 1, 1997, pp. 217–225.
[12] KONO, S., INAZUMI, M., KAKU, T. Evaluation of confining effects of CFRP sheets on reinforced concrete members.
Proceedings of the Second International on Composites in Infrastructure, ICCI ’98, H. Saadatmanesh and M. R. Ehsani, Editors, Tucson, Arizona, 1998, pp. 343–355.
[13] TOUTANJI, H. A. Stress-strain characteristics of concrete columns externally confined with advanced fiber composite
sheets. ACI Materials Journal, v. 96, n. 3, 1999, pp. 397–404.
[14] SAAFI, M., TOUTANJI, H.A., LI, Z. Behaviour of concrete columns confined with fiber reinforced polymer tubes. ACI
Materials Journal, v. 96, n. 4, 1999, pp. 500–509.
[15] SPOELSTRA, M.R., MONTI, G. FRP-confined concrete
model. Journal of Composites for Construction, v. 3, n. 3, 1999, pp. 143–150.
[16] FARDIS, M. N., KHALILI, H. H. Concrete encased in fiber
-glass-reinforced plastic. ACI Materials Journal, v. 78, n. 6, 1981, pp. 440–446.
[17] KARBHARI, V.M., ECKEL, D.A. Strengthening of concrete
column stubs through resin infused composite wraps. Jour-nal of Thermoplastic Composite Materials, v. 6, 1993, pp.
92–107.
[18] MIRMIRAN, A., SHAHAWY, M. Behavior of concrete col
-umns confined with fiber composites. Journal of Structural
Engineering, ASCE, v. 123, 1997, pp. 583–590.
[19] SHEHATA, I., CARNEIRO, L., SHEHATA, L. Strength of
short concrete columns confined with CFRP sheets. Materi
-als and Structures. v. 35, 2002, pp. 50–58.
[20] EID, R., ROY, N. PAULTRE, P. Normal- and high-strength
concrete circular elements wrapped with FRP composites. Journal of Composites for Construction. v. 13, 2009, pp. 113–124.
[21] WANG, Z., WANG, D., SMITH, S. T., LU, D. Experimental
testing and analytical modeling of CFRP-confined large cir
-cular RC columns subjected to cyclic axial compression. En-gineering Structures. v. 40, 2012, pp. 64–74.
[22] LEE, J. Y., OH, Y. J., PARK, J. S., MANSOUR, M. Y. Be
-haviors of concrete columns confined with both spiral and
fiber composites. In: 13th World Conference on Earthquake
Engineering, 2004, Vancouver, Canada.
[23] HUANG, L., SUN, X., YAN, L., ZHU, D. Compressive be
-havior of concrete confined with GFRP tubes and steel spi
-rals. Polymers, 7, 2015, pp. 851–875.
[24] YIN, P., HUANG, L., YAN, L., ZHU, D. Compressive behav
-ior of concrete confined by CFRP and transverse spiral rein
-forcement. Part A: Experimental study. Materials and Struc-tures, v. 49, n. 3, 2016, pp. 1001–1011.
[25] MONTGOMERY, D. C., RUNGER, G. C. Estatística Aplicada