See discussions, stats, and author profiles for this publication at: https://www.researchgate.net/publication/318500954
Detecting early mealybug infestation stages on tomato plants using optical
spectroscopy
Article in European Journal of Horticultural Science · June 2017
DOI: 10.17660/eJHS.2017/82.3.4 CITATION 1 READS 644 4 authors, including:
Some of the authors of this publication are also working on these related projects:
Mealybug reproductive biology and pheromone-mediated interactions: a basis to develop ecological sound management tactics for pest mealybugs (PTDC/AGR-AAM/099560/2008)View project
Coping with alien pests in citrus and eucalyptus: implementing best strategies plant system models (funded by the FCT project PTDC/AGR-CFL/111877/2009)View project
Elisabete Figueiredo University of Lisbon
62PUBLICATIONS 201CITATIONS
SEE PROFILE
José Carlos Franco University of Lisbon 137PUBLICATIONS 1,031CITATIONS SEE PROFILE Rui Guerra Universidade do Algarve 38PUBLICATIONS 211CITATIONS SEE PROFILE
All content following this page was uploaded by José Carlos Franco on 03 August 2017. The user has requested enhancement of the downloaded file.
V o l u m e 8 2 | I s s u e 3 | J u n e 2 0 1 7 141
Detecting early mealybug infestation stages on tomato plants
using optical spectroscopy
D.V.P. Canário
1,4, E. Figueiredo
1,3, J.C. Franco
1,2and R. Guerra
41 Departamento de Ciências e Engenharia de Biossistemas (DCEB), Instituto Superior de Agronomia, Universidade de Lisboa, Lisboa, Portugal
2 Centro de Estudos Florestais (CEF), Instituto Superior de Agronomia, Universidade de Lisboa, Lisboa, Portugal
3 Linking Landscape, Environment, Agriculture and Food (LEAF), Instituto Superior de Agronomia, Universidade de Lisboa, Lisboa, Portugal
4 Centro de Electrónica, Optoelectrónica e Telecomunicações (CEOT), Faculdade de Ciências e Tecnologia, Universidade do Algarve, Campus de Gambelas, Faro, Portugal
Original article – Thematic Issue
German Society for Horticultural Science
Summary
Mealybugs (Hemiptera: Pseudococcidae) are im-portant pests in agricultural and ornamental crops, including the tomato. Damage by mealybugs is char-acterized by a reduction in plant photosynthesis and growth due to sap feeding and also, as a result of hon-eydew excretion, from sooty mould development and virus transmission. The effectiveness of mealybug control strategies, including the application of insec-ticides and biological control, depends on the ability to detect the infestation at an early stage. Monitoring by visual observation is not very effective and is time-consuming. Optical spectroscopy represents a poten-tial tool for detecting plant biotic stresses, including that caused by insect pests. In this study, we tested the feasibility of using optical spectroscopy for the early detection of mealybug infestation of tomato plants. An experiment was carried out using potted plants under field conditions, with 15 replicates per treat-ment and a randomised design. Two treattreat-ments were considered: 1) infested plants inoculated with three mealybug egg masses; and 2) control plants without mealybugs. The distance between pots was kept at 80 cm and the plants were frequently inspected to en-sure control plants were not infested with mealybugs. The following parameters were recorded weekly over 5 weeks for each plant: 1) reflectance of marked leaves was measured with a USB4000 spectrometer across the wavelength 400–1,000 nm; 2) plant height; 3) leaf size; 4) mealybug density; and 5) presence and density of other pests. Results of principal compo-nent analysis (PCA) second derivative of the leaf re-flectance showed a clear distinction between control and infested plants and a separation of components in the near infrared (NIR) region on the last day of the analysis (57 days). The reduction in absorption in the NIR region may be due to an increase in the quantity of air spaces within the leaf’s mesophyll, changing the spatial distribution of the leaves’ refractive index and, as a consequence, the light scattering contribu-tion to the reflectance spectra. When tracking the evolution of the leaves’ absorbance, infested leaves relative to control leaves had a tendency over time to have reduced absorbance in photosystem II and NIR plateau wavelengths. The evolution over time of the reflectance of analysed leaves at each wavelength
Significance of this study
What is already known on this subject?
• Mealybugs are an increasingly important pest in solanaceous crops in the Mediterranean region. Their detection is based on visual observation of plants in poor ergonometric conditions (as the pest starts the infestation at the base of the stem) and usually implies increased farm production costs either by increased number of labour hours or increased use of insecticides. Also, it is still not clear how mealybugs and other piercing/sucking insects affect plants, but they seem to induce plant defense systems that usually are activated by fungal, bacterial and virus pathogens.
What are the new findings?
• By using optical reflectance we were able to detect the presence of mealybug species Pseudococcus viburni on tomato plants at an early stage and identify how these caused leaf reflectance wavelength changes, under outdoor conditions. This study provides further knowledge into the use of non-invasive methods to detect pests.
What is the expected impact on horticulture?
• The use of optical spectroscopy has the potential to detect causes of biotic and abiotic stresses earlier and in a quicker and more efficient way than traditional pest detection methods, such as visual observation of plants. It could also reduce production costs of farms, by reducing farm labour hours and improve labour well-being. Additionally, the determination of which reflected wavelengths are affected by pests can help elucidate how these affect plants.
fitted a quadratic curve, the coefficients of which dis-criminated between infested and control plants. This methodology has the potential to provide an objective measure of the degree of infestation by pests and the potential impact on the crop.
Keywords
tomato, mealybugs, Pseudococcus viburni, non-invasive pest detection, optical spectroscopy, NIR region, PCA analysis, precision agriculture
142 E u r o p e a n J o u r n a l o f H o r t i c u l t u r a l S c i e n c e
Introduction
Mealybugs (Hemiptera: Pseudococcidae) are an increas-ingly important pest of vegetables, especially solanaceous crops produced in protected environment in the Mediter-ranean basin. In 2010, mealybugs affected 13% of Almeria’s (Spain) protected production of sweet peppers (Salmerón, 2011). The main infesting mealybug species were
Phenacoc-cus solani Ferris, PhenacocPhenacoc-cus madeirensis (Green), Plano-coccus citri (Risso) and PseudoPlano-coccus longispinus
(Targioni-Tozzetti). In the Portuguese Oeste, the main region where vegetables are produced in greenhouses (Miranda et al., 2004), 16% of farmers reported infestations, 69% of which occurred in the last three years (Canário, 2016). The main infesting mealybug species were P. madeirensis and P. viburni (Canário, 2016) and the latter species is also the main spe-cies affecting greenhouse tomato in the United Kingdom (Jacobson, 2002).
Mealybugs feed on the phloem sap and excrete the excess of sugars in the form of honeydew by projecting it downwards onto leaves and fruits. Honeydew is often collected by ants, which establish mutualistic interactions with mealybugs, by protecting them against natural enemies. Direct damage caused by the insect’s feeding results in symptoms such as yellowing of leaves and defoliation, reduced growth and in extreme cases death. Indirect damage results from colonization of infested plants by opportunistic and saprophytic fungi, such as sooty mould and Botrytis
cinerea Pers., or virus transmission (Golan et al., 2015).
Different control tactics are available, including chemical and biological control, but their efficacy depends on the stage of the infestation and the pest species. The sooner the infestation by mealybugs is detected the easier it is to control them. Unfortunately, mealybugs are difficult and expensive to monitor, due to their cryptic behaviour and visual inspection is the main monitoring method used by farmers to detect infestations. However, this is a time-consuming approach and the use of optical spectroscopy might allow earlier detection of plants infested with mealybugs. Indeed, there are several reports in the literature showing the possible use of spectroscopy for the diagnosis of pest-induced stress in plants including: powdery mildew and take-all in wheat (Graeff et al., 2006), brown planthopper and leaffolder in rice (Yang et al., 2007), leaf miner in tomato (Xu et al., 2007) and solenopsis mealybug in cotton (Prabhakar et al. [2013] and review by Sankaran et al. [2010] for more examples). Principal Component Analysis (PCA), in which correlations between variables are used to permit the deduction of patterns is frequently used for spectral data analysis (Raschka, 2015). The objective of the present study was to test the usefulness of optical spectroscopy for detection of infestations by mealybugs of tomato plants with the view to design an easy to use instrument for farmers. During this experiment P. viburni-infested and non-infested tomato plants were kept under field conditions. Plant health and development was periodically monitored and the degree of mealybug infestation determined using visual inspection and a spectrometer.
Materials and methods
Experimental designTwo groups of potted plants (15 replicates each) were used; one group was inoculated with three P. viburni egg masses and the other was not inoculated (control). Pots
were numbered and organised using a randomised design and placed at 80 cm distance from each other. Plants were grown in a mixture of coconut fibre and vegetable substrate (1:1) and staked on bamboo canes under field conditions in the Experimental Station of the Regional Services of the Ministry of Agriculture (Faro, Portugal) for 6 weeks (following a 2-week inoculation period in a lab). A net cover was positioned above the plants for the first three weeks of transplantation to field conditions so these could adapt to high solar radiation and to reduce transplantation stress. The pots were watered twice a day for approximately 25 mins, with an automated irrigation system. Granular ammonium sulphate was added to the plants three weeks after the beginning of the experiment.
Measurement of leaf reflectance
In each plant, two healthy looking leaves (pest and disease free) were marked and monitored during the experiment, until they became chlorotic (due to old age) or damaged by the inoculated pest or by other pests such as
Tuta absoluta (Meyrick) or Chrysodeixis chalcites (Esper).
Damaged leaves were substituted by new leaves so that a standardized number of readings were recorded for each plant. Leaf reflectance was measured using an USB4000 spectrometer (Ocean Optics, US) with a HL-2000 tungsten halogen light source (Ocean Optics, US) and a QR600-7-VIS-125F bifurcated optic fibre with an incorporated reflectance probe (Ocean Optics, US), and a portable computer with an Ocean Optics Spectra Suit program. The integration time and frame acquisition were defined, respectively, at six ms and at an average of 30 spectra. Dark counts were registered and light references were obtained from the measurement of
Spectralon® as soon as the light source stabilized. Reference and dark counts re-measurements were defined at every two tomato plant rows, due to the existence of temperature fluctuations and readout noise. The running principle of the probe is that when adapted to a leaf, it isolates exterior light and allows the optic behaviour of a leaf to be studied as the emitting light fibres of the probe are distributed so that the light projected on a leaf is reflected to a light receptor fibre in the centre of the probe, or transmitted/absorbed through/or by the leaf (Afonso et al., 2015).
Reflectance measurements were taken six times at 10-day intervals from one week after the acclimation period of the plants and two weeks before the removal of the cover (21st of August and the 2nd of October 2015). Additionally, for each plant, plant height, the width and length of the biggest photosynthetically active leaf was measured, mealybug density and the presence of other pests were registered. For each pest, a pest density was defined per plant as follows: low (L), less than 10 pests detected; medium (M), 10–20 pests detected; and severe (S), >20 pests detected. In the last week of the trial, five healthy leaves (not chlorotic or damaged) per plant were chosen randomly and leaf size and reflectance and transmittance was measured. The aim of the latter trial was to record reflectance in one day in five randomly chosen leaves per plant. The reflectance (R) or transmittance (T) of each sample (S) was converted using the reference spectra (W) and dark counts (D) for values near reality (without the influence of noise associated with the equipment) using Equation 1:
Reflectance measurements were taken six times at 10-day intervals from one week after the acclimation period of the plants and two weeks before the removal of the cover (21st of August and the 2nd of October 2015). Additionally, for each plant, plant height, the width and length of the biggest photosynthetically active leaf was measured, mealybug density and the presence of other pests were registered. For each pest, a pest density was defined per plant as follows: low (L), less than 10 pests detected; medium (M), 10–20 pests detected; and severe (S), >20 pests detected. In the last week of the trial, five healthy leaves (not chlorotic or damaged) per plant were chosen randomly and leaf size and reflectance and transmittance was measured. The aim of the latter trial was to record reflectance in one day in five randomly chosen leaves per plant. The reflectance (R) or transmittance (T) of each sample (S) was converted using the reference spectra (W) and dark counts (D) for values near reality (without the influence of noise associated with the equipment) using Equation 1:
� �� � � ������ (1)
Data analysis
The leaf reflectance analysis was performed using the R programming (R Core Team, 2015). The reflectance (R) was converted to absorbance (A) by applying the Beer-Lambert law (Equation 2).
� � ����� � � � ������) (2)
In the case of the reflectance of randomly selected leaves (measurements of the last day only), several transformations were applied to reduce data variability including, Multiplicative Scatter Correction (MSC) (Isaksson and Næs, 1988) and a Savitzky-Golay (SG) filter (Savitzky and Golay, 1964). These are well-known transformations in spectroscopy. The MSC transformation compensates for vertical shifts in the spectra caused by light scattering, and establishes a linear fit between each spectrum and the average spectrum. The SG filter is a moving polynomial filter that smooths the derivation.
Principal Component Analysis (PCA) was performed for the randomly selected leaves after each transformation. To establish which wavelengths best separates the infested and control plants a separation parameter was calculated using Equation 3. In the equation, mC and mI were defined as, respectively, the average values of the second derivative of the absorbance of control (C) and infested (I) plant leaves. sC and sI were the standard deviation of the second derivative of the absorbance of control (C) and infested (I) plant leaves, respectively. This simple parameter illustrates the intuitive concept that two groups are clearly separable when their measurements produce error bars that do not overlap. Therefore, separation is clear when |sep| >1.
��� �������)������) (3)
Results
Qualitative and quantitative description of plants
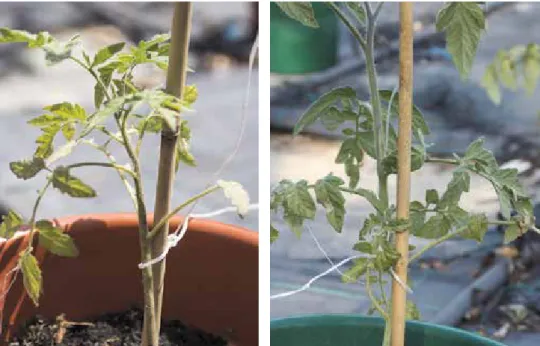
Table 1 shows the results of field data analysis. Initially infestation levels of all pests, other than the mealybug, were low, but increased as the trial progressed, especially in the case of aphids and Tuta absoluta. Mealybugs maintained high populations in nearly 50% of infested plants throughout the trial, while aphids and T. absoluta only by mid-September reached important populations. Figure 1 shows on the left-hand side mealybug infested plants and on the right-hand side control plants. Visual changes could be seen on some leaves, that could be associated with mealybugs, such as leaf wilting and leaf chlorosis/necrosis. Table 2 shows the results of a Student’s t-test to the null hypothesis: the means of control and infected groups are equal in day 57. Based on field data, significant differences (95% confidence) were found between control and infested plants for mealybug populations, plant height and length of the biggest photosynthetically active leaf, but no significant differences were found for T. absoluta and aphid populations.
Reflectance measurement of randomly selected leaves
Figures 2A–D show the results obtained on randomly selected leaves from control and P. viburni infested tomato plants from day 57. Figure 2A shows the reflectance spectra of leaves from both treatments. The thick lines (green/continuous and red/dashed) are, respectively, the average spectra of the control and infested plant leaves. The green and white bands around these lines represent the respective standard deviations. Although the reflectance spectra of leaves from infested and control plants are not significantly different there is a tendency for the infested plants to reflect less in the NIR. Figure 2B shows a PCA of second derivative transformation of absorbance. There is a clear separation between classes in the second principal component (green squares = control, red circles = infested), ellipses represent a Mahalanobis distance of 2 to the center of each group. Mealybugs seem to be responsible for 12.52% of all variability of the 2nd derivative spectra. In Figure 2C, the separation parameter calculated from the same transformed spectra is shown for all measured wavelengths. Absorbance differences between both treatments are clearly distinguishable in the wavelength band of 800 nm to 1,000 nm. In Figure 2D, a PCA biplot of scores and loadings is presented. The points correspond to plants (and not leaves, as in the Figure 2B) and the observables are now the
(1)
V o l u m e 8 2 | I s s u e 3 | J u n e 2 0 1 7 143
Canário et al. | Detecting early mealybug infestation stages on tomato plants using optical spectroscopy
Data analysis
The leaf reflectance analysis was performed using the R programming (R Core Team, 2015). The reflectance (R) was converted to absorbance (A) by applying the Beer-Lambert law (Equation 2).
3 | P a g e
for each plant, plant height, the width and length of the biggest photosynthetically active leaf was measured, mealybug density and the presence of other pests were registered. For each pest, a pest density was defined per plant as follows: low (L), less than 10 pests detected; medium (M), 10–20 pests detected; and severe (S), >20 pests detected. In the last week of the trial, five healthy leaves (not chlorotic or damaged) per plant were chosen randomly and leaf size and reflectance and transmittance was measured. The aim of the latter trial was to record reflectance in one day in five randomly chosen leaves per plant. The reflectance (R) or transmittance (T) of each sample (S) was converted using the reference spectra (W) and dark counts (D) for values near reality (without the influence of noise associated with the equipment) using Equation 1:
� �� � � ������ (1)
Data analysis
The leaf reflectance analysis was performed using the R programming (R Core Team, 2015). The reflectance (R) was converted to absorbance (A) by applying the Beer-Lambert law (Equation 2).
� � ����� � � � ������) (2)
In the case of the reflectance of randomly selected leaves (measurements of the last day only), several transformations were applied to reduce data variability including, Multiplicative Scatter Correction (MSC) (Isaksson and Næs, 1988) and a Savitzky-Golay (SG) filter (Savitzky and Golay, 1964). These are well-known transformations in spectroscopy. The MSC transformation compensates for vertical shifts in the spectra caused by light scattering, and establishes a linear fit between each spectrum and the average spectrum. The SG filter is a moving polynomial filter that smooths the derivation.
Principal Component Analysis (PCA) was performed for the randomly selected leaves after each transformation. To establish which wavelengths best separates the infested and control plants a separation parameter was calculated using Equation 3. In the equation, mC and mI were defined as, respectively, the average values of the second derivative of the absorbance of control (C) and infested (I) plant leaves. sC and sI were the standard deviation of the second derivative of the absorbance of control (C) and infested (I) plant leaves, respectively. This simple parameter illustrates the intuitive concept that two groups are clearly separable when their measurements produce error bars that do not overlap. Therefore, separation is clear when |sep| >1.
��� �������)������) (3)
Results
Qualitative and quantitative description of plants
Table 1 shows the results of field data analysis. Initially infestation levels of all pests, other than the mealybug, were low, but increased as the trial progressed, especially in the case of aphids and Tuta absoluta. Mealybugs maintained high populations in nearly 50% of infested plants throughout the trial, while aphids and T. absoluta only by mid-September reached important populations. Figure 1 shows on the left-hand side mealybug infested plants and on the right-hand side control plants. Visual changes could be seen on some leaves, that could be associated with mealybugs, such as leaf wilting and leaf chlorosis/necrosis. Table 2 shows the results of a Student’s t-test to the null hypothesis: the means of control and infected groups are equal in day 57. Based on field data, significant differences (95% confidence) were found between control and infested plants for mealybug populations, plant height and length of the biggest photosynthetically active leaf, but no significant differences were found for T. absoluta and aphid populations. Reflectance measurement of randomly selected leaves
Figures 2A–D show the results obtained on randomly selected leaves from control and P. viburni infested tomato plants from day 57. Figure 2A shows the reflectance spectra of leaves from both treatments. The thick lines (green/continuous and red/dashed) are, respectively, the average spectra of the control and infested plant leaves. The green and white bands around these lines represent the respective standard deviations. Although the reflectance spectra of leaves from infested and control plants are not significantly different there is a tendency for the infested plants to reflect less in the NIR. Figure 2B shows a PCA of second derivative transformation of absorbance. There is a clear separation between classes in the second principal component (green squares = control, red circles = infested), ellipses represent a Mahalanobis distance of 2 to the center of each group. Mealybugs seem to be responsible for 12.52% of all variability of the 2nd derivative spectra. In Figure 2C, the separation parameter calculated from the same transformed spectra is shown for all measured wavelengths. Absorbance differences between both treatments are clearly distinguishable in the wavelength band of 800 nm to 1,000 nm. In Figure 2D, a PCA biplot of scores and loadings is presented. The points correspond to plants (and not leaves, as in the Figure 2B) and the observables are now the plant attributes (plant height, leaf area, presence of T. absoluta populations, presence of aphids, presence of mealybugs,
(2) In the case of the reflectance of randomly selected leaves (measurements of the last day only), several transformations were applied to reduce data variability including, Multiplicative Scatter Correction (MSC) (Isaksson and Næs, 1988) and a Savitzky-Golay (SG) filter (Savitzky and Golay, 1964). These are well-known transformations in spectroscopy. The MSC transformation compensates for vertical shifts in the spectra caused by light scattering, and establishes a linear fit between each spectrum and the average spectrum. The SG filter is a moving polynomial filter that smooths the derivation.
Principal Component Analysis (PCA) was performed for the randomly selected leaves after each transformation. To establish which wavelengths best separates the infested and control plants a separation parameter was calculated using Equation 3. In the equation, mC and mI were defined as, respectively, the average values of the second derivative of the absorbance of control (C) and infested (I) plant leaves. sC and sI were the standard deviation of the second derivative of the absorbance of control (C) and infested (I) plant leaves, respectively. This simple parameter illustrates the intuitive concept that two groups are clearly separable when their measurements produce error bars that do not overlap. Therefore, separation is clear when |sep| >1.
(3)
Results
Qualitative and quantitative description of plants
Table 1 shows the results of field data analysis. Initially infestation levels of all pests, other than the mealybug, were
low, but increased as the trial progressed, especially in the case of aphids and Tuta absoluta. Mealybugs maintained high populations in nearly 50% of infested plants throughout the trial, while aphids and T. absoluta only by mid-September reached important populations. Figure 1 shows on the left-hand side mealybug infested plants and on the right-left-hand side control plants. Visual changes could be seen on some leaves, that could be associated with mealybugs, such as leaf wilting and leaf chlorosis/necrosis. Table 2 shows the results of a Student’s t-test to the null hypothesis: the means of control and infected groups are equal in day 57. Based on field data, significant differences (95% confidence) were found between control and infested plants for mealybug populations, plant height and length of the biggest photosynthetically active leaf, but no significant differences were found for T. absoluta and aphid populations.
Reflectance measurement of randomly selected leaves
Figures 2A–D show the results obtained on randomly selected leaves from control and P. viburni infested tomato plants from day 57. Figure 2A shows the reflectance spectra of leaves from both treatments. The thick lines (green/ continuous and red/dashed) are, respectively, the average spectra of the control and infested plant leaves. The green and white bands around these lines represent the respective standard deviations. Although the reflectance spectra of leaves from infested and control plants are not significantly different there is a tendency for the infested plants to reflect
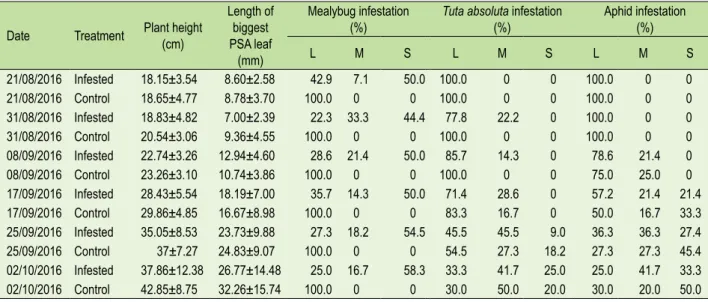
Table 1. Quantitative and qualitative analysis of field data collected from infested and control plants. Measured parameters
were plant height, length of biggest photosynthetically active leaf and the three most important pest densities recorded in the field (mealybug, Tuta absoluta and aphid). Infestation levels were defined as low (L), medium (M) and severe (S) and pest densities were presented as relative frequencies to the total number of plants per treatment.
Date Treatment Plant height (cm)
Length of biggest PSA leaf
(mm)
Mealybug infestation
(%) Tuta absoluta infestation (%) Aphid infestation (%)
L M S L M S L M S 21/08/2016 Infested 18.15±3.54 8.60±2.58 42.9 7.1 50.0 100.0 0 0 100.0 0 0 21/08/2016 Control 18.65±4.77 8.78±3.70 100.0 0 0 100.0 0 0 100.0 0 0 31/08/2016 Infested 18.83±4.82 7.00±2.39 22.3 33.3 44.4 77.8 22.2 0 100.0 0 0 31/08/2016 Control 20.54±3.06 9.36±4.55 100.0 0 0 100.0 0 0 100.0 0 0 08/09/2016 Infested 22.74±3.26 12.94±4.60 28.6 21.4 50.0 85.7 14.3 0 78.6 21.4 0 08/09/2016 Control 23.26±3.10 10.74±3.86 100.0 0 0 100.0 0 0 75.0 25.0 0 17/09/2016 Infested 28.43±5.54 18.19±7.00 35.7 14.3 50.0 71.4 28.6 0 57.2 21.4 21.4 17/09/2016 Control 29.86±4.85 16.67±8.98 100.0 0 0 83.3 16.7 0 50.0 16.7 33.3 25/09/2016 Infested 35.05±8.53 23.73±9.88 27.3 18.2 54.5 45.5 45.5 9.0 36.3 36.3 27.4 25/09/2016 Control 37±7.27 24.83±9.07 100.0 0 0 54.5 27.3 18.2 27.3 27.3 45.4 02/10/2016 Infested 37.86±12.38 26.77±14.48 25.0 16.7 58.3 33.3 41.7 25.0 25.0 41.7 33.3 02/10/2016 Control 42.85±8.75 32.26±15.74 100.0 0 0 30.0 50.0 20.0 30.0 20.0 50.0
Table 2. Results (p-values) from the application of Student’s
t-test to the null hypothesis that the means of control and
infested groups are equal in day 57 (95% confidence level).
Height 0.016 TRUE
Leaf length 0.014 TRUE
Tuta 0.966 FALSE
Aphids 0.351 FALSE
Mealybugs 1.75E-006 TRUE
Ants 0.162 FALSE
Virus 0.083 FALSE
3 | P a g e
Reflectance measurements were taken six times at 10-day intervals from one week after the acclimation period of the plants and two weeks before the removal of the cover (21st of August and the 2nd of October 2015). Additionally, for each plant, plant height, the width and length of the biggest photosynthetically active leaf was measured, mealybug density and the presence of other pests were registered. For each pest, a pest density was defined per plant as follows: low (L), less than 10 pests detected; medium (M), 10–20 pests detected; and severe (S), >20 pests detected. In the last week of the trial, five healthy leaves (not chlorotic or damaged) per plant were chosen randomly and leaf size and reflectance and transmittance was measured. The aim of the latter trial was to record reflectance in one day in five randomly chosen leaves per plant. The reflectance (R) or transmittance (T) of each sample (S) was converted using the reference spectra (W) and dark counts (D) for values near reality (without the influence of noise associated with the equipment) using Equation 1:
� �� � � ������ (1)
Data analysis
The leaf reflectance analysis was performed using the R programming (R Core Team, 2015). The reflectance (R) was converted to absorbance (A) by applying the Beer-Lambert law (Equation 2).
� � ����� � � � ������) (2)
In the case of the reflectance of randomly selected leaves (measurements of the last day only), several transformations were applied to reduce data variability including, Multiplicative Scatter Correction (MSC) (Isaksson and Næs, 1988) and a Savitzky-Golay (SG) filter (Savitzky and Golay, 1964). These are well-known transformations in spectroscopy. The MSC transformation compensates for vertical shifts in the spectra caused by light scattering, and establishes a linear fit between each spectrum and the average spectrum. The SG filter is a moving polynomial filter that smooths the derivation.
Principal Component Analysis (PCA) was performed for the randomly selected leaves after each transformation. To establish which wavelengths best separates the infested and control plants a separation parameter was calculated using Equation 3. In the equation, mC and mI were defined as, respectively, the average values of the second derivative of the absorbance of control (C) and infested (I) plant leaves. sC and sI were the standard deviation of the second derivative of the absorbance of control (C) and infested (I) plant leaves, respectively. This simple parameter illustrates the intuitive concept that two groups are clearly separable when their measurements produce error bars that do not overlap. Therefore, separation is clear when |sep| >1.
��� �������)������) (3)
Results
Qualitative and quantitative description of plants
Table 1 shows the results of field data analysis. Initially infestation levels of all pests, other than the mealybug, were low, but increased as the trial progressed, especially in the case of aphids and Tuta absoluta. Mealybugs maintained high populations in nearly 50% of infested plants throughout the trial, while aphids and T. absoluta only by mid-September reached important populations. Figure 1 shows on the left-hand side mealybug infested plants and on the right-hand side control plants. Visual changes could be seen on some leaves, that could be associated with mealybugs, such as leaf wilting and leaf chlorosis/necrosis. Table 2 shows the results of a Student’s t-test to the null hypothesis: the means of control and infected groups are equal in day 57. Based on field data, significant differences (95% confidence) were found between control and infested plants for mealybug populations, plant height and length of the biggest photosynthetically active leaf, but no significant differences were found for T. absoluta and aphid populations.
Reflectance measurement of randomly selected leaves
Figures 2A–D show the results obtained on randomly selected leaves from control and P. viburni infested tomato plants from day 57. Figure 2A shows the reflectance spectra of leaves from both treatments. The thick lines (green/continuous and red/dashed) are, respectively, the average spectra of the control and infested plant leaves. The green and white bands around these lines represent the respective standard deviations. Although the reflectance spectra of leaves from infested and control plants are not significantly different there is a tendency for the infested plants to reflect less in the NIR. Figure 2B shows a PCA of second derivative transformation of absorbance. There is a clear separation between classes in the second principal component (green squares = control, red circles = infested), ellipses represent a Mahalanobis distance of 2 to the center of each group. Mealybugs seem to be responsible for 12.52% of all variability of the 2nd derivative spectra. In Figure 2C, the separation parameter calculated from the same transformed spectra is shown for all measured wavelengths. Absorbance differences between both treatments are clearly distinguishable in the wavelength band of 800 nm to 1,000 nm. In Figure 2D, a PCA biplot of scores and loadings is presented. The points correspond to plants (and not leaves, as in the Figure 2B) and the observables are now the plant attributes (plant height, leaf area, presence of T. absoluta populations, presence of aphids, presence of mealybugs,
144 E u r o p e a n J o u r n a l o f H o r t i c u l t u r a l S c i e n c e Canário et al. | Detecting early mealybug infestation stages on tomato plants using optical spectroscopy
8 | P a g e
FIGURE 1. Infested plant (left) and control plant (right).
Figure 1. Infested plant (left) and control plant (right).
9 | P a g e
FIGURE 2. A) Reflectance spectra obtained of randomly selected leaves from control and P. viburni infested tomato plants on day 57 after the mealybug inoculation. The thick lines (green/continuous and red/dashed) are, respectively, the average spectra of the control and infested plant leaves. The green and white bands around these lines represent the respective standard deviations. B) PCA of the 2nd derivative transformation on absorbance (green squares = control, red circles = infested) of randomly selected leaves of control and P. viburni infested tomato plants on day 57 after the mealybug inoculation. C) Separation parameter from the 2nd derivative transformed spectra of randomly selected leaves of control and P. viburni infested tomato plants on day 57 after the mealybug inoculation. D) Results obtained on randomly selected leaves of control and P. viburni infested tomato plants on day 57 after the mealybug inoculation. PCA biplot. The points correspond to plants and the observables are plant attributes (height, leaf area, presence of
T. absoluta populations, presence of aphids, presence of mealybugs, presence of ants, virus infection).
Figure 2. A) Reflectance spectra obtained of randomly selected leaves from control and P. viburni-infested tomato plants on
day 57 after the mealybug inoculation. The thick lines (green/continuous and red/dashed) are, respectively, the average spectra of the control and infested plant leaves. The green and white bands around these lines represent the respective standard deviations. B) PCA of the 2nd derivative transformation on absorbance (green squares = control, red circles = infested) of randomly selected leaves of control and P. viburni-infested tomato plants on day 57 after the mealybug inoculation. C) Separation parameter from the 2nd derivative transformed spectra of randomly selected leaves of control and P. viburni- infested tomato plants on day 57 after the mealybug inoculation. D) Results obtained on randomly selected leaves of control and P. viburni-infested tomato plants on day 57 after the mealybug inoculation. PCA biplot. The points correspond to plants and the observables are plant attributes (height, leaf area, presence of T. absoluta populations, presence of aphids, presence of mealybugs, presence of ants, virus infection).
V o l u m e 8 2 | I s s u e 3 | J u n e 2 0 1 7 145 less in the NIR. Figure 2B shows a PCA of second derivative
transformation of absorbance. There is a clear separation between classes in the second principal component (green squares = control, red circles = infested), ellipses represent a Mahalanobis distance of 2 to the center of each group. Mealybugs seem to be responsible for 12.52% of all variability of the 2nd derivative spectra. In Figure 2C, the separation parameter calculated from the same transformed spectra is shown for all measured wavelengths. Absorbance differences between both treatments are clearly distinguishable in the wavelength band of 800 nm to 1,000 nm. In Figure 2D, a PCA biplot of scores and loadings is presented. The points correspond to plants (and not leaves, as in the Figure 2B) and the observables are now the plant attributes (plant height, leaf area, presence of T. absoluta populations, presence of aphids, presence of mealybugs, presence of ants and virus infection) and not the spectral data. Control plants had a tendency to be taller, photosynthetically active leaves selected were bigger and the aphid and T. absoluta populations were more numerous. On the other hand, P. viburni-infested plants tended to have bigger populations of ants. However, the separation of control and mealybug inoculated plants is not as clear using plant attributes as the separation obtained by PCA of second derivative transformations of leave absorbance.
Time evolution of absorbance measurements of selected leaves
PCA using longitudinal measurement of direct reflectance values (e.g., for the same leaf across time) at 680 and 900 nm (Figures 3 and 4) showed that the evolution across time of reflectance for control and infected plants was clearly opposite at 900 nm. Discrimination between the control and infested group was possible at days 25 and 57 but not at other time points. PCA analysis carried out on the spectra of leaves from a single time point, which corresponded to the last time point (57 days) of the longitudinal series, meant that a greater number of leaves could be analysed. The results of PCA for the single time point measurement (Figure 2) showed clear separation between the control and
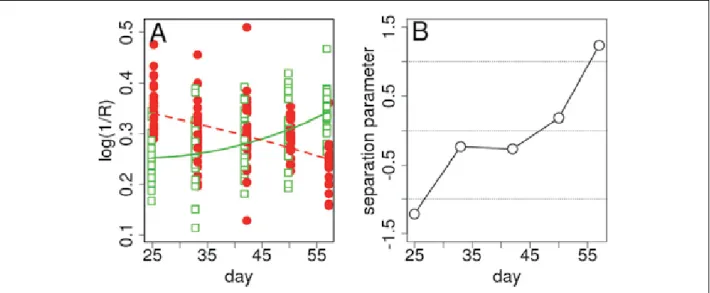
infested groups. There is a clear indication that on day 57 it is possible to identify the infested plants using absorbance measurements. However, measurement over time on fewer leaves per day did not yield the same degree of separation between the mealybug inoculated and control plants, except on the first day (results not shown). Figure 3A gives us an insight into how absorbance changed over time during the experiment and presents the leaf absorbance at 900 nm (NIR plateau), in relation to the number of days since the inoculation of infested plants with P. viburni egg masses. The first reflectance measurements are not presented as good reflectance readings were not obtained. In general, infested plants had a higher average absorbance than control plants up until 45 days after inoculation. From day 45 onwards, the average absorbance of infested plants became lower than control plants. The absorbance of leaves from infested and control plants were clearly distinguishable on days 25 and 57 (Figure 3B) and even if the absorbance of leaves of the two groups were undistinguishable on days 33 to 50, taking into consideration the global pattern it was possible to trace each sample to its group.
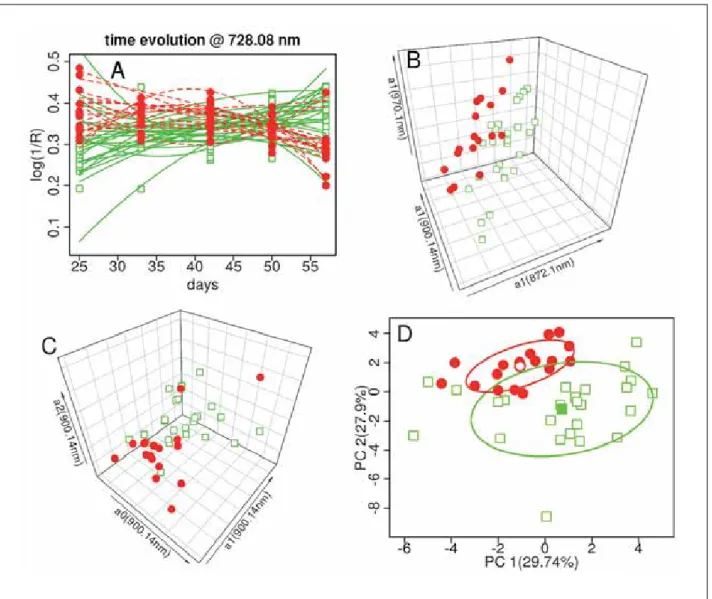
The global pattern of absorbance and its evolution over the experiment is illustrated in Figure 4. Figure 4A shows the leaf absorbance during the experiment at 728 nm (although to facilitate visualization not all leaves are shown) and is fitted with a 2nd order polynomial (A=a0+a1x+a2x², x = day). The basic idea being tested was that the absorbance of control and infested leaves should evolve slightly differently and yield different fitting parameters. This hypothesis was confirmed as illustrated by Figure 4B, where each point represents a leaf and the three axes correspond to the a1 coefficients for the wavelengths of 872, 900 and 970 nm (a1 was the most important coefficient since the patterns are approximately linear in most cases; there are less samples in this plot because only leaves surviving at least 4 measurement days were considered). The infested leaves are represented by red circles and the control by green squares. There was clear group-specific clustering, showing that the shapes of the absorbance evolution curves differed between control and infested plants and were parameterised by
Figure 3. A) Evolution of absorbance at 900 nm (NIR plateau) of leaves from infested and control plants, in relation to the
number of days since the inoculation of infested plants with P. viburni egg masses (green squares = control, red circles = infested). B) Separation parameter of the evolution of absorbance at 900 nm (NIR plateau) of leaves from infested and control plants in relation to the number of days since the inoculation of infested plants with P. viburni egg masses.
10 | P a g e
FIGURE 3. A) Evolution of absorbance at 900 nm (NIR plateau) of leaves from infested and control plants, in relation to
the number of days since the inoculation of infested plants with P. viburni egg masses (green squares = control, red circles = infested). B) Separation parameter of the evolution of absorbance at 900 nm (NIR plateau) of leaves from infested and control plants in relation to the number of days since the inoculation of infested plants with P. viburni egg masses.
146 E u r o p e a n J o u r n a l o f H o r t i c u l t u r a l S c i e n c e Canário et al. | Detecting early mealybug infestation stages on tomato plants using optical spectroscopy
different coefficients. Figure 4C is similar to 4B but the axis corresponds to a0, a1 and a2 for a single wavelength, 900 nm. Finally, the a0, a1 and a2 coefficients for different wavelengths were grouped in a matrix (leaves × fit coefficients) and then subject to PCA. The result of the PCA analysis is shown in Figure 4D. Separation of the control and infested plants’ data occurred, but differences were obtained from the time evolution measurements and also from simple absorbance measurements.
Discussion
The use of optical spectroscopy to detect P. viburni by non-invasive means was successful, as P. viburni-infested leaves were clearly distinguished from control leaves when these were randomly selected for a one-time measurement or tracked through time. In the randomly selected leaves experiment, following a second derivative transformation of the data and PCA it was possible to differentiate P. viburni-infested leaves from control leaves. However, it is important to stress that our results focused on the detection of stress symptoms caused by mealybugs and not the mealybugs themselves and that only two infestation levels were used:
none (control) and plants inoculated with 3 P. viburni egg masses. It will be of interest in the future to establish the sensitivity of the method by analysing plants with more infestation levels.
Leaves from the infested treatment tended to reflect less radiation in the 800–1,000 nm wavelengths than that of the control treatment. These results are similar to what Xu et al. (2007) found when using a Fourier transform NIR system to detect leaf miner in tomato leaves. Leaf miners cause visible damage to leaves and the collapse in the leaves’ internal structure caused by the leaf-mining was shown to affect their optical properties. In contrast, P. viburni populations are mainly located on plant stems and do not cause visible damage to leaves, and it was not possible to pinpoint the anatomical and physiological causes responsible for the change in the optical properties of the leaves from infested plants.
A PCA of registered field data (plant height, biggest photosynthetically active leaf ’s length, presence of T.
abso-luta populations, presence of aphids, presence of mealybugs,
presence of ants, virus infection) on day 57 showed that the control plants tended to be marginally taller with bigger
pho-11 | P a g e
FIGURE 4. A) Evolution of leaf absorbance at 728 nm, fitted with a 2nd order polynomial. B) Evolution of leaf absorbance (each point represents a leaf) for three a1 coefficient axis of the 872, 900 and 970 nm wavelengths. C) Evolution of leaf absorbance at 900 nm, where each point represents a leaf and the three axis correspond to a0, a1 and a2. D) PCA of the matrix (leaves × fit coefficients), where the fit coefficients are the a0, a1 and a2 coefficients for different wavelengths.
Figure 4. A) Evolution of leaf absorbance at 728 nm, fitted with a 2nd order polynomial. B) Evolution of leaf absorbance (each
point represents a leaf) for three a1 coefficient axes of the 872, 900 and 970 nm wavelengths. C) Evolution of leaf absorbance at 900 nm, where each point represents a leaf and the three axes correspond to a0, a1 and a2. D) PCA of the matrix (leaves × fit coefficients), where the fit coefficients are the a0, a1 and a2 coefficients for different wavelengths.
V o l u m e 8 2 | I s s u e 3 | J u n e 2 0 1 7 147 tosynthetically active leaves than the infested plants, which
would be expected as a result of a reduction of available resources for photosynthesis, due to phytophagy and acti-vation of plant defence systems, in the infested plants. As a consequence of the experiment being conducted in field con-ditions, the plants could not be isolated from other inevitable biotic stresses, such as the presence of aphids, ants and T.
ab-soluta. These affected equally control and experimentally
in-fected groups. Hence, the results gain more significance, as they show that it is possible to detect the biotic stress caused by the mealybug infestation even when other biotic stresses are present. The assumption that both treatments would be similarly affected by other pests may be challenged by the Plant Stress Hypothesis proposed by White in 1984, where-by herbivore abundance would be higher on stressed host plants as a result of increased availability of nutrients, a de-creased concentration of defence compounds and/or chang-es in the ratio of nutrients to chemical defencchang-es (Cornelissen et al., 2008). However, pest populations were monitored and did not show relevant differences between the control and infested plants with the exception of P. viburni.
At the 680 nm wavelength (photosystem’s II reaction centre; results not shown), the absorbance of mealybug infested leaves tracked through time appeared to be higher than that of control leaves at day 25, but the two could not be distinguished by the separation parameter. As time progressed, there was the tendency for absorbance to decrease in infested leaves although this was not clearly distinguished by the separation parameter that was close to its borderline by day 57. This may indicate that over time P. viburni was affecting chlorophyll leaf content and the photosystem II reaction centre. Prabhakar et al. (2013) observed, when studying the impact on cotton of Phenacoccus
solenopsis Tinsley, that the 674 nm wavelength was very
sensitive to the pest and found that infested plants tended to have a lower leaf chlorophyll content than control plants, without modifying the chlorophyll a and b ratio. At 900 nm wavelength the infested leaves initially showed distinctively higher absorbance than control leaves, possibly as a result of early stage plant defence mechanisms against phytophagy. Little information is available about plant responses to piercing/sucking/mining/lacerating insects (most studies have focused on insects that cause extensive plant damage) but, based on available studies on piercing/sucking insects, these seem to induce the defence-signalling pathways most commonly activated by bacterial, fungal and viral pathogens (Walling, 2000). Chen (2008) stated that plants have developed various defences against insect herbivores, such as cell wall fortifications, hypersensitive responses, defensive proteins and secondary metabolites. Cell wall modifications could potentially affect the optical properties of leaves, but further studies will be required to test this possibility.
Over time, the NIR absorption decreased in leaves from infested plants, while it increased in leaves from control plants and was significantly different by day 57. The decrease in NIR absorption by infested leaves may be a result of changes in carbohydrate partitioning at the plant level, as the infesting P. viburni populations compete with other plant sinks for assimilates. P. viburni end up inducing mature leaves to abnormally import assimilates from other mature leaves and consequently cause a reduction in growth and leaf senescence and shedding (Vranjic, 1997; Dickson and Isebrands, 1991). The increase in NIR absorption by control leaves could also be explained by a transition of sink leaves into source leaves, as these mature through time,
consequently leading to a bigger storage of carbohydrates for use in the synthesis of storage compounds (e.g., starch), metabolic utilization or for synthesis of transport compounds (Taiz and Zeiger, 2002). Separation based on absorbance between the control and infested plants was possible at day 22, but our results suggest that a stable separation pattern was only reached from 57 days onwards. It may be argued that 57 days does not constitute early detection and that by that time visual inspection would be enough. This may be true for small crop areas, but our study may be relevant in the context of large plant production areas and for implementation of automated/remote screening of plants. Reflectance spectroscopy is easy to implement (unlike other techniques such as, e.g., fluorescence) and could be used to detect local, consistent, variations using the spectral zones identified in this study and thus could pinpoint infestation spots before they spread.
Conclusions
Optical spectroscopy proved useful in the detection of early infestation stages of P. viburni in tomato plants, as leaf reflection measurements of randomly selected leaves, 57 days from inoculation, distinguished effectively control and infested plants, even in the presence of other pests. Leaf absorption of leaves from infested plants relative to control plants tended to progressively decrease with time in the photosystem II (680 nm) and NIR plateau (900 nm) wavelengths. In conclusion, optical spectroscopy could be used to detect stress induced by pests and contribute to further our understanding of how pests affect plants. Specifically, in relation to the mealybug, more research under realistic conditions and in the presence of other stress factors is required before a definitive conclusion may be reached about the applicability of optical methods as detection tools at a production scale.
Acknowledgments
This work received national funds through FCT - Founda-tion for Science and Technology, Portugal, through the Cen-tre for Electronics, Optoelectronics and Telecommunications (CEOT) project UID/Multi/00631/2013. The authors thank CEOT (Centro de Electrónica, Optoelectrónica e Telecomuni-cações) and the Direcção Regional de Agricultura do Algarve for the assistance provided throughout the study.
References
Afonso, A.M., Guerra, R., Cavaco, A.M., Duarte, A., Power, D.M., and Marques, N. (2015). Assessing the ability of optical methods to detect early Citrus tristeza virus infection. In Proceedings of the XVIII International Plant Protection Congress (IPPC) 2015. (Berlin, Germany: Free University Berlin).
Canário, D.V.P. (2016). A problemática das cochonilhas-algodão em cultura protegida de hortícolas na região Oeste (Lisboa, Portugal: Instituto Superior de Agronomia), Master Thesis, 83 pp.
Chen, M.S. (2008). Inducible direct plant defense against insect herbivores: A review. Insect Sci. 15, 101–114. https://doi. org/10.1111/j.1744-7917.2008.00190.x.
Cornelissen, T., Fernandes G.W., and Vasconcellos-Neto, J. (2008). Size does matter: variation in herbivory between and within plants and the plant vigor hypothesis. Oikos 117, 1121–1130. https://doi. org/10.1111/j.0030-1299.2008.16588.x.
148 E u r o p e a n J o u r n a l o f H o r t i c u l t u r a l S c i e n c e Canário et al. | Detecting early mealybug infestation stages on tomato plants using optical spectroscopy
Dickson, R.E., and Isebrands, J.G. (1991). Leaves as regulators of stress response. In Response of Plants to Multiple Stresses, H.A. Mooney, W.E. Winner, and E.J. Pell, eds. (Amsterdam, the Netherlands: Elsevier Academic Press), p. 3–34. https://doi.org/10.1016/B978-0-08-092483-0.50006-2.
Golan, K., Rubinowska, K., Kmieć, K., Kot, I., Górska-Drabik, E., Łagowska, B., and Michałek, W. (2015). Impact of scale insect infestation on the content of photosynthetic pigments and chlorophyll fluorescence in two host plant species. Arthropod-Plant Interact. 9, 55–65. https://doi.org/10.1007/s11829-014-9339-7. Graeff, S., Link, J., and Claupein, W. (2006). Identification of powdery mildew (Erysiphe graminis sp. tritici) and take-all disease (Gaeumannomyces graminis sp. tritici) in wheat (Triticum aestivum L.) by means of leaf reflectance measurements. Open Life Sci. 1, 275– 288. https://doi.org/10.2478/s11535-006-0020-8.
Isaksson, T., and Næs, T. (1988). The effect of Multiplicative Scatter Correction (MSC) and linearity improvement in NIR spectroscopy. Appl. Spectrosc. 42, 1273–1284. https://doi. org/10.1366/0003702884429869.
Jacobson, R. (2002). Protected tomato: Integrated control of mealybugs. (Selby, UK: Stockbridge Technology Centre Ltd. and AHDB Horticulture).
Miranda, C.S., Henriques, S., Rodrigues, L., Rodrigues, A.S., Monteiro, A.A., Caço, J., Reis, M., and Antunes, L.E. (2004). Manual de Culturas Hortícolas sem solo (Torres Vedras, Portugal: Associação Interprofissional de Horticultura do Oeste).
Prabhakar, M., Prasad, Y.G., Vennila, S., Thirupathi, M., Sreedevi, G., Rao, G.R., and Venkateswarlu, B. (2013). Hyperspectral indices for assessing damage by the solenopsis mealybug (Hemiptera: Pseudococcidae) in cotton. Comput. and Electron. in Agric. 97, 61– 70. https://doi.org/10.1016/j.compag.2013.07.004.
Raschka, S. (2015). http://sebastianraschka.com/Articles/2015_ pca_in_3_steps.html (accessed Jan. 5, 2016).
R Core Team (2015). R Foundation for Statistical Computing, https:// www.r-project.org/ (accessed Jan. 14, 2016).
Salmerón, J.M. (2011). Prospección e identificación de cochinillas algodonosas (Hemiptera: Pseudococcidae) y búsqueda de parasitoides asociados en cultivos hortícolas protegidos del poniente almeriense (Almeria, Spain: Universidad de Almeria).
Sankaran, S., Mishra, A., Ehsani, R., and Davis, C. (2010). A review of advanced techniques for detecting plant diseases. Comput. and Electron. in Agric. 72, 1–13. https://doi.org/10.1016/j. compag.2010.02.007.
Savitzky, A., and Golay, M.J. (1964). Smoothing and differentiation of data by simplified least squares procedures. Anal. Chem. 36, 1627– 1639. https://doi.org/10.1021/ac60214a047.
Taiz, L., and Zeiger, E. (2002). Photosynthesis: physiological and ecological considerations. In Plant Physiology, T. Lazar, ed. (Massachusetts, US: Sinauer Associates), p. 171–192.
Vranjic, J.A. (1997). Effects on host plant. In Soft Scale Insects – Their Biology, Natural Enemies and Control. In World Crop Pests, Y. Ben-Dov, and C.J. Hodgson, eds. (Amsterdam, the Netherlands: Elsevier Academic Press), p. 323–336. https://doi.org/10.1016/S1572-4379(97)80061-9.
Walling, L.L. (2000). The myriad plant responses to herbivores. J. of Plant Growth Regul. 19, 195–216.
Xu, H.R., Ying, Y.B., Fu, X.P., and Zhu, S.P. (2007). Near-infrared Spectroscopy in detecting Leaf Miner damage on tomato leaf. Biosyst. Eng. 96, 447–454. https://doi.org/10.1016/j. biosystemseng.2007.01.008.
Yang, C.M., Cheng, C.H., and Chen, R.K. (2007). Changes in spectral characteristics of rice canopy infested with brown planthopper and leaffolder. Crop Sci. 47, 329–335. https://doi.org/10.2135/ cropsci2006.05.0335.
Received: Jun. 6, 2016 Accepted: Oct. 4, 2016 Addresses of authors:
David V.P. Canário1,*, Elisabete Figueiredo2, José Carlos Franco3 and Rui Guerra4
1 Departamento de Ciências e Engenharia de Biossistemas, Instituto Superior de Agronomia, Tapada da Ajuda, 1349-017 Lisboa, Portugal
2 Departamento de Ciências e Engenharia de Biossistemas, Instituto Superior de Agronomia, Tapada da Ajuda, 1349-017 Lisboa, Portugal, Tel.: +351 213 653 128 + ext. 3225; Fax: +351 213 653 195; E-mail: [email protected]. pt
3 Departamento de Ciências e Engenharia de Biossistemas, Instituto Superior de Agronomia, Tapada da Ajuda, 1349-017 Lisboa, Portugal, Tel.: +351 213 653 100 + ext. 3226; Fax: +351 213 653 195; E-mail: [email protected] 4 Faculdade de Ciências e Tecnologia, Universidade do
Algarve, Campus de Gambelas, 8005-139 Faro, Portugal, Tel.: +351 289800900 + ext. 7474; E-mail: rguerra@ualg. pt.
*Corresponding author; E-mail: [email protected]
View publication stats View publication stats