Ex-regular Users of Public Transport: Their Reasons for Leaving and Returning
Ex-regular Users of Public Transport:
Their Reasons for Leaving and Returning
Paula Vicente and Elizabeth Reis
Instituto Universitário de Lisboa, Portugal
Abstract
This paper describes the characteristics of former regular users of public transport in the metropolitan area of Lisbon. It also examines why these people stopped using public transport and explores what would make them become regular users again. The empirical results revealed significant socio-demographic differences between current and ex-regular users, namely in relation to gender and social level. Differences were also found in travel characteristics, car ownership, and satisfaction with the transit service. The main reasons given by ex-regular users for no longer using public transport included changes in their lives (e.g., change in workplace/residence/ school or becoming unemployed) and the availability of alternative transport (e.g., company car). Although the likelihood of becoming a regular user again was very low (27%), the strongest potential motive for doing so was a change in workplace/residence/school. Based on the study’s empirical results, managerial implications for the public transport service are addressed in the conclusion.
Keywords: public transportation, passenger retention, service attributes
Introduction
Urban areas, home to more than half the world’s population, face unprecedented transport and mobility challenges. People are coming in increasing numbers from rural areas to cities, which intensifies travel demand. Because of urban sprawl, the distance between residential areas and functional destinations (places of
employment, markets, schools, and health services) has become greater, leading to a growing dependence on motorized transport (ITF 2011; Pourbaix 2011; United Nations 2012). Consequently, traffic jams are now the norm in many cities, impacting urban life through negative externalities such as air pollution, noise pollution, and high stress levels.
The UN Climate Summit in 2014 stated that “public transport benefits everyone and ensures that all cities and regions can work, grow and prosper,” and “the public transport sector is working consciously and innovatively to improve its already excellent carbon performance and enhance urban transport networks” (UITP 2014, p. 6). These two statements highlight the wide-ranging impact of the public transport sector on both society and the © 2018 Paula Vicente and Elizabeth Reis
https//doi.org/10.5038/2375-0901.21.2.7
ISSN: 1077-291X | Licenced under Creative Commons License Attribution - Noncommercial 4.0 The Journal of Public Transportation is published by the Center for Urban Transportation Research at the University of South Florida
environment, and underline the importance countries must give to making systematic improvements to their public transportation network (Cervero 2013) in order to raise the quality of life in urban areas. Many countries have been investing heavily in public transport systems to make them more convenient, more comfortable, faster, more environmentally friendly, and more competitive with other means of transport, most notably private cars (e.g., Buehler, Lukacs, and Zimmerman 2015; NTA 2016; TfL 2016). However, despite the growing efforts of public transit agencies to increase supply (quantitatively or qualitatively), the market share of public transit is still substantially lower than that of the automobile. London, Rome, Berlin, Barcelona, and Lisbon are examples of European cities where the share of commuting trips made by public transport is lower than that of private transport (LTA 2011). Similarly, many cities in the United States have seen a decline in public transit ridership (Orcutt 2017).
There are diverse reasons for the fall in public transit ridership. Bliss (2017) and Levinson (2017) point to economic factors such as decreasing oil prices, higher family incomes, easier credit access, and the expanding economy that encourage people to buy more cars and drive them more often. Moreover, in most developing countries, the middle-class population perceives car ownership as a symbol of status, individual freedom, and personal success, furthering the desire for car ownership and use (Steg 2005); these people generally consider public transit an inferior good, and its use declines as their incomes rise (Levinson 2017). Orcutt (2017) adds that the falling demand for public transport is explained by a decline in the quality of the service; overcrowded buses and subways, delays, equipment that is in poor condition or out of service, all tend to discourage people away from public transport and to more reliable alternatives such as the private car, Uber, and related services. When we consider all these reasons, it is no wonder people think that owning and using a car is the most desirable mobility solution (Acharya and Morichi 2007).
Recent research emphasizes the importance of promoting individual and societal behaviors that boost public transport usage and discourage the use of private cars (European Commission 2013; OECD/ITF 2014). Therefore, it is crucial to understand which factors influence the decision to use public transport, and learn about
commuting patterns and how the quality of public transport is perceived, so that strategies can be designed to ensure that current passengers continue using the service and new passengers can be attracted (Beirão and Cabral 2007; Fellesson and Friman 2008; Fujii and Kitamura 2003). Many studies have sought to identify the key factors for passenger loyalty use of public transport service. While some of these focus on the effects of service quality (Imaz et al. 2015; Lai and Chen 2011; Lei and Mac 2005; Schiefelbusch and Dienel 2009) and others on the effects of passenger satisfaction (Eboli and Mazzulla 2011; Shiftan, Barlach, and Shefer 2015; van Lierop and El-Geneidy 2016; Wen, Lan, and Chang 2005), all base their conclusions on information collected from public transport users. Less is known about ex-users, people who previously used public transport regularly but no longer do so. However, past research suggests it may be more cost-effective to retain existing passengers than to attract new ones (Hoffman, Kelley, and Chung. 2003; Murphy et al. 2006; Venetis and Ghauri 2004); listening to what former public transit users say about travel decisions, perceptions of service quality, and why they no longer use the service may therefore help public transit operators determine how to stop losing current passengers. This paper seeks to describe ex-regular users of public transport in the metropolitan area of Lisbon, specifically to do the following:
a) Identify socio-demographic differences between ex-regular and regular users b) Describe ex-regular users’ perceptions of transit service quality
c) Understand why ex-regular users stopped using public transport
As the mobility challenges in the metropolitan area of Lisbon are similar to those of other major European cities, the paper contributes to the discussion on the promotion of public transport usage. Implications for future research as well as recommendations for public transport management and operators are presented.
Traveling in the Metropolitan Area of Lisbon
The metropolitan area of Lisbon (MAL) has 2.8 million inhabitants. With the Lisbon municipality at its center, it is the biggest metropolitan area in Portugal encompassing 18 municipalities spread over nearly 3,000 km2 to the
north and south of the Tagus River estuary. Between 2001 and 2011 the number of MAL residents rose by 6% thanks to population migration from small towns and villages and also immigration (Statistics Portugal 2011). The evolution of the resident population in MAL has led to a process of suburbanization spreading to territories farther from Lisbon. Between 1991 and 2011, the population in the Lisbon municipality fell by more than 15%, while some more peripheral municipalities saw a rise of more than 30% (Statistics Portugal 2011).
In terms of commuting trips, the percentage of journeys involving the Lisbon municipality decreased from around 50% in 1991 to 37% in 2011. This was accompanied by an increase in trips within and between the peripheral municipalities of MAL (Statistics Portugal 2011). Nevertheless, 60% of the commuting trips made by public transport go through the municipality of Lisbon. This is due in part to the way in which the public transport supply is structured, which is mostly designed to respond to the large flows that begin or end in the Lisbon municipality (MALT 2014a).
The public transport service in MAL is made up of buses, railway (subway, train, and tram), and ferry. The bus is the mode with the most users (more than 50% of public transport users commuted by bus in 2010), followed by the subway (22%) (MALT 2014b). Since 1995, considerable investments have been made in MAL’s public transport system, namely the extension of the subway network, a new railway service connecting the two sides of the Tagus River, and the modernization of the bus fleet. However, these improvements have not kept pace with the changes in mobility patterns into and within MAL. From 1991 to 2011, the number of commuting trips went up from 1,253,701 to 1,648,889 (a rise of approximately 30%), but the percentage of trips by public transport went down from 46% in 1991 to 27% in 2011. Despite an increase in the unemployment rate in MAL between 2001 and 2011 (7.9% in 2001 vs. 13.4% in 2011) and a decrease in the income per capita (purchasing power index of 291 in 1993 vs. 217 in 2013), the percentage of commuting trips by car went up from 25% in 1991 to 54% in 2011. Trips on foot also declined, from 21% to 15% (Statistics Portugal 2011). The preference for the car affects the viability of public transport as lower demand makes it less economically viable and leads to a reduced supply. This generates a vicious cycle as the reduced supply also lowers demand because the service no longer fulfills peoples’ mobility needs (Seabra 2014).
There is a combined public/private governance of the public transport system in MAL. The network design and the service offered are controlled by the public authority, while specific parts of the service are delegated to private operators. The service is provided by 15 transport companies, most of which are under public administration. Except for rail transport, which crosses several MAL municipalities, and the ferry, which connects the two sides of the Tagus River, each bus operator has a well-defined service area where each
predominates with almost no competition. Public transport is a politicized sector often used by trade unions to contest the central government; between 2011 and 2013, there were nearly 500 strike days (partial or total) in public transport, predominantly in the train and subway services (Correia 2013).
Since 1992, operators have also been involved in the definition of fares and ticketing, namely by offering intermodal passes combining services from several companies. While fares for distances up to 50 km are determined by mileage and controlled by the government, fare prices for longer distances are at the operators’
discretion. The intermodal pass system covers a large proportion of the commuting/local trips in MAL, namely those within the municipality of Lisbon and the municipalities in the immediate periphery of Lisbon. However, the pass system does not adequately cover trips from the municipality of Lisbon to the more peripheral municipalities or the commuting/local trips within these municipalities (MALT 2014a).
Data and Methods
Data Collection
Data were collected by means of a survey conducted in 2014 in MAL with the aim of investigating residents’ perceptions of the public transit service. The Metropolitan Transport Authority of Lisbon requested the survey. The sampling procedure was a mix of stratified and cluster sampling, combining random and non-random selection. To guarantee geographical representativeness, the sample was allocated to the 18 municipalities of MAL proportionally to the number of residents. Within each municipality, parish councils were selected using a systematic random procedure. In each parish council, several addresses (e.g., the elementary school, church, police station) were randomly chosen to guide the interviewers’ selection of respondents. Interviewers approached respondents on the street near the previously selected addresses at different times of the day and days of the week, and interviewed them after obtaining their consent and confirming quotas of municipality, gender, and age. A total of 1,166 valid questionnaires were obtained.
The survey questionnaire asked respondents about (1) travel characteristics, (2) satisfaction with public transport service quality, (3) reasons for quitting regular use of public transport and why they would return to it, and (4) socio-demographics. Section 3 was answered exclusively by former users of public transport. To assist with the questionnaire design, six focus groups were conducted with a total of 42 participants including regular and non-regular transit users, which were divided into groups according to their place of residence: North MAL and South MAL. The focus groups helped with the wording of the questionnaire and led to a deeper knowledge about travel behavior and passengers’ perceptions of the public transport service and service providers in the metropolitan area (Passos, Ramos, and Costa 2014).
Questions about travel characteristics included frequency of use, modes used, motives for traveling, and car ownership. The section on satisfaction with public transport service included a set of 24 items intended to measure the level of perceived satisfaction with specific attributes of the mode most frequently used. These items were constructed using results from the focus groups and literature on customer satisfaction (e.g., Del Castillo and Benitez 2012; Eboli and Mazzulla 2007; Fellesson and Friman 2008; Iman 2014; Mokonyama and Venter 2013) and were measured on a 10 point Likert-type scale (1=totally dissatisfied to 10=totally satisfied). The section on reasons for quitting regular use included motives for ending regular use, the current modes used, and changes that would make the person become a regular traveler again. The last section of the questionnaire addressed socio-demographics with questions on gender, age, educational level, professional occupation, household income, household size, and car ownership. Respondents were not asked directly about social class, but an indicator of social level was built by combining household income, educational level, and the profession of the person contributing most to household income. The questionnaire was pre-tested by means of cognitive face-to-face interviews with a sample of 15 respondents of diverse ages and educational levels.
Data Analysis
The analysis began by describing the socio-demographics and trips made by two groups of respondents: regular users and ex-regular users of public transport. Respondents were asked to describe the pattern of their public
transport use on the following scale: every day, 5 days a week, 3-4 days a week, 1-2 days a week, or 1-3 days a month. “Regular user” was defined as someone whose current pattern of public transport use fits one of these options; “ex-regular user” was defined as someone for whom none of these options are now a fit, but they had been so in the last five years. The statistical significance of socio-demographic comparisons between the two groups was checked using the chi-square test of independence.
In the second stage, dimensions of satisfaction with service were identified by means of a principal component analysis with varimax orthogonal rotation. Principal components/dimensions were extracted using Kaiser criteria of eigenvalues greater than 1. A reliability analysis (Cronbach’s α) was employed to assess the internal consistency of each identified dimension. A Cronbach’s α >0.6 was adopted as the criterion for the reliability of dimensions, and item retention was based on factor loading >0.5 (Hair et al. 2010).
A binary logistic regression model was estimated in the next stage to compare regular and ex-regular users of public transport in terms of perceptions about service quality.
Finally, the most important reasons for ex-regular users having stopped traveling by public transport were identified together with what would motivate them to become regular users again.
Results
Cases with missing data in any of the 24 items of service quality were excluded from the analyses; the analyses were therefore based on a sample of 889 cases. Most of the respondents (74.1%) were regular users of public transport and 25.9% were ex-regular users. The following pattern of public transport use was found for regular users: every day, 37.0%; 5 days a week, 32.2%; 3-4 days a week, 11.3%; 1-2 days a week, 13.1%; or 1-3 days a month, 6.3%. The pattern of use for ex-regular users (i.e., the pattern during the last five years) was as follows: every day, 20.7%; 5 days a week, 37.8%; 3-4 days a week, 8.6%; 1-2 days a week, 10.9%; or 1-3 days a month, 22.0%. Daily use of public transport was therefore less frequent among ex-regular users.
Respondents’ Characteristics
The two groups were significantly different from each other (p<0.05) in gender, social level, car ownership, and some travel characteristic items (Table 1). The major differences between regular and ex-regular users can be summarized as follows:
• Gender – ex-regular users are less likely to be male than regular users (51.3% vs. 60.1%)
• Social level – ex-regular users are more likely to belong to the lower middle social level (49.8% vs. 37.1%), while regular users are more likely to be lower level (37.1% vs. 22.6%)
• Car ownership – ex-regular users are more likely to have a car (73.5% vs. 46.7%) and they are also more likely to be the owners of the vehicle (74.8% vs. 62.1%)
• Purpose of the last local or commuting trip – travel for social or leisure purposes is more frequent among ex-regular users (35.7% vs. 23.6%), while regular travel to work/school/home is more common among regular users (32.9% vs. 23.3%)
• Travel mode used in last local or commuting trip – ex-regular users are less likely to have used the bus (15.7% vs. 53%) and subway (10.9% vs. 20.2%) in their last commuting or local trip than regular users.
TABLE 1.
Respondents’ Socio-demographic Profile and Travel Pattern
Characteristic Ex-regular users (n=230) Regular users (n=659) p-value
Socio-demographics Gender (male) 51.3 60.1 0.020 Age n.s. 15-24 years 16.1 18.8 25-34 24.3 17.0 35-44 17.8 16.4 45-64 24.8 27.3 65+ 17.0 20.5 Household size n.s. 1 person 14.3 19.9 2 persons 30.4 30.8 3 persons 28.1 25.0 4 or more persons 27.2 24.2 Social level 0.001 D-Lower 22.6 37.1 C2-Lower middle 49.8 37.1 C1-Middle 23.1 20.5 A/B-Upper/Upper middle 4.5 5.2 Has car 73.5 46.7 0.000 Car ownership 0.000 Own car 74.8 62.1 Household car 23.0 37.6 Company car 2.2 0.3 Travel characteristics
Purpose(s) of the last local or commuting tripa
Regular travel for work, school, or home 23.3 32.9 0.007 Personal matters (e.g., administrative, doctor’s
appointment) 4.4 2.1 n.s.
Work (e.g., business, sales, contacts with customers) 24.7 26.1 n.s.
Shopping 9.7 8.7 n.s.
Social/leisure 35.7 23.6 0.000
Travel mode(s) used in last local or commuting tripa
Bus 15.7 53.0 0.000
Train 13.9 16.7 n.s.
Boat 16.5 18.1 n.s.
Subway 10.9 20.2 0.001
Service Quality Dimensions
A preliminary analysis of the 24 items of service quality reveals a number of differences between ex-regular and regular users of public transport. Specifically, ex-regular users have lower mean values of satisfaction (p<0.05) in the following items: distance to the stop/station/terminal, price of monthly pass, frequency of strikes, efficient response to complaints, alternative transport in strike period, rules of purchase and use of tickets and passes, price compared to alternative transport, and intermodal coordination (Table 2).
TABLE 2.
Mean Value of Service Quality Items for Ex-regular and Regular Transport Users
The principal component analysis performed with the 24 items on service quality attributes identified six new dimensions, as shown in Table 3. Based on the highest loadings, the new dimensions were named as follows: PCA–routes and timetables, PCB–comfort and safety, PCC– price, PCD–attractiveness of service, PCE–handling of
complaints, and PCF–guarantee of service. The six components together account for 67.8% of the initial variance
(KMO = 0.939; Bartlett’s p<0.001; Cronbach’s α from 0.681 to 0.887). The dimensions are standardized variables with mean 0 and standard deviation 1.
Service quality itemsa Ex-regular users
(n=230) Regular users (n=659) p-value
Punctuality/waiting time 6.66 6.67 n.s.
Speed en route 7.13 7.16 n.s.
Adequacy of routes offered 6.75 6.90 n.s.
Timetables 6.60 6.52 n.s.
Frequency of vehicles on weekdays 6.83 6.83 n.s.
Frequency of vehicles on weekends 5.02 5.01 n.s.
Comfort of vehicles 6.47 6.54 n.s.
Number of seats 6.48 6.47 n.s.
Safety of persons and property 6.36 6.58 n.s.
Ease of entering/exiting vehicles/stations 6.70 6.86 n.s.
Price of standard single ticket 4.00 4.32 n.s.
Distance to the stop/station/terminal 6.66 7.10 0.001
Price of monthly pass 4.24 4.67 0.009
Frequency of strikes 4.94 5.42 0.008
Alternative transport in strike period 3.94 4.54 0.001 Rules of purchase and use of tickets and passes 6.18 6.63 0.002 Handling of complaints and suggestions 5.46 5.78 n.s.
Efficient response to complaints 5.19 5.53 0.035
Quality/price ratio 5.37 5.58 n.s.
Quality of stops and stations 5.88 5.93 n.s.
Inspection of transport tickets 6.17 6.20 n.s.
Price compared to alternative transport 5.74 6.09 0.014
Intermodal coordination 6.31 6.65 0.025
Staff behavior 6.80 6.97 n.s.
TABLE 3.
Analysis Results: Dimensions of Public Transport Service Quality
Ex-regular Users’ Perceptions of Transit Service Quality
The most significant dimensions of service quality distinguishing ex-regular and regular users were identified by means of a binary logistic regression model with traveler type (1–ex-regular user and 0–regular user) as the dependent variable, and dimensions of service quality as independent variables. Social level was included in the
Principal components/Dimensions of service qualitya Loadingsb % Variance
explained Cronbach’s α
PCA–Routes and timetables 42.7 0.878
Adequacy of routes offered 0.796
Timetables 0.789
Frequency of vehicles on weekdays 0.736
Speed en route 0.722
Punctuality/waiting time 0.693
Frequency of vehicles on weekends 0.592
PCB–Comfort and safety 7.8 0.837
Number of seats 0.788
Safety of persons and property 0.729
Ease of entering/exiting vehicles/stations 0.663
Comfort of vehicles 0.625
PCC–Price 5.1 0.831
Price of standard single ticket 0.763
Price of monthly pass 0.662
Price compared to alternative transport 0.559
Quality/price ratio 0.554
PCD–Attractiveness of service 4.2 0.713
Inspection of transport tickets 0.735
Intermodal coordination 0.553
Distance to the stop/station/terminal 0.526
Staff behavior 0.524
PCE–Handling of complaints 4.1 0.887
Efficient response to complaints 0.849
Handling of complaints and suggestions (offices/opening hours) 0.827
PCF–Guarantee of service 3.9 0.681
Frequency of strikes 0.835
Alternative transport in strike period 0.608 Rules of purchase and use of tickets and passes 0.526
aItems with loadings less than 0.5 were omitted. bAfter varimax rotation.
Note: The item “Quality of stops and stations” is not presented because its coefficients are inferior to 0.5; however, its strongest correlations were with PCD.
model as covariate since it is the socio-demographic feature most associated to traveler type. Model estimates are presented in Table 4.
TABLE 4.
Model Estimates for the Likelihood of Being an Ex-regular Transport User
The service quality dimensions that most distinguish ex-regular from regular users of public transport include attractiveness of service and guarantee of service (p<0.05). Specifically, ex-regular users are less satisfied than regular users with the two dimensions (β^ = –0.235 and β^ = –0.231, respectively). Although the model can accurately classify 73% of the cases, the Nagelkerke R2 is only 0.033; this shows that perceptions about the quality
of public transport service are not what most account for the distinction between ex-regular and regular users.
Reasons for Becoming an Ex-regular User of Public Transport
Ex-regular users were asked to choose from a set of potential reasons explaining their decision to stop being a regular user of public transport and to say which was the most relevant. Table 5 presents the percentage of answers for each of the items.
TABLE 5.
Reasons for Being an Ex-regular User of Public Transport✝
Variables β^ Std error Wald p-value PCA–Routes and timetables +0.073 0.077 0.903 n.s.
PCB–Comfort and safety _0.059 0.077 0.588 n.s.
PCC–Price _0.042 0.079 0.279 n.s. PCD–Attractiveness of service _0.235 0.077 9.366 0.002 PCE–Handling of complaints _0.090 0.077 1.378 n.s. PCF–Guarantee of service _0.231 0.079 8.638 0.003 Constant _1.254 0.173 52.830 0.000 Reasons Percent
Change in the workplace/school/residence 30 Change in employment status: unemployed/retired 23
Started using company car 15
Travel time longer than individual transport 13 Change in family obligations (e.g., taking children to school) 7 Higher cost than individual transport 4 Lack of convenience/poor quality of public transport service 3
Inadequate public transport service 1
Increase in household income 1
Difficulty in accessing public transport vehicles (e.g., reduced
mobility, disability) 1
Lack of knowledge about the public transport system 0
The results show that respondents stopped using public transport regularly either because it was no longer necessary due to a change in their lives, namely unemployment or retirement (23%), a change in family obligations (7%), the use of a company car (15%), or public transport was no longer the best solution for their travel needs due to a change in workplace/school/residence (30%). Less than 5% of the responses given referred to reasons related to the public transport service, such as price or quality; the only exception to this was that of travel time being longer than by individual transport (13%).
When asked about the mode of travel adopted after no longer using public transport regularly, the most common answers included the car (66%), walking (23%), or car ride (12%). Other alternatives such as company car, motorcycle, or bicycle had less than 5% of responses (figures not presented in Table 5).
Ex-regular users of public transport were also asked what would motivate them to become regular users again. Table 6 presents the percentage of answers for each of the items.
TABLE 6.
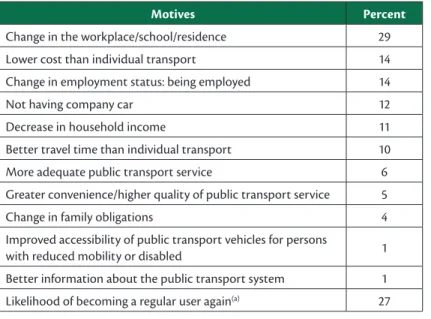
Motives for Becoming a Regular User of Public Transport Again✝
A change in the workplace/school/residence was the reason given by 29% of the respondents. If public transport cost less than traveling by private car, 14% of the respondents would consider becoming a regular user. Getting a job was mentioned by 14% of the respondents. Reasons such as not having a company car, a reduction in household income, and better travel time than individual transport were chosen by 10% to 12% of ex-regular users. The items related to service attributes such as travel time, accessibility, and convenience/quality were mentioned by 10% or less of respondents. Finally, respondents were asked to express the likelihood of returning to regular use of public transport on a scale from 0 (none) to 100 (certain): on average the likelihood was 27, revealing a low intention.
Motives Percent
Change in the workplace/school/residence 29
Lower cost than individual transport 14
Change in employment status: being employed 14
Not having company car 12
Decrease in household income 11
Better travel time than individual transport 10 More adequate public transport service 6 Greater convenience/higher quality of public transport service 5
Change in family obligations 4
Improved accessibility of public transport vehicles for persons
with reduced mobility or disabled 1
Better information about the public transport system 1 Likelihood of becoming a regular user again(a) 27 ✝Based on the sample of n=230 ex-regular users.
Conclusion
The research undertaken can be summarized as follows: (a) a survey about the perceptions of public transport was conducted in the metropolitan area of Lisbon; (b) dimensions of service quality were identified; (c) a binary logistic regression model was estimated to compare the perceptions about service quality of ex-regular to regular users; and (d) main reasons were identified for abandoning regular use of public transport and potential motives for returning.
The outcomes reveal that ex-regular users are more likely to be female, belong to the lower-middle social level, and own a car than regular users of public transport. Among ex-regular users, the percentage of car ownership is 73.5% and among ex-regular users in the lower-middle level is 60% (outcome not presented in Table 1), which reveals that people own a car despite having modest income. A survey on consumption intentions conducted by Cetelem in 2013 (during the 2011-2014 crisis that put Portugal under a financial bailout) revealed that 63% of the Portuguese intended to buy a second-hand car in the next two years and the only reason for not buying a new one was that they could not afford it (Madaleno 2013). Moreover, the European Mobility Observatory revealed that the Portuguese use the car to commute to work more than any other European citizens (72% vs. 61% of EU average) (Lusa 2017). This scenario demonstrates the importance Portuguese give to having and using a car and that a change is needed in attitudes toward mobility. Although the survey for this study did not ask ex-regular users whether they had bought or intended to buy a car, the high rate of car ownership in this group (73.5%) and the high rate of car use after abandoning public transport (66%) suggests they considered the car a better mobility alternative than public transport.
Regarding service quality, the findings indicate that ex-regular users do not have strong criticisms of the public transport system in MAL. However, the main reason for leaving or returning to public transport use—a change in the workplace/school/residence—is related to specific features of the transport service. In recent decades, many families have relocated their place of residence to suburban areas not well served by transit (MALT 2014a). The lack of offer near people’s residences and the high costs of intermodal solutions (for users needing more than one or two modes of transport) seem to be central to their decision regarding public transport use. Most ex-regular users began using the car when they stopped using public transport, signifying that public transport became less convenient than the car: poor compliance with schedules (even though there are bus lanes in the city), the need for different transport modes, and the lack of coordination between operators account for public transport being less convenient than the car. Conditions must be created that make public transport more advantageous than the car to stop the decline in regular use. In a first stage, the service should be designed to accommodate the levels of service required by passengers. Although there are no marked differences between the perceptions of ex-regular and regular users about service quality (as revealed by the low R2 of the logistic model), the former expressed less satisfaction with the attractiveness of service and with the
guarantee of service. This would therefore be a good starting point for transit agencies and managers. The attractiveness of service relates primarily to inspection of transport tickets, intermodal coordination, and distance to stops/stations. These aspects can only be improved if the rise in the population in MAL’s most peripheral municipalities in recent decades is acknowledged (Statistics Portugal 2011) and the public transport network is redesigned to cover the commuting/local trips to/from and within these municipalities. However, the following difficulties are anticipated: first, there are 15 operators in MAL, making it more difficult to reach a consensus solution; and second, the management of most operators comes under state governance and decisions are therefore vulnerable to the political context. Despite much discussion about decentralizing public transport management in MAL (i.e., transferring to operators or even making concessions to private entities), there has been no consistent process during the last decade and no easy solution has been found. Whatever
difficulties this business process entails, it is essential to redesign the public transport network to assure better coverage and convenience for people in the most peripheral areas of MAL in the hope of convincing them that using public transport is preferable to the car.
The guarantee of service is closely linked to service failures caused by strikes. However, the resolution to this problem lies with the central government because most operators are under state governance and therefore cannot respond to strikers’ demands themselves. Notwithstanding, strikes occur frequently and a service recovery policy is needed to minimize the negative impact on transport users. Service recovery includes the steps taken by an organization to correct service failures, restore customer satisfaction, and ultimately retain customers. Service recovery strategies include apologizing for service failures and offering customers a tangible form of compensation, such as discounts or vouchers (Boshoff and Leong 1998; Mattila and Cranage 2005). Boshoff and Staude (2003) and La and Kandampully (2004) state that organizations should correct service failure as soon as it occurs or offer customers alternatives that will meet their needs. In MAL, people who buy monthly passes are prejudiced most by strikes because they are not reimbursed. Publicly managed operators must therefore introduce a service recovery policy to be used when strikes occur so passengers no longer feel they are paying for poor or no service. Such a perception is likely to make people stop using the service (Boshoff and Klemz 2005; Miller, Craighead, and Karwan 2000) and must be avoided.
Improvements to the attractiveness and guarantee of service are vital to maintaining the ridership of people who gain access to a car. However, the use of public transport can also be encouraged through measures that make the car less attractive for commuting, such as taxing vehicles entering the city center and instituting high parking tariffs. Alternatively, parking lots could be built on the outskirts of the city near subway, train, or bus stations so people can leave the cars there and take public transport into the city (Cools et al. 2012). Such measures are foreseen in MAL in the 2014-2020 Sustainable Urban Mobility Plan of the Municipality of Lisbon (Municipality of Lisbon 2016) and it would be interesting to evaluate their efficacy in future research.
According to Steg (2005), the attitude toward public transport versus private cars is the greatest challenge for changing transit behavior because private cars are associated with a perception of freedom, flexibility, power, and social status that goes beyond comfort. It is important to draw attention to the disadvantages of using the car, noted in the literature, such as parking, traffic, and particularly costs (Mees et al. 2010), in order to make public transport more appealing. The environmental and psychological costs of car usage are as important as the economic aspects. Traffic congestion leads to air pollution and contributes to global warming. On the other hand, traffic problems heighten stress, anxiety, and nervousness. Awareness of these costs might lead to different attitudes toward transit use.
The interviews conducted for this survey took place in the street and although this enabled the fieldwork to be completed more rapidly, it limited the amount and depth of information gathered. Future studies could be extended to include qualitative research that explores the reasons for abandoning or returning to public transport use in greater depth. It would also be interesting to examine different transport modes (bus, train, subway, and ferry) more closely, as they might be perceived differently by regular and ex-regular users.
Acknowledgments
This paper is part of the project Estudo de Satisfação dos Utilizadores dos Transportes Públicos da Área
Metropolitana de Lisboa 2013, a joint project of the Metropolitan Transport Authority of Lisbon (AMTL) and
Instituto Universitário de Lisboa (ISCTE-IUL). This work received financial support from Fundação para a Ciência e Tecnologia (Science and Technology Foundation) through the UID/GES/00315/2013 project.
References
Acharya, S., and S. Morichi. 2007. “Motorization and Role of Mass Rapid Transit in East Asian Megacities.”
International Association of Traffic and Safety Sciences Research 31 (2): 6-16.
doi:10.1016/S0386-1112(14)60217-X.
Beirão, G., and J. Cabral. 2007. “Understanding attitudes towards public transport and private car: A qualitative study.” Transport Policy 14 (6): 478-489.
Bliss, L. 2017. “What's Behind Declining Transit Ridership Nationwide?” CityLab. February 24, 2017. https://www. citylab.com/transportation/2017/02/whats-behind-declining-transit-ridership-nationwide/517701/. Accessed August 17, 2017.
Boshoff, C., and R. Klemz. 2005. “The Importance of Doing It Right the Second Time: Two Experimental Studies of Service Recovery.” Presentation at 2005 Conference of Southern Africa Institute for Management Scientists, Free State University, South Africa.
Boshoff, C., and J. Leong. 1998. “Empowerment, attribution and apologising as dimensions of service recovery: An experimental study.” International Journal of Service Industry Management 9 (1): 24-47. doi:10.1108/09564239810199932.
Boshoff, C., and G. Staude. 2003. “Satisfaction with service recovery: Its measurement and its outcomes.” South
African Journal of Business Management 34 (3): 9-16.
Buehler, R., K. Lukacs, and M. Zimmerman. 2015. Regional Coordination in Public Transportation: Lessons from
Germany, Austria, and Switzerland. Final Report VT 2103-04. Virginia Tech, Urban Affairs and Planning.
http://www.mautc.psu.edu/docs/VT-2013-04.pdf. Accessed November 8, 2016.
Cervero, R. 2013. “Transport Infrastructure and the Environment: Sustainable Mobility and Urbanism.” Working Paper 2013-03, University of California, Berkeley, October 2013. http://iurd.berkeley.edu/wp/2013-03.pdf. Accessed November 8, 2016.
Cools, M., K. Brijs, H. Tormans, J. De Laender, and G. Wets. 2012. “Optimizing the implementation of policy measures through social acceptance segmentation.” Transport Policy 22 (July 2012): 80–87. doi:10.1016/j. tranpol.2012.05.013.
Correia, R. 2013. “There have been nearly 500 days of transport strikes since the Government took office.”
Público - Comunicação Social, SA. November 18, 2013. https://www.publico.pt/2013/11/18/economia/
noticia/houve-quase-500-dias-com-greves-nos-transportes-desde-que-o-governo-tomou-posse-1612991. Accessed August 22, 2017.
Del Castillo, J., and F. Benitez. 2012. “A Methodology for Modeling and Identifying Users Satisfaction Issues in Public Transport Systems Based on Users Surveys.” Procedia - Social and Behavioral Sciences 54 (2012): 1104-1114. doi:10.1016/j.sbspro.2012.09.825.
Eboli, L., and G. Mazzulla. 2007. “Service Quality Attributes Affecting Customer Satisfaction for Bus Transit.
Journal of Public Transportation 10 (3): 21-34. doi:10.5038/2375-0901.10.3.2.
. 2011. “A methodology for evaluating transit service quality based on subjective and objective measures from the passenger’s point of view.” Transport Policy 18 (1): 172–181. doi:10.1016/j.tranpol.2010.07.007.
European Commission. 2013. Special Eurobarometer 406: Attitudes of Europeans towards urban mobility. http:// ec.europa.eu/public_opinion/archives/ebs/ebs_406_en.pdf . Accessed September 14, 2015.
Fellesson, M., and M. Friman. 2008. “Perceived Satisfaction with Public Transport Service in Nine European Cities.” Journal of Transportation Research Forum 47 (3): 93-103. doi:10.5399/osu/jtrf.47.3.2126.
Fujii, S., and R. Kitamura. 2003. “What does a one-month free bus ticket do to habitual drivers? An experimental analysis of habit and attitudes change.” Transportation 30 (1): 81-95. doi:10.1023/A:1021234607980.
Hair, Jr., J., W. Black, B. Babin, and R. Anderson. 2010. Multivariate Data Analysis: A Global Perspective, Seventh
Edition. Upper Saddle River, NJ: Pearson Education.
Hoffman, K., S. Kelley, and B. Chung. 2003. “A CIT investigation of servicescape failures and associated recovery strategies.” Journal of Services Marketing 17 (4): 322-340. doi:10.1108/08876040310482757.
Iman, R. 2014. “Measuring Public Transport Satisfaction from User Surveys.” International Journal of Business
and Management 9 (6): 106-114. doi:10.5539/ijbm.v9n6p106.
Imaz, A., K. Habib, A. Shalaby, and A. Idris. 2015. “Investigating the factors affecting transit user loyalty.” Public
Transport 7 (1): 39-60.
ITF (International Transport Forum). 2011. Transport Outlook 2011: Meeting the Needs of 9 Billion People. Paris: International Transport Forum.
La, K., and J. Kandampully. 2004. “Market oriented learning and customer value enhancement through service recovery management.” Managing Service Quality: An International Journal 14 (5): 390–401. doi:10.1108/09604520410557994.
Lai, W., and C. Chen. 2011. “Behavioral intentions of public transit passengers—The role of service quality, perceived value, satisfaction and involvement.” Transport Policy 18 (2): 318–325.
Lei, M., and L. Mac. 2005. “Service Quality and Customer Loyalty in a Chinese Context: Does Frequency of Usage Matter?” ANZMAC 2005 Conference: Services Marketing, 138-145.
Levinson, D. 2017. “On the Predictability of the Decline of Transit Ridership in the US.” Transportist. March 20, 2017. https://transportist.org/2017/03/20/on-the-predictability-of-the-decline-of-transit-ridership-in-the-us/. Accessed August 18, 2017.
LTA (Land Transport Authority). 2011. “Passenger Transport Mode Shares in World Cities.” Journeys (November): 60-70. https://studylib.net/doc/7972629/passenger-transport-mode-shares-in-world-cities. Accessed
November 8, 2016.
Lusa. 2017. “Portuguese spend more than eight hours on trips during the week.” Diário de Notícias. April 26, 2017. http://www.dn.pt/sociedade/interior/portugueses-gastam-mais-de-oito-horas-em-deslocacoes-durante-a-semana----inquerito-6244528.html. Accessed August 29, 2017.
Madaleno, M. 2013. “Portuguese are the Europeans who dream the most about new cars.” Público -
Comunicação Social, SA. March 12, 2013. https://www.publico.pt/2013/03/12/economia/noticia/
portugueses-sao-os-europeus-que-mais-querem-comprar-carros-1587466. Accessed August 24, 2017. MALT (Metropolitan Authority of Lisbon Transport) 2014a. “Organization, tariffs and financing of public
transport system of metropolitan area of Lisbon.” Unpublished report. 2014b. “Smooth mobility.” Unpublished report.
Mattila, A., and D. Cranage. 2005. “The impact of choice on fairness in the context of service recovery.” Journal
of Services Marketing 19 (5): 271-279. doi:10.1108/08876040510609899.
Mees, P., J. Stone, M. Imran, and G. Nielsen. 2010. Public transport network planning: a guide to best practice in
NZ cities. New Zealand Transport Agency Research Report 396.
Miller, J., C. Craighead, and K. Karwan. 2000. “Service recovery: a framework and empirical investigation.” Journal
of Operations Management 18 (2000): 387-400.
Mokonyama, M., and C. Venter. 2013. “Incorporation of customer satisfaction in public transport contracts – A preliminary analysis.” Research in Transportation Economics 39 (1): 58-66. doi:10.1016/j.retrec.2012.05.024. Municipality of Lisbon. 2016. PAMUSLx-Plano (de Ação) Mobilidade Urbana Sustentável do Município de Lisboa.
http://www.cm-lisboa.pt/fileadmin/VIVER/Urbanismo/urbanismo/PEDU/PAMUS/PAMUS_Relatorio_ FINAL.pdf. Accessed August 29, 2017.
Murphy, J., J. Burton, R. Gleaves, and J. Kitshoff. 2006. Converting Customer Value: From Retention to Profit. Chichester: John Wiley & Sons.
NTA (National Transport Authority). 2016. Transport for Dublin: Investment Projects. https://www. nationaltransport.ie/projects-schemes/. Accessed November 8, 2016.
OECD/ITF. 2014. Valuing Convenience in Public Transport. ITF Round Tables, No. 156, OECD Publishing. Paris: International Transport Forum. doi:10.1787/9789282107683-en.
Orcutt, J. 2017. “Why Public Transit Ridership Is Down In Most U.S. Cities.” Here & Now, WBUR. March 21, 2017. http://www.wbur.org/hereandnow/2017/03/21/public-transit-ridership-down. Accessed August 17, 2017. Passos, A., S. Ramos, and P. Costa. 2014. "Estudo de Satisfação dos Utilizadores dos Transportes Públicos da Área
Metropolitana de Lisboa 2013 – Final Report of Focus Groups." Unpublished report, Instituto Universitário de Lisboa (ISCTE-IUL), Lisbon.
Pourbaix, J. 2011. “Towards a smart future for cities: Urban transport scenarios for 2025.” Public Transport
International 60 (3): 8-10.
Schiefelbusch, M., and H.L. Dienel (Eds.). 2009. Public Transport and its Users: The Passenger's Perspective in
Planning and Customer Care. London: Routledge.
Seabra, I. 2014. “Política de Mobilidade: Panorâmica Europeia e Nacional.” Presentation at Planeamento da Mobilidade Urbana Sustentável, June 27, 2014. http://www.imt-ip.pt/sites/IMTT/Portugues/Noticias/ Documents/2014/27junho2014-Endurance/PoliticadeMobilidade.pdf. Accessed August 20, 2017.
Shiftan, Y., Y. Barlach, and D. Shefer. 2015. “Measuring Passenger Loyalty to Public Transport Modes. Journal of
Public Transportation 18 (1), 1-16. doi:10.5038/2375-0901.18.1.7.
Statistics Portugal. 2011. “Population Mobility.” Census Population Report. Statistics Portugal, 31-37.
Steg, L. 2005. “Car use: lust and must. Instrumental, symbolic and affective motives for car use.” Transportation
Research Part A: Policy and Practice 39 (2005): 147-162. doi:10.1016/j.tra.2004.07.001.
TfL (Transport for London). 2016. “Improvements & projects.” Transport for London. https://tfl.gov.uk/travel-information/improvements-and-projects/. Accessed October 6, 2016.
UITP. 2014. Climate Action and Public Transport: Analysis of Planned Actions. Brussels: International Association of Public Transport.
United Nations. 2012. “Mobility.” UN-Habitat. http://unhabitat.org/urban-themes/mobility/. Accessed November 7, 2016.
Van Lierop, D., and A. El-Geneidy. 2016. “Enjoying loyalty: The relationship between service quality, customer satisfaction, and behavioral intentions in public transit.” Research in Transportation Economics 59: 50-59. Venetis, K., and P. Ghauri. 2004. “Service quality and customer retention: building long-term relationships.”
European Journal of Marketing 38 (11/12):1577-1598. doi:10.1108/03090560410560254.
Wen, C., L. Lan, and H. Chang. 2005. “Structural Equation Modeling to Determine Passenger Loyalty toward Intercity Bus Services.” Transportation Research Record: Journal of the Transportation Research Board 1927 (1): 249-255. doi:10.1177/0361198105192700128.