In-season internal and external training load
quantification of an elite European soccer
team
Rafael OliveiraID1,2,3,4*, João P. Brito1,2,3, Alexandre MartinsID1, Bruno Mendes5, Daniel A. Marinho2,4, Ricardo Ferraz2,4,6, Ma´rio C. Marques2,4
1 Sports Science School of Rio Maior–Polytechnic Institute of Santare´ m, Rio Maior, Portugal, 2 Research Centre in Sport Sciences, Health Sciences and Human Development, Vila Real, Portugal, 3 Life Quality Research Centre, Santare´ m, Portugal, 4 Department of Sports Sciences, University of Beira Interior, Covilhã, Portugal, 5 Faculty of Human Kinetics, University of Lisbon, Lisbon, Portugal, 6 Football Association of Castelo Branco, Castelo Branco, Portugal
Abstract
Elite soccer teams that participate in European competitions need to have players in the best physical and psychological status possible to play matches. As a consequence of congestive schedule, controlling the training load (TL) and thus the level of effort and fatigue of players to reach higher performances during the matches is therefore critical. Therefore, the aim of the current study was to provide the first report of seasonal internal and external training load that included Hooper Index (HI) scores in elite soccer players during an in-sea-son period. Nineteen elite soccer players were sampled, using global position system to col-lect total distance, high-speed distance (HSD) and average speed (AvS). It was also collected session rating of perceived exertion (s-RPE) and HI scores during the daily training sessions throughout the 2015–2016 in-season period. Data were analysed across ten mesocycles (M: 1 to 10) and collected according to the number of days prior to a one-match week. Total daily distance covered was higher at the start (M1 and M3) compared to the final mesocycle (M10) of the season. M1 (5589m) reached a greater distance than M5 (4473m) (ES = 9.33 [12.70, 5.95]) and M10 (4545m) (ES = 9.84 [13.39, 6.29]). M3 (5691m) reached a greater distance than M5 (ES = 9.07 [12.36, 5.78]), M7 (ES = 6.13 [8.48, 3.79]) and M10 (ES = 9.37 [12.76, 5.98]). High-speed running distance was greater in M1 (227m), than M5 (92m) (ES = 27.95 [37.68, 18.22]) and M10 (138m) (ES = 8.46 [11.55, 5.37]). Inter-estingly, the s-RPE response was higher in M1 (331au) in comparison to the last mesocycle (M10, 239au). HI showed minor variations across mesocycles and in days prior to the match. Every day prior to a match, all internal and external TL variables expressed signifi-cant lower values to other days prior to a match (p<0.01). In general, there were no differ-ences between player positions.
Conclusions: Our results reveal that despite the existence of some significant differences between mesocycles, there were minor changes across the in-season period for the internal and external TL variables used. Furthermore, it was observed that MD-1 presented a
a1111111111 a1111111111 a1111111111 a1111111111 a1111111111 OPEN ACCESS
Citation: Oliveira R, Brito JP, Martins A, Mendes B, Marinho DA, Ferraz R, et al. (2019) In-season internal and external training load quantification of an elite European soccer team. PLoS ONE 14(4): e0209393.https://doi.org/10.1371/journal. pone.0209393
Editor: Filipe Manuel Clemente, Instituto Politecnico de Viana do Castelo, PORTUGAL Received: November 27, 2018
Accepted: March 22, 2019 Published: April 22, 2019
Copyright:© 2019 Oliveira et al. This is an open access article distributed under the terms of the Creative Commons Attribution License, which permits unrestricted use, distribution, and reproduction in any medium, provided the original author and source are credited.
Data Availability Statement: Due to issues of participant consent and confidentiality issues with the soccer club involved in this study, data will not be shared publicly. Data are available from the Research Center in Sports Sciences, Health Sciences and Human Development Institutional Data Access / Ethics Committee. (contact via https://cidesd.utad.pt/contacts/) for researchers who meet the criteria for access to confidential data.
reduction of external TL (regardless of mesocycle) while internal TL variables did not have the same record during in-season match-day-minus.
Introduction
The knowledge of internal and external training load (TL) helps coaches to prevent increased
levels of fatigue, and higher risk of illness and injury [1]. Also, it helps coaches to design an
effective individual and group training periodization in elite team sports [2–7]. However, it is
only recently that some studies have described the in-season training periodization practices of elite football teams in more detail, including a comparison of training days within weekly
microcycles [4,7–9]. As an example, Malone et al. [4] found that a lowering of TL in the last
training day immediately before any given match differed from the other training days on sev-eral internal and external TL load variables such as session rated perceived exertion (s-RPE), plus total distance and average speed, respectively. The same authors stated that the need to
win matches does not allow to reach of a specific peak for strength and conditioning [4]. In
addition, some studies have shown limited variation through the in-season and have suggested
that training in elite soccer has a regular load pattern [4,5,10,11].
Moreover, several authors [1,10,12,13] have claimed that it is also very important to
moni-tor elite athletes’ health to provide further information concerning the details of player fatigue, stress, muscle soreness and sleep perception. These variables are commonly associated with psychophysiological stress responses, such as rating of perceived exertion or Hooper Index
(HI) scores, also recognized as internal TL [13,14]. On this issue, a valid and simple way to
control internal TL is the session rating of perceived exertion (s-RPE) which showed
correla-tions to the heart frequency training zones [15]. Furthermore, another way to quantity the
level of fatigue, stress, s muscle soreness and the quality of sleep is the Hooper Index [12].
However, the simultaneous use of s-RPE and HI is limited. In fact, very few authors have
studied the relationship between the use of the HI and s-RPE [10,16]. Here, Clemente et al.
[10] found a correlation between s-RPE and HI levels, and negative correlations between
s-RPE and muscle soreness (p =−0.156), s-RPE and sleep (p = −0.109), s-RPE and fatigue
(p =−0.225), ITL and stress (p = −0.188) and ITL and HI (p = −0.238) in 2-game weeks. On the
other hand, Haddad et al. [16] failed to observe any association between HI and RPE. Therefore,
further research is needed to clarify this issue, specifically to validate these results during in-sea-son. Subsequently, it is also necessary to quantify the external TL that is associated with the total
amount of workload performed during training sessions and/or matches [13–14]. According to
Halson [17] and Casamichana et al. [18], one easy and practical way to control training response
for each player (e.g. frequency, time, total distance and distances of different exercise training intensity) is time-motion analysis by using a global positioning system (GPS).
Nowadays, researchers study the data collected during short training microcycles of 1-2-3
weeks [9–10,13,19], in mesocycles consisting of 4–10 weeks [20–22] and during longer
train-ing periods of 3–4 months [18,23] and 10-month periods [11]. However, most of these studies
have provided limited information regarding the TL, using only the duration and RPE without the inclusion of other internal and external TL variables such as HI or data collected from
GPS. In addition, few studies [4–5,10] have attempted to quantify TL with respect to changes
between mesocycles and microcycles (both overall and between player’s positions) across an in-season.
Finally, the literature is somewhat inconclusive about establishing differences in TL for player positions not only amongst training sessions but also during the in-season across a full
Funding: The authors state that there were no salaries’ fund from a tobacco company. Also, the authors are not aware of any competing interests. This project was supported by the National Funds through FCT—Portuguese Foundation for Science and Technology (UID/DTP/04045/2013)—and the European Fund for Regional Development (FEDER) allocated by European Union through the COMPETE 2020 Programme (POCI-01-0145-FEDER-006969)—competitiveness and internationalization (POCI). All funding received for this work from any of the following organizations: National Institutes of Health (NIH); Welcome Trust; Howard Hughes Medical Institute (HHMI). The funders had no role in study design, data collection and analysis, decision to publish, or preparation of the manuscript.
Competing interests: The authors have declared that no competing interests exist.
competitive season regarding training sessions, but there is information related to match-play
data that reveals some differences for player positions [4,24]. Therefore, the purpose of this
study was twofold: a) quantify external TL in an elite professional European soccer team that played UEFA competitions across ten months of the in-season 2015/16 and b) quantify the internal TL using s-RPE and HI. For this purpose, we divided the in-season into ten months,
following Morgan et al. [11], and used the match day minus approach used by Malone et al.
[4] for data analysis. Additionally, we also compared player positions for both situations. We
hypothesized that training load is lower on training days closer to the next match and that the intensities and volume remain constant throughout the competitive period.
Materials and methods
Participants
Nineteen elite soccer players with a mean± SD age, height and mass of 26.3 ± 4.3 years,
183.5± 6.6 cm and 78.5 ± 6.8 kg, respectively, participated in this study. The players belong to
a team that participated in UEFA Champions League. The field positions of the players in the study consisted of four central defenders (CD), four wide defenders (WD), four central mid-fielders (CM), four wide midmid-fielders (WM) and three strikers (ST). Inclusion criteria were reg-ular participation in most of the training sessions (80% of weekly training sessions); the completion of at least 60 minutes in one match in the first half of the season and one match in the second half of the season. All participants were familiarised with the training protocols prior to the investigation and gave their written consent to be included in the project. The study was conducted according to the requirements of the Declaration of Helsinki and was approved by Ethics Committee of the Research Centre for Sports Sciences, Health and Human Development, Vila Real, Portugal.
Design
TL data were collected over a 39-week period of competition where occurred 50 matches dur-ing the 2015–2016 annual season. The team used for data collection competed in four official competitions across the season, including UEFA Champion league, the national league and two more national cups from their own country. For the purposes of the present study, all the sessions carried out as the main team sessions were considered. This refers to training sessions in which both the starting and non-starting players trained together. Only data from training sessions were considered. Data from rehabilitation or additional training sessions of recupera-tion were excluded. This study did not influence or alter the training sessions in any way. Training data collection for this study was carried out at the soccer club’s outdoor training pitches. A total of 2981 individual training observations were collected during In-season. Total minutes of training sessions included warm-up, main phase and slow down phase plus stretch-ing. A total of 349 individual observations contained missing data due to factors outside of the researcher’s control (eg, technical issues with equipment).
Methodology
The in-season phase was divided into 10 mesocycles or 10 months, respectively, as used by
Morgans et al. [11] and because the coaches and staff of the club work by months. Training
data were also analysed in relation to the number of days away from the competitive one-match week (i.e., one-match day minus). In a week with only one one-match, the team typically trained five days a week (match day [MD] minus [–]; MD-5; MD-4; MD-3; MD-2; MD-1), plus one
External training load–training data
A portable global positioning system (GPS) units (Viper pod 2, STATSports, Belfast, UK) was used to monitor the physical activity of each player (external TL). This device provides position velocity and distance data at 10 Hz frequency. The use of the device by each player is reported
in Oliveira et al. [25]. All players wore the same GPS device for each training session in order
to avoid inter unit error [26]. Previously, this GPS system have been able to provide valid and
reliable estimates of instantaneous and constant velocity movements during linear,
multidirec-tional and soccer-specific activities [27] Following recommendations by Maddison & Ni
Mhurchu [28], all devices were activated 30 minutes before data collection to allow the
acquisi-tion of satellite signals and synchronise the GPS clock with the satellite’s atomic clock. GPS data were then downloaded using the respective software package (Viper PSA software, STAT-Sports, Belfast, UK) and were clipped to involve the main team session (i.e. the beginning of the warm up to the end of the last organised drill). The number of satellites visualized by this unit, as well as the horizontal dilution of position, is not reported by this GPS model, and therefore, are not reported in this study.
The metrics selected for the study were total duration of training session, total distance, high-speed distance (HSD, above 19Km/h) and average speed (AvS).
Internal training load–training data
Approximately 30 min before each training session, each player was asked to provide the Hooper Index scores. This index includes four categories: fatigue, stress, muscle soreness and quality of sleep of the night that preceded the evaluation. It was used the Hooper index scale of 1–7, in which 1 is very, very low and 7 is very, very high (for stress, fatigue and muscle soreness levels) and 1 is very, very bad and 7 is very, very good (for sleep quality). The summation of
the four subjective ratings is the Hooper Index [12].
Thirty minutes following the end of each training session, players were asked to provide an
RPE rating, 0–10 scale [29]. Players were prompted for their RPE individually using a
custom-designed application on a portable computer tablet. The player selected their RPE rating by touching the respective score on the tablet, which was then automatically saved under the play-er’s profile. This method helped minimise factors that may influence a playplay-er’s RPE rating,
such as peer pressure and replicating other player’s ratings [30]. Each individual RPE value
was multiplied by the session duration to generate a session-RPE (s-RPE) value [21,31,32].
Further details regarding s-RPE are reported in Oliveira et al. [25].
Statistical analysis
Data were analysed using SPSS version 22.0 (SPSS Inc., Chicago, IL) for Windows statistical software package. Initially, descriptive statistics were used to describe and characterize the sample. Shapiro-Wilk and the Levene tests were used to assumption normality and homosce-dasticity, respectively. ANOVA was used with repeated measures with Bonferroni post hoc, once variables obtained normal distribution (Shapiro-Wilk>0.05), to compare 10 mesocycles and to compare days away from the competitive match fixture. Also, it was used ANOVA Friedman and Mann-Whitney tests were used for the variables that not obtained normal dis-tribution to compare different moments and different player positions. Results were significant with p�0.05. The effect-size (ES) statistic was calculated to determine the magnitude of effects by standardizing the coefficients according to the appropriate between-subjects standard devi-ation and was assessed using the following criteria: <0.2 = trivial, 0.2 to 0.6 = small effect, 0.6
between s-RPE and HI scores were tested with Spearman correlation. Data are represented as
mean± SD.
Results
In-season mesocycle analysis
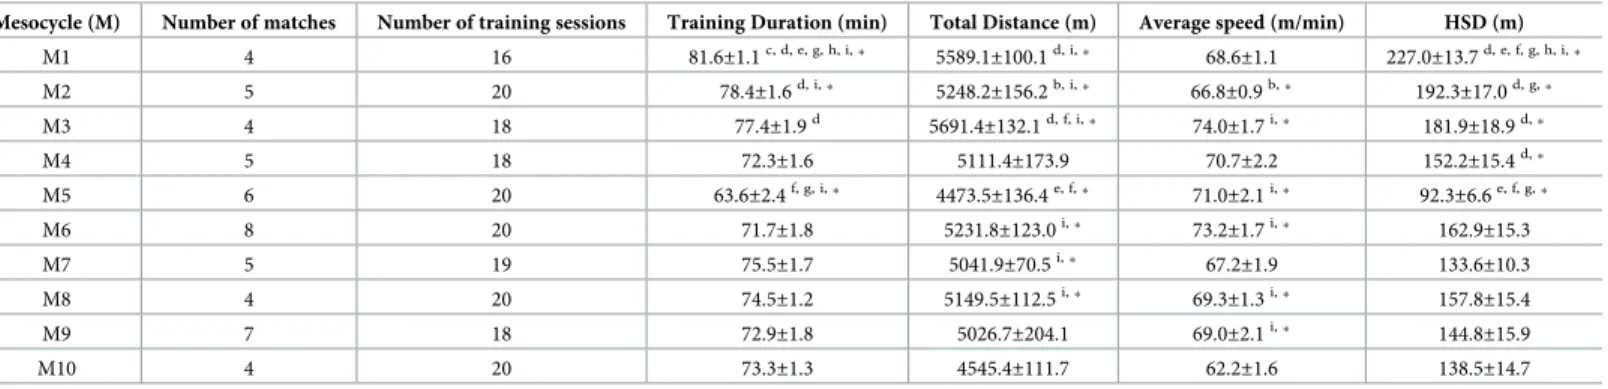
The results indicate that duration of training sessions (Table 1) had more minutes in M1 than
in other mesocycles and M5 was the lowest. There were no differences between player
posi-tions during in-season (Fig 1).
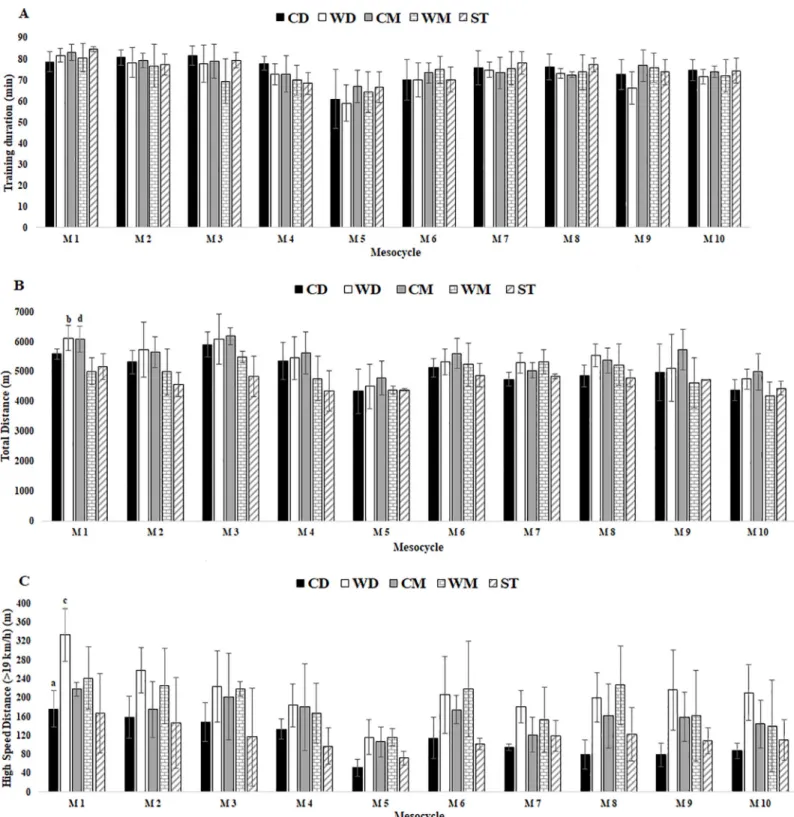
For external load, total distance tended to decrease during in-season. M1 and M3 obtained a greater distance. There were significant differences between player positions in M1 for WD
vs WM (ES = 4.87 [2.92, 6.82]), CM vs WM (ES = 5.07 [3.06, 7.09) (Fig 1).
Regarding average speed, M3 reached the highest value and M10 reached the lowest. High-speed distance reached the highest value in M1 and lowest in M5. There were signifi-cant differences between player positions in M1 for CD vs WD (ES = 5.01 [3.02, 7.00]).
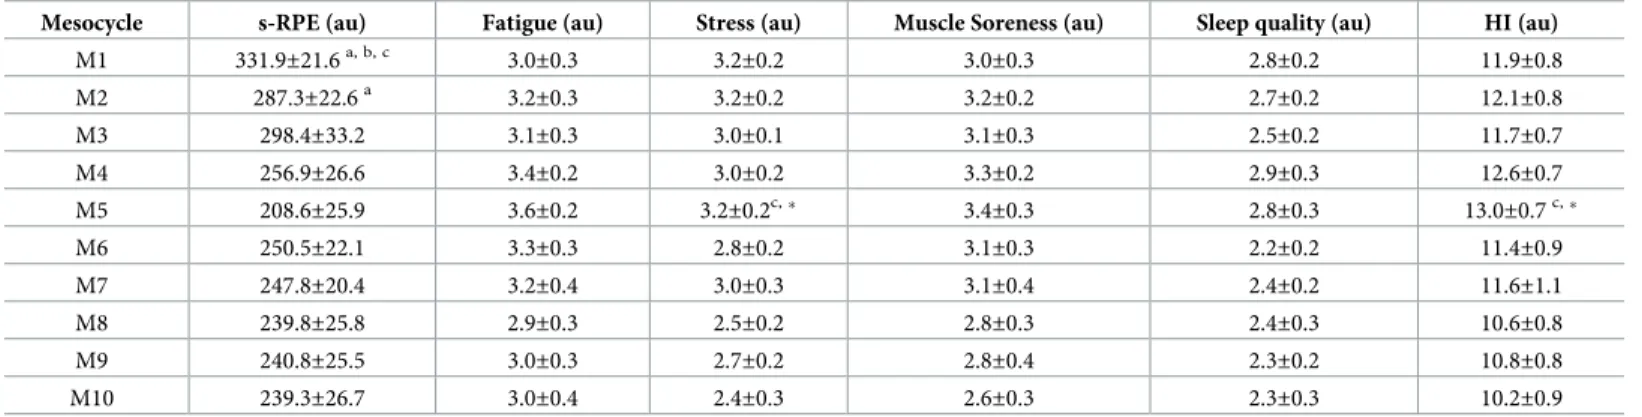
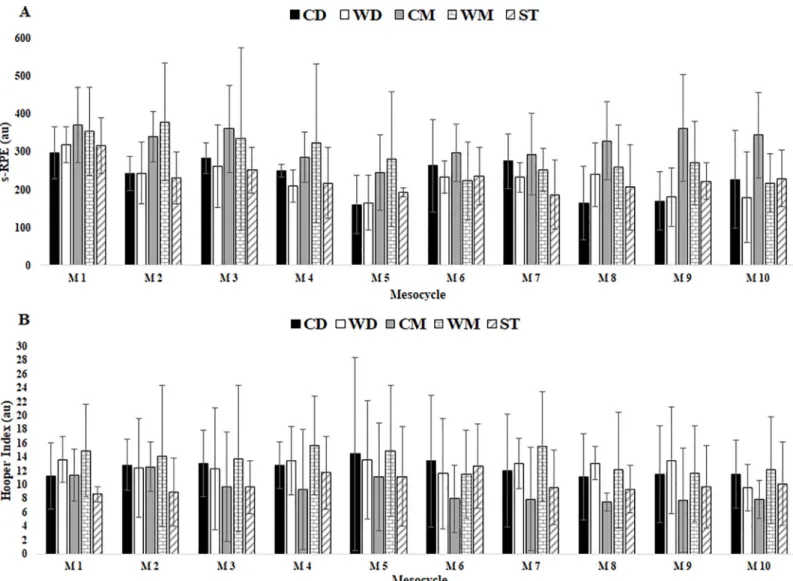
For internal load (Table 2), s-RPE was higher in M1 with a tendency to decrease until the
end of the season -, M10. There were no differences between player positions during in-season (Fig 2).
HI had fewer variations during the in-season, reaching the highest value in M5 and the low-est value in M10. Also, Stress category revealed the same results between M5 and M10. There
were no significant differences between player positions for HI scores (Fig 2).
There were associations between HI scores and s-RPE, HI scores and external TL variables, and S-RPE and external TL variables, but few correlations were found: stress and total distance in M2 (-0.634, p<0.01); fatigue and s-RPE in M9 (0.589, p<0.05); muscle soreness and s-RPE
Table 1. External Training Load Data during the ten mesocycles for squad average, Mean± SD.
Mesocycle (M) Number of matches Number of training sessions Training Duration (min) Total Distance (m) Average speed (m/min) HSD (m)
M1 4 16 81.6±1.1c, d, e, g, h, i,� 5589.1±100.1d, i,� 68.6±1.1 227.0±13.7d, e, f, g, h, i,� M2 5 20 78.4±1.6d, i,� 5248.2±156.2b, i,� 66.8±0.9b,� 192.3±17.0d, g,� M3 4 18 77.4±1.9d 5691.4±132.1d, f, i,� 74.0±1.7i,� 181.9±18.9d,� M4 5 18 72.3±1.6 5111.4±173.9 70.7±2.2 152.2±15.4d,� M5 6 20 63.6±2.4f, g, i,� 4473.5±136.4e, f,� 71.0±2.1i,� 92.3±6.6e, f, g,� M6 8 20 71.7±1.8 5231.8±123.0i,� 73.2±1.7i,� 162.9±15.3 M7 5 19 75.5±1.7 5041.9±70.5i,� 67.2±1.9 133.6±10.3 M8 4 20 74.5±1.2 5149.5±112.5i,� 69.3±1.3i,� 157.8±15.4 M9 7 18 72.9±1.8 5026.7±204.1 69.0±2.1i,� 144.8±15.9 M10 4 20 73.3±1.3 4545.4±111.7 62.2±1.6 138.5±14.7
min = minutes; m = meters; HSD = high-speed distance. adenotes difference from M2
bdenotes difference from M3 cdenotes difference from M4 ddenotes difference from M5 edenotes difference from M6 fdenotes difference from M7 gdenotes difference from M8 hdenotes difference from M9 idenotes difference from M10 all P < 0.05
�very large effect.
Fig 1. External TL data for training duration, total distance and HSD in respect to mesocycles between player positions. Abbreviations: (A) training duration; (B) total distance; (C) HSD; (CD), central defenders; (WD), wide defenders; (CM), central midfielders; (WM), wide midfielders; (ST), strikers. a denotes significant difference in CD versus WD, (b) denotes significant difference in WD versus WM, (c) denotes significant difference in WD versus ST, (d) denotes significant difference CM versus WM, all P < 0.05.
in M9 (0.487, p<0.05); fatigue and s-RPE in M11 (0.469, p<0.05); and HI total score and total distance in M11 (0.489, p<0.05).
In-season match-day-minus training comparison
The duration of training sessions (Table 3) in MD-1 and MD-5 was the second highest was the
highest. MD+1 presented the lowest training duration. No differences were found between
players positions (Fig 3).
For external load, total distance reached the highest value in MD-5 and the lowest in MD-1.
Regarding player positions (Fig 3), there were significant differences in MD-2 between WD vs
ST (5.13 [9.19, 1.07]) and CM vs ST (5.01 [9.01, 1.02]).
Average speed reached the highest value in MD-5 and the lowest in MD-1. No differences
were found between player positions (Fig 2).
High-speed distance reached the highest value in MD-5 and the lowest in MD-1. In MD-3
there were significant differences between player positions (Fig 2) for CB vs WD (4.94 [1.01,
8.89]). In MD-2 there were significant differences between CD vs WD (7.81 [2.05, 13.57]), CD vs WM (5.74 [1.31, 10.17]) and WD vs ST (6.02 [10.62, 1.41]). In MD-1 there were significant differences between CD vs WD (4.93 [0.99, 8.86]) and WD vs ST (5.03 [1.03, 9.04]).
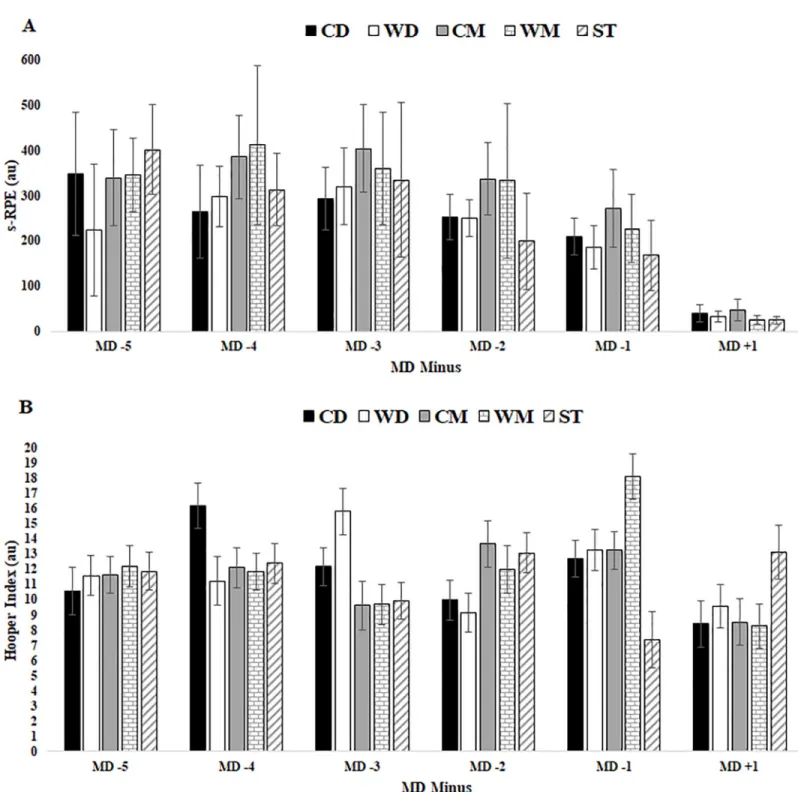
For internal load (Table 4), s-RPE reached the highest value in MD-3 and revealed a
ten-dency to decrease until MD-1. The lowest were found in MD+1. No differences were found
between player position (Fig 4).
HI and all categories had few variations during the MD minus with the exception of MD+1
where the highest values were found. No differences were found between player positions (Fig 4).
Discussion
The purpose of the present study was to quantify the internal and external TL carried out by an elite soccer team during the in-season (10 mesocycles). The main findings of the study are related to similar training load during in-season, but HSD and s-RPE were higher in the first mesocycle. Also, external TL until MD-1 while internal TL variables did not present the same
Table 2. Internal Training Load Data during the ten mesocycles for squad average, Mean± SD.
Mesocycle s-RPE (au) Fatigue (au) Stress (au) Muscle Soreness (au) Sleep quality (au) HI (au)
M1 331.9±21.6a, b, c 3.0±0.3 3.2±0.2 3.0±0.3 2.8±0.2 11.9±0.8 M2 287.3±22.6a 3.2±0.3 3.2±0.2 3.2±0.2 2.7±0.2 12.1±0.8 M3 298.4±33.2 3.1±0.3 3.0±0.1 3.1±0.3 2.5±0.2 11.7±0.7 M4 256.9±26.6 3.4±0.2 3.0±0.2 3.3±0.2 2.9±0.3 12.6±0.7 M5 208.6±25.9 3.6±0.2 3.2±0.2c,� 3.4±0.3 2.8±0.3 13.0±0.7c,� M6 250.5±22.1 3.3±0.3 2.8±0.2 3.1±0.3 2.2±0.2 11.4±0.9 M7 247.8±20.4 3.2±0.4 3.0±0.3 3.1±0.4 2.4±0.2 11.6±1.1 M8 239.8±25.8 2.9±0.3 2.5±0.2 2.8±0.3 2.4±0.3 10.6±0.8 M9 240.8±25.5 3.0±0.3 2.7±0.2 2.8±0.4 2.3±0.2 10.8±0.8 M10 239.3±26.7 3.0±0.4 2.4±0.3 2.6±0.3 2.3±0.3 10.2±0.9
M = mesocycle (1, 2, 3, etc.); s-RPE = session rating of perceived effort; HI = Hooper index; au = arbitrary units. adenotes difference from M5
bdenotes difference from M8
cdenotes difference from M10, all P < 0.05
�very large effect.
pattern. In addition, HI remained constant for all mesocycle and training sessions with the exception for the following day of the match.
In-season mesocycle analysis
For external TL variables, it was observed that the players covered a greater total distance at the start (M1 and M3) compared to the final mesocycle (M10) of the in-season, with an esti-mated difference of 1044m and 1146m, respectively. The higher distances covered at the begin-ning of the in-season may be due to the coaches still having some emphasis on physical conditioning immediately after the pre-season. In addition, the lower values in distance cov-ered for M10 could be associated with the in-season ending and consequently a reduction in external TL.
According to Impellizzeri et al. [21] and Alexiou & Coutts [23], the competitive matches
represent the greatest TL that soccer players typically experience. In addition, Malone et al. [4]
Fig 2. Internal TL data s-RPE and HI in respect to mesocycles between player positions. Abbreviations: (A) s-RPE; (B) HI; (CD), central defenders; (WD), wide defenders; (CM), central midfielders; (WM), wide midfielders; (ST), strikers. a denotes significant difference in CD versus WD, (b) denotes significant difference in WD versus WM, (c) denotes significant difference in WD versus ST, (d) denotes significant difference CM versus WM, all P < 0.05.
and Los Arcos et al. [34] reported that total distance values were significantly higher at the start of the annual in-season compared to the final stage 1304 (434–2174) m, ES = 0.84 (0.28– 1.39) and (ES = from– 0.56 to -1.20), respectively. These previous data corroborate our results because it was possible to observe higher values in M1 compared to M10, although M5 had the
lowest values for total distance (Table 1).
The present data suggest that in-season variability in TL is very limited and only minor dec-rements in TL across the in-season might occur. Apparently, this TL maintenance during the in-season could be associated with the importance of the recovery activities after the matches
and the decisions made to reduce TL until the next match [35]. Furthermore, elite European
soccer teams training programmes remain constant during all mesocycles of the in-season and
corroborate the suggestion made by Malone et al. [4] because there is a need to win matches
that does not allow the reaching of a specific peak for strength and conditioning. The average total distance covered was 5111m (4473-5691m) which was similar to the
5181m value reported by Malone et al. [4] and slightly higher than those reported by Gaudino
et al. [20] (3618-4133m). However, both the distances covered in the present study and in
Gau-dino et al. [20] study fell short in comparison to those reported by Owen et al. [19] (6871m)
because their study only included data from training sessions. This means that the study
con-ducted by Owen et al. [19] reported higher distances covered even with lower training sessions.
In terms of high-speed distance, the values (average 118m) fall within the range of that of
Gau-dino et al. [20] (88–137m) across different positions.
The results indicate that TL variables demonstrated limited relevant variation between
player positions (see Figs1and2). It seems that competitive matches have been quantified as
the most demanding session (i.e. greatest TL) of the week [7,24,25,34,36]. Previous work
cor-roborated this statement, although player position was not analysed [25]. For instance, Di
Salvo et al. [37] reported that CM generally cover more distances compared to other positions
during competitive matches. This result corroborates the current results because CM (5502m) covered more total distance than CD (5052m), WD (5388m), WM (4918m) or ST (4694m), but without statistical significance. In addition, when we compared the distance covered in high-speed running zones (zones 4+5) during in-season mesocycle analysis to positions played, a significant difference was found between positions only for M1 when comparing CD vs WD and WD vs WM. There was no other difference between player positions in all
Table 3. External Training Load Data during the MD minus for squad average, Mean± SD.
MD Duration (min) Total Distance (m) Average speed (m/min) HSD (m)
MD-5 (n = 24) 80.2±1.3b, c, d, e,� 7482.0±173.1a, b, c, d, e,� 94.1±3.0a, c, d, e,� 274.8±26.0c, d, e,� MD-4 (n = 20) 74.2±1.4d, e,� 5943.9±105.4c, d, e,� 80.4±1.2c, d, e,� 249.3±16.3c, d, e,� MD-3 (n = 24) 72.8±1.3d, e,� 6205.6±106.4c, d, e,� 85.3±1.3c, d, e,� 219.7±13.7c, d, e,� MD-2 (n = 24) 73.2±0.8d, e,� 5404.7±59.2d, e,� 73.9±0.8d, e,� 190.4±11.1d, e,� MD-1 (n = 24) 86.1±0.2e,� 3564.7±55.6e,� 41.4±0.6e,� 72.4±5.7e,� MD+1 (n = 20) 20.4±1.5 4576.7±184.8 243.8±16.4 117.8±17.8
MD- = matchday minus (5. 4. 3. 2. 1); MD+1 = matchday plus 1; min = minutes; m = meters; HSD = high-speed distance. adenotes difference from MD-4.
bdenotes difference from MD-3. cdenotes difference from MD-2. ddenotes difference from MD-1. edenotes difference from MD+1. all P < 0.01
�very large effect.
mesocycles (Fig 1). These results suggest that the WD (212.7m) and WM (186,8m) positions resulted in higher effort (>19km/h) during training when compared to all other positions (CD = 112.2, CM = 164.1, ST = 116.1m). Further, every position saw similar efforts at low speed distance (CD = 4563.7; WD = 4724.5, CM = 4767.8, WM = 4340.4, ST = 4233.3m)
which is in opposition to other studies [24,37,38].
Regarding internal TL, the s-RPE response was higher in M1 (331au) in comparison to the last mesocycle (M10, 239au) which is in line with data from external TL total distance and HSD variables. However, it is relevant to consider that this also was the mesocycle with higher training duration. Furthermore, it was found that in the middle of the season (M5) there was a lower response (208au) for this parameter. This finding could be associated with some inter-ruption for TL carried out during training sessions due to the Christmas period and with an increase in the number of matches played in M5 (6 matches). In general, there were no
differ-ences between player positions (seeFig 1). Therefore, it appears that there is no marked
varia-tion in internal TL across 10 mesocycles during the in-season. Some studies [4,5,10,11] have
also reported the limited relevant variation in TL across the in-season. This seems to suggest that professional soccer daily training practices follow a regular load pattern because they are linked to higher congestive periods of matches. Furthermore, the importance of the recovery activities following matches and the decisions made to reduce TL between matches to prevent
fatigue during this period can also play an important role in this constant TL [35].
Moreover, the data provides relevant information to quantify internal TL, measured by s-RPE during microcycles and mesocycles. This may provide relevant information to establish guidelines for soccer training periodization. The average of s-RPE during microcycles TL was
254.8au (range 33-342au). These values are lower than those reported by Scott et al. [22]
(297au: range 38-936au), but similar to Jeong et al. [39] study: 174-365au. for elite Korean
soc-cer players. The s-RPE values were also lower than the 462au of semi-professional socsoc-cer
play-ers reported by Casamichana & Castellano [18]. Another explanation for the lower values
could be related to the number of matches during each week and amongst mesocycles. It should be reemphasised that we studied a top-class elite professional European soccer team. The range of s-RPE for mesocycles of the in-season was 208-331au. Overall it would appear that in comparison to top elite soccer players, the internal TL employed by our study falls
within the boundaries of what has been previously observed [18,22,39].
Haddad et al. [16] suggested that s-RPE is not sensitive to the subjective perception of
fatigue, muscle soreness or stress levels [16]. In contrast, however, Clemente et al. [10] stated
that s-RPE could be a reliable tool to quantify the internal TL and therefore could be a good indicator for coaches and for practical applications in team sports training. Data presented in the current experiment seems to corroborate this statement, indicating that s-RPE can be an effective tool to measure the intensity and duration of training session in elite European soccer teams. On this subject, some studies have stated that RPE may be a physiological and volatile
construct that could be different according to the cognitive focus of the player [40–42].
Never-theless, Renfree et al. [43] reported that RPE can be dissociated from the physiological process
through a variety of psychological mechanisms. Therefore, RPE could be an oversimplification of the psychophysiological perceived exertion and a non-conclusive measure for capturing a
wide range of sensations experience [40,41,43]. Another major point is that RPE was collected
30 min after the end of each training session and it would be pertinent to check if there is
some variation during the training session, as contended by Ferraz et al. [41]. These arguments
may justify the fact that there were no differences in s-RPE between training days as well as the absence of a relationship with the external TL results.
HI remained similar during 10 mesocycles. In addition, comparing player positions, there
study was based on data from one vs two-matches week (p< 0.05). To the best of our
knowl-edge, this is the first study to analyse HI scores during an entire in-season. Clemente et al. [10]
showed that central defenders (12.46± 2.54) and wide midfielder (12.42 ± 3.44) had higher
val-ues of HI scores than strikers (12.18± 4.84) and wide defenders (12.16 ± 3.04). Centre
midfield-ers had the lowest HI scores (10.34± 3.87). Despite these, the authors found several significant
differences between positions but, in general, these values were small. A possible explanation for these non-consensual results could be associated with the differences in soccer TL.
In soccer training, due to the extensive use of small-sided matches and the different physical
(e.g. running) requirements associated with each position [37,44,45], training demands can
be markedly different between individuals [13,46,47]. This hypothetical difference in TL
could be amplified considering that only 11 players can start each official match, and therefore a considerable number of players per team are not exposed to the TL of the match.
As suggested by Clemente et al. [10] study, we also correlated HI scores with s-RPE and
exter-nal TL variables, and some correlations could be observed: stress and total distance in M2 (-6.34, p<0.01); fatigue and s-RPE in M9 (0.589, p<0.05); muscle soreness and s-RPE in M9 (0.487, p<0.05); fatigue and s-RPE in M11 (0.469, p<0.05); and HI total score and total distance in M11 (0.489, p<0.05). These results are not in line with the literature, which suggests non-significant correlations (r = 0.20) between s-RPE and perceived quality of sleep (from the Hooper
question-naire) [10,48]. However, Thorpe et al. [49] reported associations between s-RPE and perceived
fatigue, but not with perceived quality of sleep. It is important to note that this last study analysed data for short periods of training (microcycles). Therefore, since our study also comprised longer periods of training, we can assume that this could have influenced the current results.
In-season match-day-minus training comparison
In the present study, we also investigated the TL pattern in respect to number of days prior to a one- match week during the in-season phase.
Fig 3. External TL data for training duration, total distance and HSD in respect to days before a competitive match between player positions. Abbreviations: A) training duration; (B) total distance; (C) HSD; (CD), central defenders; (WD), wide defenders; (CM), central midfielders; (WM), wide midfielders; (ST), strikers. (a) denotes significant difference in CD versus WD, (b) denotes.
https://doi.org/10.1371/journal.pone.0209393.g003
Table 4. Internal Training Load Data during the MD minus for squad average, Mean± SD.
MD s-RPE (au) Fatigue (au) Stress (au) Muscle Soreness (au) Sleep quality (au) HI (au)
MD-5 331.7±27.0d. e,�� 3.1±0.8e,�� 2.3±0.2e,�� 2.9±0.6e,�� 1.9±0.9a,b,c,d,e 10.2±0.7e,�� MD-4 334.4±25.8c. d. e,�� 2.9±0.6e,�� 2.9±0.7e,� 2.8±0.6e,�� 2.6±0.5�� 11.1±0.6e,�� MD-3 342.4±25.3d. e,�� 2.8±0.6e,�� 2.9±0.6e,�� 2.9±0.5e,�� 2.5±0.6� 11.1±0.6e,�� MD-2 274.3±23.2d. e,�� 3.0±0.5e,�� 2.7±0.6e,�� 3.0±0.6e,�� 2.6±0.7� 11.3±0.6e,�� MD-1 212.3±15.5e,�� 2.9±0.6e,�� 2.6±0.6e,�� 2.9±0.6e,�� 2.5±0.6� 10.9±0.6e,�� MD+1 33.6±3.7 4.4±0.7 3.9±0.2 4.4±0.7 2.7±0.9� 15.4±0.7
MD- = matchday minus (5. 4. 3. 2. 1); MD+1 = matchday plus 1; s-RPE = session rating of perceived effort; HI = Hooper index; au = arbitrary units. adenotes difference from MD-4.
bdenotes difference from MD-3. cdenotes difference from MD-2. ddenotes difference from MD-1. edenotes difference from MD+1. all P < 0.01
�large effect ��very large effect.
For external TL, our data provided the following pattern by decreasing values from until 1: 5 > 4 < 3 > 2 > 1 for total distance and average speed,
MD-5 > MD-4 > MD-3 > MD-2 > MD-1 for HSD (Table 2). Our results are not in line with elite
English Premier League players for total distance and average speed, where it was found a
low-ering of the load only in MD-1 [4].
Fig 4. Internal TL data for s-RPE and HI in respect to days before a competitive match between player positions. Abbreviations: A) s-RPE; (B) HI; (CD), central defenders; (WD), wide defenders; (CM), central midfielders; (WM), wide midfielders; (ST), strikers. (a) denotes significant difference in CD versus WD, (b) denotes. https://doi.org/10.1371/journal.pone.0209393.g004
We also observed a noticeable consistent variation in external TL, total distance covered, in MD-1 when the load was significantly reduced in comparison with the rest of the training
days. Our data corroborates with some studies [4,8,49].
Finally, MD+1 revealed significant result despite the limited training duration (~20 min). The average speed and HSD has higher values than all other match days minus. One argument that can justify these results could be the high-intensity applied by the coach (which was not controlled in this study). Another explanation is related to the context, competitive schedule and the objectives defined for TL management, once MD+1 had little duration (20min). Another possible justification could be associated with a training session of recuperation with lower load for starters and a “normal” training session for non-starters.
When we compared HSD (above 19Km/h) during in-season match-day-minus by posi-tions, a significant difference was found between positions when comparing WD vs ST and CD vs WD, CD vs WM in MD-2 in MD-2. In addition, when we compared total distance cov-ered, a significant difference could be observed between CD (149m) vs WD (295m) in MD-3, CD (103m) vs WD (289m) in MD-2 and CD (49m) vs WD (111m) in MD-1; CD (103m) vs WM (240m), WD (289m) vs ST (134m) in MD-2; and also WD (111m) vs ST (43m) in MD-1 (Fig 2). These results are in line with other studies [24,37–38] that reported that CM players have consistently been found to cover more distance in general while WM players cover more distances at high-intensity running speed.
Regarding match days, Reilly & Thomas [50] and Rienzi et al. [51] stated that higher
dis-tances are covered by midfield players (11.5km); however, Bangsbo [52] reported that elite
defenders and strikers covered approximately the same distance (10–10.5km). This may be due to the nature and role of the position inside the team, as well as coaching strategy and/or game plan. During training sessions, the coach or the conditioning staff may find it advanta-geous to model training to elicit similar effort or experience the same training load regardless of position.
For internal TL, s-RPE data presented a non-perfect pattern by decreasing values from until
MD-1: MD-5 < MD-4 < MD-3 > MD-2 > MD-1 for s-RPE (Table 2), but none between
player positions (Fig 2). We also observed a noticeable consistent variation in s-RPE on MD-1
in elite soccer players, when the load was significantly reduced in comparison with the rest of
the training days [4,8,49]. In addition, the data presented by s-RPE is associated with external
TL variation.
Furthermore, HI scores revealed no variation in days prior to the match. These results are
in line with those reported by Haddad et al. [16], where it was suggested that fatigue, stress,
muscle soreness and sleep are not major contributors of perceived exertion during traditional soccer training without excessive TL. Our results also do not support Hooper and Mackinnon
[12] study because self-reported ranking of well-being does not allow the provision of efficient
mean of monitoring internal TL. In fact, the only exception was sleep quality category which revealed the lowest value and therefore bad sleep quality in MD-5. This higher value could be associated to the stimulus imposed by the previous match. It is relevant to remember that microcycles had different week-patterns and consequently, MD-5 could also be related to the following day of the match.
In opposition to the results presented for external in MD+1, internal TL, s-RPE has a lower value than all other match days (33.6 au) but HI has a higher value than all other match days
(15au) (Table 1). These results are associated with an accumulative high-intensity training
ses-sion between MD-5 and MD-2 and also supports the claim that matches represent the most
Practical applications and limitations
This study provides useful information relating to the TL employed by an elite European soc-cer team that played in a European Competition. It provides further evidence of the value of using the combination of different measures of TL to fully evaluate the patterns observed across the in-season. For coaches and practitioners, the study generates reference values for elite players which can be considered when planning training sessions. However, it is impor-tant to remember that the in-season match-day-minus training comparison was analysed by mean values and microcycles/weeks (7-day period) of the in-season have different patterns, as mentioned before. Another limitation is related to the numerous true data points missing across the 39-week data collection period due to several external factors beyond our control (e.g. technical issues with equipment, player injuries, and player transfers). Finally, GPS tech-nology used in this study does not allow to report the horizontal dilution of precision and for that reason the findings regarding external TL need to be interpreted considering such a
limi-tation as stated in Beato et al. [27].
Conclusions
In summary, we provide the first report across 10 mesocycles of an in-season that included HI scores and s-RPE to measure internal TL plus distances covered at different intensities mea-sured by GPS, in elite soccer players that played European competitions. Our results reveal that although there are some significant differences between mesocycles, there was minor vari-ation across the season for the internal and external TL variables used. In addition, it was observed that MD-1 presented a reduction of external TL during in-season match-day-minus training comparison (regardless of mesocycle) (i.e. reduction of total distance, HSD and AvS) and internal TL (s-RPE). However, the internal TL variable, HI did not change, except for MD +1. This study also provided ranges of values for different external and internal variables that can be used for other elite teams.
Acknowledgments
The authors would like to thank the team’s coaches and players for their cooperation during all data collection procedures.
Author Contributions
Conceptualization: Rafael Oliveira, João P. Brito, Ricardo Ferraz, Ma´rio C. Marques.
Data curation: Bruno Mendes.
Formal analysis: Rafael Oliveira, João P. Brito.
Funding acquisition: Daniel A. Marinho, Ricardo Ferraz, Ma´rio C. Marques. Investigation: Rafael Oliveira, João P. Brito.
Methodology: Rafael Oliveira, João P. Brito, Ricardo Ferraz, Ma´rio C. Marques.
Project administration: Rafael Oliveira, João P. Brito, Ricardo Ferraz, Ma´rio C. Marques.
Resources: Rafael Oliveira, João P. Brito, Alexandre Martins, Daniel A. Marinho, Ricardo Fer-raz, Ma´rio C. Marques.
Software: Rafael Oliveira, João P. Brito.
Validation: Rafael Oliveira, João P. Brito, Ricardo Ferraz, Ma´rio C. Marques.
Visualization: Rafael Oliveira, João P. Brito, Ricardo Ferraz, Ma´rio C. Marques.
Writing – original draft: Rafael Oliveira, João P. Brito, Alexandre Martins, Ricardo Ferraz, Ma´rio C. Marques.
Writing – review & editing: Rafael Oliveira, João P. Brito, Ricardo Ferraz, Ma´rio C. Marques.
References
1. Jones CM, Griffiths PC, Mellalieu SD. Training load and fatigue marker associations with injury and ill-ness: a systematic review of longitudinal studies. Sports Med. 2017; 47(5):943–974.https://doi.org/10. 1007/s40279-016-0619-5PMID:27677917
2. Djaoui L, Haddad M, Chamaric K, Dellal A. Monitoring training load and fatigue in soccer players with physiological markers. Physiol & Behav. 2017; 181(1):86–94https://doi.org/10.1016/j.physbeh.2017. 09.004
3. Jaspers A, Brink MS, Probst SGM, Frencken WGP, Helsen WF. Relationships Between Training Load Indicators and Training Outcomes in Professional Soccer. Sports Med. 2017; 47(3):533–544.https:// doi.org/10.1007/s40279-016-0591-0PMID:27459866
4. Malone J, Di Michele R, Morgans R., Burgess D, Morton J, Drust B. Seasonal Training-Load Quantifica-tion in Elite English Premier League Soccer Players. Int J Sports Physiol Perform. 2015; 10:489–497.
https://doi.org/10.1123/ijspp.2014-0352PMID:25393111
5. Malone S, Owen A, Newton M, Mendes B, Tiernan Leo, Hughes B et al. Wellbeing perception and the impact on external training output among elite soccer players. J Sci Med Sport. 2017; 21(1):29–34.
https://doi.org/10.1016/j.jsams.2017.03.019PMID:28442275
6. Ne´de´lec M, McCall A, Carling C, Legall F, Berthoin S, Dupont G. Recovery in soccer: Part I–post-match fatigue and time course of recovery. Sports Med. 2012; 42:997–1015.https://doi.org/10.2165/ 11635270-000000000-00000PMID:23046224
7. Stevens T, Ruiter C, Twisk L, Savelsbergh G, Beek P. Quantification of in-season training load relative to match load in professional Dutch Eredivisie football players. Sci Med Football. 2017; 1(2):117–125.
http://dx.doi.org/10.1080/24733938.2017.1282163
8. Akenhead R, Harley JA, Tweddle SP. Examining the external training load of an English Premier Lea-gue football team with special reference to acceleration. J Strength Cond Res. 2016; 30(9):2424–32.
https://doi.org/10.1519/JSC.0000000000001343PMID:26817740
9. Anderson L, Orme P, Di Michele R, Close GL, Morgans R, Drust B, et al. Quantification of training load during one-, two- and three-game week schedules in professional soccer players from the English Pre-mier League: implications for carbohydrate periodisation. J Sports Sci. 2016; 34(13):1250–9.https:// doi.org/10.1080/02640414.2015.1106574PMID:26536538
10. Clemente F., Mendes B, Nikolaidis P, Calvete F, Carric¸o S, Owen A. Internal training load and its longi-tudinal relationship with seasonal player wellness in elite professional soccer. Physiol Behav. 2017; 179:262–267.https://doi.org/10.1016/j.physbeh.2017.06.021PMID:28668619
11. Morgans R, Adams D, Mullen R, McLellan C, Williams M. Technical and physical performance over and English championship league season. Int J Sport Sci Coaching. 2014; 9(5):1032–1042.https://doi.org/ 10.1260/1747-9541.9.5.1033
12. Hooper SL, Mackinnon LT. Monitoring overtraining in athletes. Sports Med, 1995; 20(5):321–327.
https://doi.org/10.2165/00007256-199520050-00003PMID:8571005
13. Impellizzeri FM, Rampinini E, Marcora SM. Physiological assessment of aerobic training in soccer. J Sports Sci, 2005; 23:583–592.https://doi.org/10.1080/02640410400021278PMID:16195007
14. Vanrenterghem J, Nedergaard NJ, Robinson MA, Drust B. Training load monitoring in team sports: A novel framework separating physiological and biomechanical load-adaptation pathways. Sports Med. 2017; 47(11):2135–2142.https://doi.org/10.1007/s40279-017-0714-2PMID:28283992
15. Foster C. Monitoring training in athletes with reference to overtraining syndrome. Med Sci Sports Exerc. 1998; 30:1164–8. PMID:9662690
16. Haddad M, Chaouachi A, Wong DP, Castagna C, Hambli M, Hue O, et al. Influence of fatigue, stress, muscle soreness and sleep on perceived exertion during submaximal effort. Physiol Behav. 2013; 119:185–189.https://doi.org/10.1016/j.physbeh.2013.06.016PMID:23816982
17. Halson SL. Monitoring Training Load to Understand Fatigue in Athletes. Sports Med. 2014 44(2): S139–47.https://doi.org/10.1007/s40279-014-0253-zPMID:25200666
18. Casamichana D, Castellano J, Calleja-Gonzalez J, San Roma´ n J, Castagna C. Relationship between indictors of training load in soccer players. J Strength Cond Res. 2013; 27: 369–374.https://doi.org/10. 1519/JSC.0b013e3182548af1PMID:22465992
19. Owen AL, Wong P, Dunlop G, Groussard C, Kebsi W, Dellal A, et al. High intensity training and salivary immunoglobulin—A responses in professional top-level soccer players: effect of training intensity. J Strength Cond Res. 2016; 30(9):2460–9.https://doi.org/10.1519/JSC.0000000000000380PMID:
24448005
20. Gaudino P, Iaia FM, Alberti G, Strudwick AJ, Atkinson G, Gregson W. Monitoring training in elite soccer players: a systematic bias between running speed and metabolic power data. Int J Sports Med. 2013; 34(11): 963–8.https://doi.org/10.1055/s-0033-1337943PMID:23549691
21. Impellizzeri FM, Rampinini E, Coutts AJ, Sassi A., Marcora S.M. Use of RPE-Based Training Load in Soccer. Med Sci Sports Exerc. 2004; 36(6):1042–1047 PMID:15179175
22. Scott BR, Lockie RG, Knight TJ, Clark AC, Janse de Jonge XA. A comparison of methods to quantify the in- season training load of professional soccer players. Int J Sports Physiol Perform. 2013; 8 (2):195–202. PMID:23428492
23. Alexiou H, Coutts AJ. A comparison of methods used for quantifying internal training load in women soc-cer players. Int J Sports Physiol Perform. 2008; 3:320–330. PMID:19211944
24. Bradley PS, Sheldon W, Wooster B, Olsen P, Boanas P, Krustrup P. High-intensity running in English FA Premier League soccer matches. J Sports Sci. 2009; 27:159–168.https://doi.org/10.1080/ 02640410802512775PMID:19153866
25. Oliveira R, Brito J, Martins A, Mendes B, Calvete F, Carric¸o S, Ferraz R, Marques M, In-season training load quantification of one-, two- and three-game week schedules in a top European professional soccer team. Physiol Behav. 2019; 201:146–156https://doi.org/10.1016/j.physbeh.2018.11.036PMID:
30529511
26. Jennings D, Cormack S, Coutts A, Boyd L, Aughey R. Variability of GPS units for measuring distance in team sport movements. Int J Sports Physiol Perform. 2010; 5:565–569. PMID:21266740
27. Beato M, Devereux G, Stiff A. Validity and Reliability of Global Positioning System Units (STATSports Viper) for Measuring Distance and Peak Speed in Sports. J Strength Cond Res. 2018; 32(10): 2831– 2837.https://doi.org/10.1519/JSC.0000000000002778PMID:30052603
28. Maddison R, Ni Mhurchu C. Global positioning system: A new opportunity in physical activity measure-ment. Int J Behav Nutr Phys Act. 2009; 4; 6:73.https://doi.org/10.1186/1479-5868-6-73PMID:
19887012
29. Borg G. Perceived exertion as an indicator of somatic stress. Scand J Rehabil Med. 1970; 2:92–98. PMID:5523831
30. Burgess D, Drust B. Developing a physiology-based sports science support strategy in the professional game. In: Williams M, ed. Science and Soccer: Developing Elite Performers. Oxon, UK: Routledge. 2012:372–389.
31. Foster C, Hector L, Welsh R, Schrager M, Green M, Snyder A. Effects of specific versus cross-training on running performance. Eur J Appl Physiol Occup Physiol. 1995:367–272.https://doi.org/10.1007/ BF00865035PMID:7649149
32. Foster C, Florhaug JA, Franklin J, Gottschall L, Hrovatin LA, Parker S, et al. A new approach to monitor-ing exercise trainmonitor-ing. J Strength Cond Res 2001; 15:109–115. PMID:11708692
33. Hopkins W, Marshall S, Batterham A, Hanin J. Progressive statistics for studies in sports medicine and exercise science. Med Sci Sports Exerc. 2009; 41(1):3–12.https://doi.org/10.1249/MSS.
0b013e31818cb278PMID:19092709
34. Los Arcos A, Mendez-Villanueva A, Martı´nez-Santos R. In-season training periodization of professional soccer players. Biol Sport. 2017; 34(2):149–155.https://doi.org/10.5114/biolsport.2017.64588PMID:
28566808
35. Moreira A, Bilsborough JC, Sullivan CJ, Ciancosi M, Aoki MS, Coutts AJ. The Training Periodization of Professional Australian Football Players During an Entire AFL Season. Int J Sports Physiol Perform. 2015; 10(5):566–71.https://doi.org/10.1123/ijspp.2014-0326PMID:25405365
36. Los Arcos A, Yanci J, Mendiguchia J, Gorostiaga EM. Rating of muscular and respiratory perceived exertion in professional soccer players. J Strength Cond Res. 2014; 28:3280–3288.https://doi.org/10. 1519/JSC.0000000000000540PMID:24845209
37. Di Salvo V, Baron R, Tschan H, Calderon Montero FJ, Bachl N, Pigozzi F. Performance characteristics according to playing position in elite soccer. Int J Sports Med. 2007; 28:222–227.https://doi.org/10. 1055/s-2006-924294PMID:17024626
38. Di Salvo V, Gregson W, Atkinson G, Tordoff P, Drust B. Analysis of high intensity activity in Premier League soccer. Int J Sports Med. 2009; 30(3):205–12.https://doi.org/10.1055/s-0028-1105950PMID:
19214939
39. Jeong T, Reilly T, Morton J, Bae S, Drust B. Quantification of the physiological loading of one week of “pre-season” and one week of “in-season” training in professional soccer players. J Sport Sci. 2011; 29 (11):1161–1166.https://doi.org/10.1080/02640414.2011.583671PMID:21777053
40. Ferraz R, Gonc¸alves B, Van Den Tillaar R, Jimenez S, Sampaio J, Marques M. Effects of knowing the task duration on players’ pacing patterns during soccer small-sided games. J Sport Sci. 2017:1–7.
https://doi.org/10.1080/24733938.2017.1283433PMID:28134013
41. Ferraz R, Gonc¸alves B, Coutinho D, Marinho D, Sampaio J, Marques M. Pacing behaviour of players in team sports: Influence of match status manipulation and task duration knowledge. PLoS ONE. 2018; 13(2): e0192399.https://doi.org/10.1371/journal.pone.0192399PMID:29401476
42. Gibson SAC, Lambert EV, Rauch LHG, Tucker R. The role of information processing between the brain and peripheral physiological systems in pacing and perception of effort. Sports Med. 2006.https://doi. org/10.2165/00007256-200636080-00006.
43. Renfree A, Martin L, Micklewright D, Gibson A. Application of decision-making theory to the regulation of muscular work rate during self-paced competitive endurance activity. Sports Med. 2014; 44(2):147– 58.https://doi.org/10.1007/s40279-013-0107-0PMID:24113898
44. Castellano J, Alvarez-Pastor D, Bradley P.S. Evaluation of research using computerised tracking sys-tems (Amisco and Prozone) to analyse physical performance in elite soccer: a systematic review. Sports Med. 2014; 44:701–712.https://doi.org/10.1007/s40279-014-0144-3PMID:24510701
45. Rampinini E, Coutts AJ, Castagna C, Sassi R, Impellizzeri FM. Variation in top level soccer match per-formance. Int J Sports Med. 2007; 28:1018–1024.https://doi.org/10.1055/s-2007-965158PMID:
17497575
46. Los Arcos A, Martı´nez-Santos R, Yanci J, Mendiguchia J, Mendez-Villanueva A. Negative associations between perceived training load, volume and changes in physical fitness in professional soccer players. J Sports Sci Med. 2015; 14:394–401. PMID:25983590
47. Manzi V, Bovenzi A, Impellizzeri FM, Carminati I, Castagna C. Individual training-load and aerobic-fit-ness variables in premiership soccer players during the precompetitive season. J Strength Cond Res. 2013; 27:631–636.https://doi.org/10.1519/JSC.0b013e31825dbd81PMID:22648141
48. Moalla W, Fessi MS, Farhat F, Nouira S, Wong DP, Dupont G. Relationship between daily training load and psychometric status of professional soccer players, Res Sport Med. 2016; 24(4):387–394.https:// doi.org/10.1080/15438627.2016.1239579PMID:27712094
49. Thorpe RT, Strudwick AJ, Buchheit M, Atkinson G, Drust B, Gregson W. Monitoring Fatigue During the In-Season Competitive Phase in Elite Soccer Players. Int J Sports Physiol Perform. 2015; 10:958–964.
https://doi.org/10.1123/ijspp.2015-0004PMID:25710257
50. Reilly T, Thomas V. A motion analysis of work-rate in different positional roles in professional football match-play. J Hum Mov Stud. 1976; 2:87–89.
51. Rienzi E, Drust B, Reilly T, Carter JEL, Martin A. Investigation of anthropometric and work-rate profiles of elite South American international soccer players. J Sports Med Phys Fitness. 2000; 40:162–169. PMID:11034438
52. Bangsbo J. The physiology of soccer with special reference to intense intermittent exercise. Acta Phy-siol Scand Suppl. 1994; 151(619):1–156. PMID:8059610