Introduction
The high physical demand required on high-level soccer has been previously demonstrated1–3; indeed, the actions during a game involve running in different intensity levels, repeated changes of direction, tackles and jumps with short recovery time. Therefore, a big concern of team staff and researchers is to find tools that exactly represents the physical requirement of the game and how to control the training loads over the season4,5.
Due to this need, monitoring tools have emerged, one of the most used is the Global Positioning System (GPS), which are based in triaxial accelerometers (acceleration on anteroposterior, lateral and vertical axis), providing variables such as Player Load, the number of sprints and distance covered in different intensity levels, especially high intensity, which are important indicators of external load3. In addition to this, the session rating perceived exertion (session-RPE), first proposed by Foster et al.6 and after showed on soccer4,7, has also been widely used as an internal load variable, in other words, how the athlete feels about the external load imposed by the match. Although GPS and the session-RPE jointly represent accurately the external and internal match loads, a crucial point to the physical performance happens hours after the game, the recovery. Nédélec, McCall, Carling, Legall, Berthoin, Dupont8 describe that the post-game recovery is important to the soccer, because the time between two matches is short, usually each two or three days, impairing athletes’ complete recovery. When recovery is not allowed, ath-letes are submitted to a greater injury risk9. Thus, as important as the external and internal load from the game, is to evaluate how recovered the athletes are when they come back to training. In this regard, Laurent et al.10 developed the perceived recovery scale (PRS); a 10-point scale in which 0 means “very poorly recovered/extremely tired” and 10 means “very well recovered/ highly energetic”. The authors demonstrated that the scores on
the scale were sensitive to the decrease, maintenance and en-hancement of repeated sprints performance (r = -0.63), once an inefficient recovery does not allow performance maintenance, in contrast, an efficient recovery allows physiological adjustments that promote the performance enhancement.
Studies have pointed that the external load during the games is different between the positions, with midfielders covering higher total distance and players who work by the sides of the field covering greater distances in high intensity2,5. In contrast, to our knowledge, there are no studies elucidating the internal load and, mainly, the recovery status by playing position. Thus, it is necessary that research with this theme consider this practical question of the soccer game, since this information is important for the decision making during the training process. In synthesis, if there is a difference between the external load during the game, it is rational to assume that the internal load and the recovery behave in the same way. In addition, to get closer to the sport reality, the match outcome (wins, losses and draws) may also be different in relation to the external and internal load and recovery, since the actions per -formed during the game aim to take the lead, and the situation that the team is (loosing, winning or drawing) may reflect the technical actions and consequently the physical efforts.
On the above, the aim of present study was to compare the internal and external load and the recovery by playing position and match outcome (wins, losses or draws) on professional soccer.
Methods
Design
It was analyzed nine official matches of the first division of the local soccer championship (ranking stage). During the games, Original Article
Comparisons of recovery, external and internal load by playing
position and match outcome in professional soccer
Juan H.S. Conde¹, Danilo L. Alves¹*, Luiz F. Novack¹, Carolina F. Carneiro¹, Ramon Cruz², Raul Osiecki¹.
¹Universidade Federal do Paraná, UFPR, Curitiba, PR, Brazil; ²Universidade de São Paulo, USP, São Paulo, SP, Brazil.
Abstract — Aimsː To compare the internal and external load and the recovery by playing position and the match outcome (wins, losses or draws) in professional soccer. Methodsː Twenty-three male professional soccer athletes from
a team of the first division of the Brazilian Championship took part into the study (age 26.1 ± 3.8 years old, weight 77.5 ± 5.0 kg, height 177.6 ± 5.1 cm). During the games, athletes were monitored by GPS and the variables of external loads were taken. Additionally, the session rating of perceived exertion (session RPE) and the perceived recovery scale (PRS) were collected 30 minutes and 40h after the end of the matches, respectively. Resultsː The external load was greater
on full-backs and defense midfielders (p<0.05). The full-backs cover higher total distances compared to attackers, and, compared to all the others positions, they have more stimuli > 20 km/h, covering higher distances >20 km/h; these stimuli makes them to perceive less recovered than defenders, defense and attack midfielders (p<0.05). Moreover, the defenders are those who cover lower distances by the minute and the defense midfielders are those who present the lower Peak Velocity (p<0.05). There were no significant differences between GPS variables, internal load and recovery. In addition, it was found a correlation between the external and the internal load (r=0.66; p=0.001). Conclusionsː The GPS variables and the perceived recovery are influenced by the playing position, but not by the match outcome.
the athletes were monitored by a GPS device and the following external load variables were taken: Player Load Total; Player Load/min; Total Distance; Distance m/min; Distance > 20 km/h; Quantity of Stimuli > 20 km/h and Peak Velocity. Thirty minutes after the matches, the session RPE was obtained and around forty hours after each match and before, the athletes answered the perceived recovery scale (PRS).
Participants
Twenty-three male professional soccer athletes from a team of the first division of the Brazilian Championship took part
into the study (age 26.01 ± 3.8 years old, weight 77.5 ± 5.0 kg, height 177.6 ± 5.1 cm). The athletes were analyzed during 9 official matches. Thus, the “n” for each position was: defenders (f = 20), full-backs (f = 13), defense midfielders (f = 21), attack midfielders (f = 11) and attackers (f = 26). Figure 1 demonstrates the game positions used at present study. To be included in the study, players must be acting in official matches of the first divi -sion of the local Championship. All subjects signed an informed consent form after verbal and written explanations regarding the study. All methodological procedures were approved by the local Ethics Committee of Federal University of Paraná (protocol number: 2.300.528).
Procedures
External load was monitored through the OPTIMEYE S5 device (Catapult®, OPTIMEYE S5, Melbourne, Australia) positioned between the scapula, into a waistcoat. The device is composed by two GPS and three accelerometers that capture the athletes’ movements (up and down, right and left, forward and backward) and sends the information in real time by telemetry. The exter -nal load variables were Player Load, Player Load/min, Total Distance, Distance m/min; Distance > 20 km/h; Quantity of Stimuli > 20 km/h and Peak Velocity. The velocity limits used in the present study were jogging: 6,1 to 12 km/h; running: 12,1 to 15 km/h, moderate intensity running: 15,1 to 18 km/h, high intensity running: 18,1 to 20 km/h, very high intensity running: 20,1 to 23 km/h and sprint: >23 km/h, which were arbitrarily
determined according to the reality of the club and were based on the previous studies1,2,7,11–14.
Thirty minutes after the end of the matches the session RPE were collected using the RPE scale CR10 transformed by Foster et al6. Using the anchorages proposed on the scale, athletes were instructed to answer the following question: “What was the game intensity?”. This method has been used in various studies, showing its scientific validity and practical applicability4,15,16. Athletes were previously familiarized with the scale, once this is used as a daily control. The internal load (TRIMP-RPE) was calculated and expressed in arbitrary units (U.A.) by multiplying the session RPE score by the time (in minutes) of participation of the each athlete into the match6.
The perceived recovery was measured through the perceived recovery scale (PRS) proposed scale by Laurent et al10. PRS
Figure 1. - Playing positions adopted in the present study.
Defenders Defence midfielders Attack Midfielders Attackers
Full-backs
is a 10-point scale in which 0 means “very poorly recovered/ extremely tired” and 10 means “very well recovered/highly energetic”. The PRS was measured approximately 40 hours after the matches, after the day off and before the first training session after the games. They were instructed to answer the fol-lowing question: “How recovered are you?” using the anchorages proposed on the scale. The numerical answer could be provided in decimals, and the athletes were previously familiarized with the scale because it is used as a daily control.
Statistical Analysis
Normality was tested by the Kolmogorov-Smirnov test and the assumption of the linearity and homogeneity of variance-covariance was verified by the Levene’s test, which has been satisfied. Descriptive values were presented in mean ± standard deviation. A univariate analysis (ANOVA) and Bonferroni post hoc was performed to compare the internal and external load and recovery (dependent variables) between playing position and match outcome (independent variables) To check the association between the internal load (TRIMP-RPE) and external load (Player
Load Total – GPS), Pearson correlation was used. All the statistical analysis were conducted using the statistic software SPSS version 21.0 (IBM Corp, Armonk, NY), significance was set at p ≤ 0.05.
Results
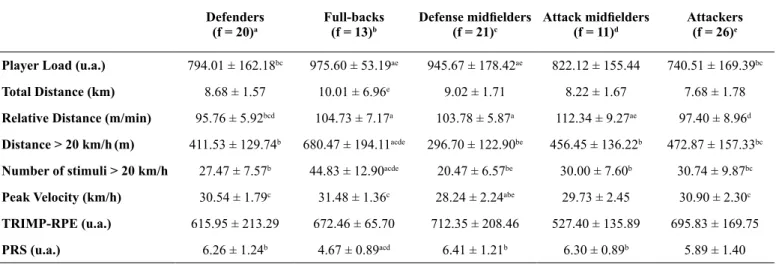
The internal and external loads and recovery values according to playing position are presented in table 1. The comparison between playing position prove differences on GPS variables and perceived recovery (PRS). The external load (indicated by Player load, distance m/min and total distance) were greater on full-backs and defense midfielders. The full-backs cover higher total distances compared to attackers, and, compared to all the others positions, they have more stimuli > 20 km/h, covering higher distances >20 km/h; these stimuli makes them to perceive less recovered than defenders, defense and attack midfielders. In addition to these results, it was also possible to see that the defenders are those who cover lower distances per minute and the defense midfield -ers are those who present the lower Peak Velocity. A significant correlation was found between the external load (total Player Load) and the internal load (TRIMP-RPE) (r = 0.66; p = 0.001).
Table 1. - Comparison of external and internal load and recovery by playing position.
Defenders (f = 20)a
Full-backs (f = 13)b
Defense midfielders
(f = 21)c
Attack midfielders
(f = 11)d
Attackers (f = 26)e
Player Load (u.a.) 794.01 ± 162.18bc 975.60 ± 53.19ae 945.67 ± 178.42ae 822.12 ± 155.44 740.51 ± 169.39bc
Total Distance (km) 8.68 ± 1.57 10.01 ± 6.96e 9.02 ± 1.71 8.22 ± 1.67 7.68 ± 1.78
Relative Distance (m/min) 95.76 ± 5.92bcd 104.73 ± 7.17a 103.78 ± 5.87a 112.34 ± 9.27ae 97.40 ± 8.96d
Distance > 20 km/h(m) 411.53 ± 129.74b 680.47 ± 194.11acde 296.70 ± 122.90be 456.45 ± 136.22b 472.87 ± 157.33bc
Number of stimuli > 20 km/h 27.47 ± 7.57b 44.83 ± 12.90acde 20.47 ± 6.57be 30.00 ± 7.60b 30.74 ± 9.87bc
Peak Velocity (km/h) 30.54 ± 1.79c 31.48 ± 1.36c 28.24 ± 2.24abe 29.73 ± 2.45 30.90 ± 2.30c
TRIMP-RPE (u.a.) 615.95 ± 213.29 672.46 ± 65.70 712.35 ± 208.46 527.40 ± 135.89 695.83 ± 169.75
PRS (u.a.) 6.26 ± 1.24b 4.67 ± 0.89acd 6.41 ± 1.21b 6.30 ± 0.89b 5.89 ± 1.40
a=significant difference to the defender, b= significant difference to the full-back, c= significant difference to the defense midfielder, d= significant difference to the attacker midfielder, e= significant difference to the attacker. p ≤ 0.05.
On Table 2 is presented the comparison of external and internal load variables and perceived recovery according to the match outcome. There were no significant differences between
GPS variables, internal load (TRIMP-RPE) and recovery (PRS). Thus, the variables analyzed are influenced by playing position, but not by match outcome.
Table 2. - Comparison of external and internal load and recovery by the result.
Wins (f = 60) Losses (f = 10) Draws (f = 21)
Player Load (u.a.) 856.79 ± 130.62 864.53 ± 173.08 828.71 ± 189.74
Discussion
The main result of the study was that, although the external load has been different between playing position, the internal load was similar. However, except for the attackers, the perceived recovery of the full-backs was the lowest compared to the other positions. In this study, the full-backs and the defense midfielders had higher total Player Load (external load) com -pared to defenders and attackers, although it was not different from attack-midfielders. In addition, the attack-midfielders covered higher relative distance (m/min) compared to defend-ers and attackdefend-ers, results also observed by Di Salvo, Baron, Tschan, Calderon Montero, Bachl, Pigozzi2, Suarez-Arrones et al.3 and Torrenõ, Munguia-Izquierdo, Coutts, De Villarreal, Asian-Clemente, Suarez-Arrones5, who demonstrated that the athletes that act on midfield (midfielders and wide midfielders) were those who cover higher distances during the game, when compared to defenders and attackers.
However, these same studies pointed that the players who act on by the sides of the field cover greater high intensity distances. In the study by Di Salvo, Baron, Tschan, Calderon Montero, Bachl, Pigozzi2, the wide-midfielders and full-backs covered, respectively, 446 ± 161 m and 402 ± 165 m above 23 km/h; on the other hand, the defenders and the attack-mid-fielders covered 215 ± 100 m and 248 ± 116 m above 23 km/h. The attackers covered 404 ± 140 m. In the study by Torreño, Munguia-Izquierdo, Coutts, De Villarreal, Asian-Clemente, Suarez-Arrones5, the wide-midfielders were those who covered greater distance above 18 km/h (15 ± 3 m/min and 14 ± 2 m/ min on the first and second half, respectively) compared to the other positions. These results support the findings of the present study in which the full-backs were those who performed the greater number of stimuli above 20 km/h and, consequently, covered greater distances in high intensity (44.83 ± 12.9 stimuli and 680.47 ± 194.11 m, respectively). The full-backs have as function to participate in the transition from the defense to the offense, involving high intensity running through the sides of the field, which helps to explain the result obtained in our study.
Another important finding was that even the game’s perceived exertion being similar between the playing positions, the full-backs perceived recovery was lower compared to the others, with exception of the attackers, which may be related to the number of stimuli at high intensity and the high intensity cov-ered distance. Indeed, Aquino et al.17 demonstrated a significant correlation between the number of sprints performed during a simulated soccer game and the percentage of alteration of the
creatine kinase (CK) and lactate dehydrogenase (LDH) blood concentration (r = 0.83 and r = 0.90, respectively) after the game. In addition, Osiecki et al.18 found an inverse relationship between the CK and the perceived recovery (r = -0.75) after an official soccer game. These results point that, due to the deceleration after sprints (eccentric contractions), it occurs a greater muscle damage, negatively influencing the soccer athlete’s recovery, corroborating with our results. However, the perceived recovery of the full-backs was 4.67 ± 0.89 u.a., and the other positions obtained means around five and six. At scale, these scores cor -respond to “somewhat recovered”, “adequately recovered” and “moderately recovered”, respectively, indicating a recovery level that allow the athlete to maintain the performance10, although at the practical environment it is necessary to consider other external and internal load and recovery variables to help on the decision-making about the participation or not of an athlete in the next match.
The Training impulse of the RPE (TRIMP-RPE) is a method that considers the session-RPE and the game duration, generat -ing a score that is be-ing used by soccer clubs to monitor the internal load4. These variables, added to the external load, in -dicate the physical distress suffered on the game. In this study, a significant correlation between internal and external load (r = 0.66; p = 0.001) has been observed. In addition, the internal load was not different between positions (variation of 527.40 ± 135.89 u.a. to 712.35 ± 208.46 u.a.), which is in agreement to the studies by Arcos, Yanci, Mendiguchia and Gorostiaga19, in which it was showed that the TRIMP-RPE of soccer players after a game was 650 ± 100 u.a. and the session-RPE around 6, corresponding to an intensity between “hard” and “very hard”.
Our results proved that there was no difference on recovery, internal and external load variables between wins, losses, and draws. However, in a practical point of view, it could be explained by the fact that the actions performed on defense and offense aim to take the lead. In the other words, when the team is losing, the actions are performed to score a goal, and when the team is winning, the actions are performed to avoid the opponent’s goal. This behavior makes the internal and external load and the recovery very similar regardless the team is losing, drawing or winning the game.
It’s important to recognize some limitations. In the present study, no biochemical indicators of muscle damage were used. These data would provide additional information regarding ath-letes’ distress and recovery. Another point was that the analysis related to the match outcome was not detailed by playing posi-tion, however, it was necessary due to the sample, that would
Relative Distance (m/min) 102.40 ± 8.18 102.00 ± 9.85 100.78 ± 9.16
Distance > 20 km/h(m) 490.71 ± 171.39 474.91 ± 157.15 432.62 ± 198.50
Number of stimuli > 20 km/h 29.60 ± 9.35 32.05 ± 10.60 28.98 ± 12.22
Peak Velocity (km/h) 31.13 ± 2.56 30.10 ± 2.19 30.06 ± 2.32
TRIMP-RPE (u.a.) 683.20 ± 149.07 693.50 ± 170.55 636.44 ± 192.03
have insufficient subjects for each position, which would limit the power of the analysis, once the considered period had five wins, two losses, and two draws. However, the methodology and the instruments used in the study significantly contribute to the literature and to the soccer clubs. Since the full-backs cover greater distances above 20 km/h and consequently, have less recovery, it is recommended to carry out interventions that allow physical preparation with specific characteristics and a better recovery for this specific position and/or that the clubs have op -tions on the bench to replace these athletes if it is identified that the recovery was insufficient and there is a higher injury risk.
Conclusions
In summary, our results point that the full-backs are the athletes who cover greater distances >20 km/h, reflecting in a lower perceived recovery when compared to the other positions. Additionally, there was no difference on recovery, external and internal load variables according to the match outcome (wins, losses, and draws).
References
1. Bradley PS, Sheldon W, Wooster B, Olsen P, Boanas P, Krustrup
P. High-intensity running in English FA Premier League soccer matches. J Sports Sci. 2009 Jan;27(2):159–68.
2. Di Salvo V, Baron R, Tschan H, Calderon Montero FJ, Bachl
N, Pigozzi F. Performance characteristics according to playing position in elite soccer. Int J Sports Med. 2007 Mar;28(3):222–7.
3. Suarez-Arrones L, Torreno N, Requena B, Saez De Villarreal E,
Casamichana D, Barbero-Alvarez JC, et al. Match-play activity profile in professional soccer players during official games and the relationship between external and internal load. J Sports Med Phys Fitness. 2015 Dec;55(12):1417–22.
4. Impellizzeri FM, Rampinini E, Coutts AJ, Sassi A, Marcora SM.
Use of RPE-based training load in soccer. Med Sci Sports Exerc. 2004 Jun;36(6):1042–7.
5. Torreno N, Munguia-Izquierdo D, Coutts A, De Villarreal ES,
Asian-Clemente J, Suarez-Arrones L. Relationship between external and internal loads of professional soccer players during full matches in official games using global positioning systems
and heart-rate technology. Int J Sports Physiol Perform. 2016
Oct;11(7):940–6.
6. Foster C, Florhaug JA, Franklin J, Gottschall L, Hrovatin LA,
Parker S, et al. A new approach to monitoring exercise training. J strength Cond Res. 2001 Feb;15(1):109–15.
7. Casamichana D, Castellano J, Calleja-Gonzalez J, San Román J,
Castagna C. Relationship Between Indicators of Training Load in Soccer Players. J Strength Cond Res. 2013 Feb;27(2):369–74.
8. Ndlec M, McCall A, Carling C, Legall F, Berthoin S, Dupont G.
Recovery in Soccer: Part I-post-match fatigue and time course of
recovery. Vol. 42, Sports Medicine. 2012. p. 997–1015.
9. Jones NS. Update: soccer injury and prevention, concus
-sion, and chronic groin pain. Curr Sports Med Rep [Internet]. 2014;13(5):319–25.
10. Laurent CM, Green JM, Bishop PA, Sjökvist J, Schumacker RE,
Richardson MT, et al. A practical approach to monitoring recovery:
development of a perceived recovery status scale. J strength Cond
Res [Internet]. 2011 Mar;25(3):620–8.
11. Mohr M, Krustrup P, Bangsbo J. Match performance of high-standard soccer players with special reference to development
of fatigue. J Sports Sci. 2003;21(7):519–28.
12. Di Salvo V, Gregson W, Atkinson G, Tordoff P, Drust B. Analysis of high intensity activity in Premier League soccer. Int J Sports
Med. 2009;30(3):205–12.
13. Scott BR, Lockie RG, Knight TJ, Clark AC, Janse de Jonge XAK.
A comparison of methods to quantify the in-season training load
of professional soccer players. Int J Sports Physiol Perform.
2013;8(2):195–202.
14. Akenhead R, Harley JA, Tweddle SP. Examining the External
Training Load of an English Premier League Football Team With Special Reference to Acceleration. J Strength Cond Res [Internet]. 2016 Sep;30(9):2424–32.
15. Alexiou H, Coutts AJ. A comparison of methods used for quanti -fying internal training load in women soccer players. Int J Sports
Physiol Perform. 2008;3(3):320–30.
16. Borresen J, Lambert MI. The Quantification of Training Load ,
Effect on Performance. Sport Med [Internet]. 2009;39(9):779–95.
17. Aquino RL, Gonçalves LG, Vieira LH, Oliveira LP, Alves GF,
Santiago PR, et al. Biochemical, physical and tactical analysis
of a simulated game in young soccer players. J Sports Med Phys
Fitness. 2016 Dec;56(12):1554–61.
18. Osiecki R, Rubio TBG, Coelho RL, Novack LF, Conde JHS,
Alves CG, et al. The Total Quality Recovery Scale (TQR) as a proxy for determining athletes’ recovery stat after a professional soccer match. J Exerc Physiol. 2015;18(3):27–32.
19. Arcos AL, Yanci J, Mendiguchia J, Gorostiaga EM. Rating of
Muscular and Respiratory Perceived Exertion in Professional Soccer Players. J Strength Cond Res. 2014 Nov;28(11):3280–8.
*Corresponding author
Danilo L. Alves.
Affiliation: Physical Performance Research Group (CEPEFIS), School of Physi
-cal Education and Sport, University of Paraná (UFPR), Brazil. Address: Centro de Estudos da Performance Física (CEPEFIS), Departamento de Educação Física (DEF), Universidade Federal do Paraná (UFPR). Rua Coração de Maria, 92, Jardim Botânico, Paraná, Brasil.
Email: [email protected]
Manuscript received on September 29, 2017
Manuscript accepted on December 18, 2017