Sleep duration, lifestyles and chronic diseases: a
cross-sectional population-based study
Corresponding author: Cátia Reis.
E-mail: reis.catia@gmail.com Received: July 23, 2018; Accepted: September 27, 2018.
DOI: 10.5935/1984-0063.20180036
ABSTRACT
Background: Adequate sleep is essential for health. Both, short and long sleep durations are asso-ciated to worse quality of life and poor health outcomes. Portugal represents a specific population model, since according to European statistics it has high rates of chronic diseases like depression, hypertension, diabetes and stroke; and low quality of life as well as low index of physical activity, while in parallel it has some other good health indicators such as: low age-standardized mortality for both genders, nutrition in terms of energy and fruit consumption, smoking and alcohol, obesity and overweight prevalence. The aim of this study was to characterize health and chronic diseases, lifestyles and quality of life in subjects with short and long sleep duration. Methods: A population-based cross-sectional evaluation of the third wave of follow-up of the EpiDoC Cohort was carried between 2015-2016. A sample of 5,436 adults ≥18 years, representative of the national population, self-reported their daily total sleep time. Associations between short sleep duration (SSD ≤5h), long sleep duration (LSD≥9h) and independent variables were determined. Results: The prevalence for SSD was high (20.7%) and the LSD (5.9%) was low. Being older, with lower education, retired and unemployed were associated to SSD and LSD (p<0.01). Being obese was associated to SSD as well as hypertension, gastrointestinal disease and hypercholesterolemia (p<0.01). SSD and LSD, were associated with diabetes (p<0.01 and p=0.03) and depression (p<0.01 and p=0.02) respectively. Car-diovascular disease (p<0.01) was associated to LSD. Multimorbidity (p<0.01) was associated to SSD. Worse quality of life and bad physical function were associated to SSD and LSD, as well as being hospitalized in the previous 12 months (p<0.01). Conclusions: Socio-demographic, physical activ-ity and chronic diseases were associated to reduction and extension of sleep duration. There was no association between rheumatic diseases and cancer with sleep duration, as found in other studies. This study emphasizes the burden of self-reported SSD for Portugal, its consequences to health and the need to increase sleep awareness campaigns enhancing the importance of sleep in health. Furthermore, it emphasizes that chronic diseases risks are dependent on multiple parameters which varying in different countries or regions, imply the need of regional studies and interventions. Keywords: Sleep; Life Style; Quality of Life; Cross-Sectional Studies; Chronic Disease; Portugal.
Cátia Reis1,2
Sara Dias3,6,7
Ana Maria Rodrigues3,4,5,6
Rute Dinis Sousa3,6
Maria João Gregório3,8,9
Jaime Branco3,4,10
Helena Canhão3,4,6
Teresa Paiva2
1 Faculdade de Medicina, Universidade
de Lisboa, Lisboa, Portugal, Instituto de Saúde Ambiental (ISAMB) - Lisboa - Lisboa - Portugal.
2 CENC - Sleep Medicine Center, Sleep
and circadian rhythms - Lisboa - Lisboa - Portugal.
3 EpiDoC Unit, NOVA Medical School,
Universidade Nova de Lisboa (NMS/ UNL), Centro de Estudos de Doenças Crónicas (CEDOC) - Lisboa - Lisboa - Portugal.
4 Sociedade Portuguesa de Reumatologia
- Lisboa - Lisboa - Portugal.
5 Instituto de Medicina Molecular,
Rheumatology Research Unit - Lisboa - Lisboa - Portugal.
6 EpiSaúde, Associação Científica -
Évora - Évora - Portugal.
7 Escola Superior de Saúde do Instituto
Politécnico de Leiria, CiTechCare, Center for innovative care and health technology - Leiria - Leiria - Portugal.
8 Direção-Geral da Saúde, Programa
Nacional para a Promoção da Alimentação Saudável - Lisboa - Lisboa - Portugal.
9 Universidade do Porto, Faculdade de
Ciências da Nutrição e Alimentação - Porto - Porto - Portugal.
10 Centro Hospitalar Lisboa Ocidental
(CHLO- E.P.E.), Serviço de
Reumatologia do Hospital Egas Moniz - Lisboa - Lisboa - Portugal.
Reis, et al.
INTRODUCTION
Sleep is an active process providing daily restoration due to production of the fundamental anabolic hormones, involved in cellular growth and regeneration such as: growth hormone, testosterone, prolactin, etc.1. Sleep represents an essential
ele-ment for health and well-being, including cognitive perfor-mance, physiological processes, emotion regulation, physical development, and quality of life2.
Optimal sleep duration is a question often posed to sleep specialists, although it varies significantly between individuals, age, gender2, and world region3. The value established for short
sleep duration in adults has been sometimes controversial, but
a National study in the United States of America (USA)4 and
other one in Brazil5 point out to ≤6 hours, or by the recent
values established by the National Sleep Foundation ≤5 hours2.
The value established for long sleep is much more consensual, ≥9 hours2,6. Insufficient sleep is well recognized and declared as
a “public health problem” by the Center of Disease and Control in the United States, and has high economic impact on a coun-try’s economy7. It has been demonstrated unequivocally that
du-ration, timing, and quality of sleep critically affect physical and mental health, performance and safety8.
Short and long sleep duration are positively associated with chronic diseases like obesity, type 2 diabetes, hypertension, and cardiovascular disease among adults6,9 Several studies
sug-gest that short sleep duration is associated with poor general health10,11. This association is less evident for the relationship
between longer sleep duration and adverse health status: only a few studies associate poorer general health or increased risk/ presence of disease with ≥9 hours of sleep12. Evidence
be-tween association to long sleep and poor health was only clear for mortality risk, showing a U-shaped relationship12. In a
re-cent longitudinal study from a Swedish cohort this U-shaped relationship was also observed with mortality and age: among younger individuals (≤65 years) there was an increased mortality rate and a subsequent decrease in life expectancy. In older indi-viduals (≥65 years) this association was not detected13.
Culture, socioeconomic status and environment have an important influence on sleep duration. In a large twin study, authors determined the relative importance of environmental contributions associated to sleep duration and body mass index (BMI), accounting for genetics and shared environment. They support the environmental hypothesis that voluntary changes to usual sleep duration influence BMI independently of familial factors14
Eurostat data indicate that Portugal (PT) is the EU-28 country with higher rates of chronic depression and diabetes, 2nd rank in reported prescribed medicines, and in 7th rank for
hy-pertension15; but the relationship to these high prevalent chronic
conditions, consumptions and sleep, were not yet evaluated. There are two possible conditions for having short sleep duration: insomnia or sleep deprivation. Since the prevalence for insomnia in PT is approximately the same as in other coun-tries16,17 the other option might be sleep deprivation.
The aim of this population-based study was to charac-terize health and chronic diseases, lifestyles and quality of life in subjects with disturbances in short and long sleep duration.
METHODS Study population
This study is a cross-sectional evaluation of the third wave of follow-up of the EpiDoC Cohort (i.e., the EpiDoC3 study). EpiDoc3 participants who answer the “hours of sleep per day” question, were included in the current analysis. Epi-DoC cohort was designed to study health determinants and out-comes, chronic non-communicable diseases and their impact in health resources consumption. The EpiDoC cohort enrolled 10,661 adults living in PT (mainland and the archipelagos of Azores and Madeira). EpiDoC sample size calculation was per-formed to capture health related conditions whose prevalence
were of 0.5% as described elsewhere18,19. The study included
non-institutionalized adults (≥18 years old) living in private homes in the Portuguese mainland and archipelagos (Madeira and Azores). The study sample was stratified by administra-tive territorial units [(NUTSII) (Norte, Centro, Lisboa & Vale do Tejo, Alentejo, Algarve, Açores archipelago (Azores) and Madeira archipelago (Madeira)], and the size of the popula-tion within each locality (<2,000; 2,000-9,999; 10,000-19,999; 20,000-99,999; and ≥100,000 inhabitants, respectively). Detailed
methodology has been published18. EpiDoC3 study included
5,653 adult participants (Figure 1), of whom 5,436 reported their daily total sleep time. Data collection was performed from September 2015 to July 2016 by a trained research assistant team who randomly called all individuals by telephone.
EpiDoC cohort measurements
Sociodemographic and socioeconomic characteristics
Information regarding sociodemographic factors (sex, age, ethnicity, years of education, marital status, household composition, Nomenclature of Territorial Units for Statistics [NUTS]II region), as well as socioeconomic variables (employ-ment status), were collected in the EpiDoC1 study. During the EpiDoC3 interview, subjects were asked whether any of these characteristics had changed. The variable age was also catego-rized as <65 years and ≥65 years of age, since there are impor-tant changes in sleep duration and architecture during the life span and after retirement2,13.
Lifestyle characteristics
The daily total sleep time was assessed by the ques-tion “On average, how many hours do you sleep per day?” and the
sleep categories were established as short sleep duration (SSD) (≤5h), normal sleep duration (NSD) (>5h and <9h) and long sleep duration (LSD) (≥9h), according to the National Sleep Foundation2.
Self-reported height and weight were collected. Based on these data, body mass index (BMI; weight/height2 in kg/m2)
Figure 1. Flowchart of the study.
Organization (WHO) classification system20 EpiDoC3 study
included several questions concerning lifestyle habits, such as frequency of alcohol intake (never, daily, occasionally), smok-ing habits (current smoker, past smoker and never smoked), physical activity and dietary habits. Physical activity level was classified according to self-reported weekly frequency of physi-cal activity and categorized by active or inactive. For the time watching TV a categorical variable was used (<5 hours/day or ≥5 hours/day). For the dietary intake, a proxy of healthy diet was assessed by calculating the adherence to the Mediterranean
diet through the PREDIMED score21.
Health characteristics and healthcare consumption and costs
In EpiDoC3 study, individuals were asked whether they had been previously diagnosed with the following chronic dis-eases: hypercholesterolemia, hypertension, rheumatic disease, allergy, gastrointestinal disease, cardiac disease, diabetes, pul-monary disease, cancer, or neurologic disease, depression and
anxiety. Multimorbidity was defined as the coexistence of two or more of these self-reported chronic diseases22. Health-related
quality of life was assessed using the European Quality of Life questionnaire with five dimensions and three levels (EQ-5D-3L)23,24, for which a higher score corresponds to a higher quality
of life. Physical function was evaluated using the Health Assess-ment Questionnaire (HAQ; ranging from 0 to 3, with higher scores representing worse functional ability)25.
We used Portuguese validated versions of the assess-ment scales. Number of hospitalizations were also assessed.
Statistical analysis
To verify the representativeness of the sample according to the Portuguese population (mainland and islands), we first compared the participants and non-participants of EpiDoC3 study with respect to their sociodemographic, socioeconomic, and health status characteristics. Based on this comparison, we adjusted the weights according to stratification by NUT-SII region, sex, and age group. Extrapolation weights were
Reis, et al.
computed and used in the subsequent statistical analysis. These were obtained by calibrating the extrapolation weights originally designed for the EpiDoC1 study sample.
Baseline characteristics of the study cohort were de-scribed according to the three categories of reported sleep du-ration: SSD (≤5h), NSD (>5h and <9h) and LSD (≥9h).
Absolute frequencies and weighted proportions were used to summarize categorical variables. Continuous variables were described by weighted mean values and standard devia-tions. Differences in baseline variables across categories of re-ported sleep duration were statistically assessed using the Stu-dent t-test for continuous variables and the Chi-square test for categorical variables. For the post-hoc comparisons between groups the Sheffé’s method was used. Logistic regression was used to computed odds ratio (OR) and respective 95% confi-dence intervals (95% CI) to quantify the association between ex-planatory variable and sleep duration SSD and LSD. Crude and gender, age (<65 years vs ≥65 years), NUTSII and educational
level adjusted OR were estimated. All analyses were weighted and performed using STATA IC v.12 (StataCorp. 2011. Stata Statistical Software: Release 12. College Station, TX: StataCorp LP).
Ethical issues and personal protection
Details of ethical issues of the EpiDoC1 (EpiReumaPt) study were described elsewhere18,19,26. The study was reviewed
and approved by the National Committee for Data Protection (Comissão Nacional de Proteção de Dados) and by NOVA Medical
School Ethics Committee. Informed consent was obtained from all individual participants included in all phases of the study.
EpiDoC3 was also approved by the National Commit-tee for Data Protection (in accordance with the Portuguese law
number 67/98, October 26th, regarding protection of personal
data) and by the same Ethics Committee as EpiDoC1. The study was conducted in accordance with the applicable laws and regulations including, but not limited to, the Guidelines for Good Clinical Practice and the ethical principles stated in the Declaration of Helsinki27. Participants’ confidentiality was
safe-guarded by the absence of identifiers in the database (only a unique identification code was used for each participant). The name and contact information for each subject were stored separately from the study data transmitted to the coordinating center (based at the headquarters of the Portuguese Society of Rheumatology). All data were kept anonymously and secured by authorized EpiDoC staff.
RESULTS
In total, 5,436 participants reported their daily total sleep time. Participants’ mean age was 56.7±16.4 years old and 3,473 (52.7%) were females. For the adult Portuguese population, self-reported SSD prevalence was 20.7%, and LSD prevalence was 5.9%. For the Portuguese country distribution, the region with a higher prevalence value of reported SSD was the Algarve (south of PT) (26.5%), while the Atlantic Islands of Azores have the lowest value (16.4%), and the higher prevalence of LSD (10.2%).
Lisbon was the region with a higher prevalence value of normal sleep duration (75.8%). Participants with reported SSD (≤5h) were older (≥65), most frequently women, with lower education
level, widowed and retired, unemployed or in a temporary work.
The same pattern was found for reported LSD (≥9) (Table 1). There is a higher percentage of overweight subjects in the SSD group, as well as people that drink alcohol on a daily basis and the ones that never smoke. The percentage of inac-tive and acinac-tive individuals was similar for both sleep duration groups, except for the LSD with a higher prevalence in the inac-tive group. Subjects that adhere to a Mediterranean diet were the ones with higher percentage of reported normal sleep (78.2%), although a very high percentage of individuals did not have a high adherence to the Mediterranean diet (88.1%) according to the PREDIMED score.
The self-reported non-communicable chronic diseases with a prevalence value above 30% for the reported SSD group were: hypertension (34.6%), diabetes (39.4%), hypercholester-olemia (32.7%), pulmonary disease (31.0%), cardiac disease (33.9%), gastrointestinal disease (33.7%) and neoplasm disease (31.2%). For the reported LSD group, the self-reported non-communicable chronic diseases with higher prevalence’s were: diabetes (9.4%), pulmonary disease (9.3%), cardiac disease (11.8%) and neoplasm disease (9.0%). The pathology with lower prevalence for reported normal sleep duration was diabetes with 51.2%. The percentage of individuals with anxiety was higher in the SSD group (26.1%) and the percentage of individuals with depression and anxiety was the same in the reported LSD group, 5.8%. For the SSD the percentage of individuals with depression was 31.4%.
The percentage of multimorbidity was high in the groups of SSD and LSD with 36.3% and 7.6% respectively although it was only statistically significant associated to SSD, when adjusted to age, gender, educational level and regions. For physical function, the group with SSD presented the low-est physical function (0.61±0.74), comparing to the LSD group. LSD group presented a low physical function when compared to the normal group. The number of hospitalizations in the pre-vious 12 months was higher in the SSD group (28.1%). Asked about medication, 234 (2.8%) individuals reported specifically taking medication for sleep, and 40.3% of those belong to the SSD group.
SSD was weakly associated “to drinking alcohol occasionally”,
never smoke and to have a high adherence to Mediterranean diet (Table 2).
Lifestyle variables weakly associated to reported LSD (≥9 hours/day) were “to drink alcohol daily and occasionally”
(OR=0.56; 95%CI:0.39-0.81); and to watch TV ≥5 hours/day (OR=1.92; 95%CI:1.15-3.21). In the adjusted model, the only lifestyle variable associated to LSD (≥9 hours/day) was daily al-cohol consumption (OR=0.62; 95%CI:0.42-0.90) (Table 2). For the remaining lifestyles studied no association was obtained for sleep duration.
Table 3 displays data on health conditions and health resources consumptions crude and adjusted for age, gender,
Table 1. Baseline characteristics by categories of short (≤5 h/day) and long (≥9h/day) sleep duration, having as reference group the normal sleep duration
(6-8 h/day) for the Portuguese population.
Post-hoc comparisons (Sheffé’s method) Short*Normal Short*Long Normal*Long Characteristic Short sleep duration (≤ 5 h/day) Normal sleep duration (6-8 h/day) Long sleep duration (≥9h/day) p-valuea p-value p-value p-value
N (%) 1337 (20.7) 3693 (73.4) 406 (5.9) Sex, N (%) Male 411 (19.4) 1401 (75.0) 151 (5.7) 0.2514 ___ ___ ___ Female 926 (22.0) 2292 (71.9) 255 (6.1) ___ ___ ___ Age, mean ± (SD) 58.5 (17.2) 46.1 (16.5) 56.3 (22.9) <0.0001 <0.0001 ___ <0.0001 Age groups, N (%) < 65 years 717 (15.8) 2704 (79.7) 199 (4.5) <0.0001 <0.0001 <0.0001 <0.001 ≥ 65 years 620 (36.4) 989 (53.2) 207 (10.4) <0.0001 <0.0001 <0.0001 NUTS II region, N (%) North 404 (20.3) 1080 (73.7) 120 (6.0) 0.1802 ___ ___ ___ Centre 260 (20.9) 688 (72.1) 91 (7.0) ___ ___ ___ Lisbon 244 (20.3) 798 (75.8) 53 (3.9) ___ ___ ___ Alentejo 75 (21.8) 208 (70.7) 28 (7.5) ___ ___ ___ Algarve 57 (26.5) 109 (66.0) 8 (7.5) ___ ___ ___ Azores 130 (16.4) 430 (73.4) 76 (10.2) ___ ___ ___ Madeira 167 (21.5) 380 (74.2) 30 (4.3) ___ ___ ___ BMI, mean ± (SD) 27.0 (4.7) 25.5 (4.2) 26.2 (5.5) <0.0001 <0.0001 ___ <0.0001 Education level, N (%) > 12 years 142 (11.0) 870 (86.7) 30 (2.4) <0.0001 <0.0001 <0.0001 <0.0001 10-12 years 164 (13.9) 801 (80.7) 66 (5.4) <0.0001 <0.001 ___ 5-9 years 263 (20.1) 767 (75.1) 64 (4.8) ___ ___ <0.05 0-4 years 756 (34.7) 1244 (55.7) 239 (9.7) <0.0001 <0.0001 <0.0001 Marital status, N (%) Single 134 (9.6) 713 (85.1) 57 (5.3) <0.0001 <0.0001 <0.001 ___ Married 833 (23.9) 2267 (70.3) 235 (5.7) ___ ___ ___ Divorced 86 (26.9) 266 (66.7) 28 (6.4) ___ ___ ___ Widowed 250 (39.5) 319 (51.0) 72 (9.5) <0.0001 <0.0001 <0.001 Consensual union 34 (15.2) 126 (80.5) 12 (4.3) ___ ___ ___ Employment status, N (%) Employed full-time/ part-time/ domestic 1023 (21.0) 2978 (73.5) 311 (5.6) 0.3085 ___ ___ ___ Retired/unemployed/ temporary work 311 (19.4) 710 (73.2) 95 (7.3) ___ ___ ___ Alcohol intake, N (%) Daily 371 (23.9) 1058 (70.8) 113 (5.3) <0.0001 <0.0001 <0.001 <0.01 Occasionally 389 (16.0) 1487 (79.0) 115 (5.0) ___ ___ ___ Never 573 (23.7) 1142 (68.6) 176 (7.7) <0.0001 <0.001 <0.01 Smoking habits, N (%) Current smoker 157 (14.0) 654 (81.0) 58 (5.0) 0.0003 <0.05 ___ ___ Past smoker 276 (21.5) 764 (72.1) 93 (6.4) ___ ___ ___
Reis, et al. Never 901 (23.0) 2272 (70.9) 255 (6.1) <0.001 <0.01 ___ Physical activity, N (%) Inactive 803 (21.3) 2035 (72.4) 261 (6.4) 0.3879 ___ ___ ___ Active 534 (20.1) 1658 (74.6) 145 (5.3) ___ ___ ___ Time watching TV, N (%) < 5 hours/per day 1170 (20.4) 3366 (74.0) 333 (5.5) 0.0961 ___ ___ ___ ≥ 5 hours/per day 163 (23.6) 318 (66.8) 71 (9.6) ___ ___ ___ Adherence to Mediterranean diet, N (%) High adherence to MD (PREDIMED ≥ 10) 122 (16.4) 439 (78.2) 40 (5.3) 0.0672 ___ ___ ___ Low adherence to MD (PREDIMED ≤ 10) 1215 (21.3) 3254 (72.7) 366 (6.0) ___ ___ ___ Non-communicable chronic diseases (self-reported), N (%)) Hypertension 585 (34.6) 1053 (58.5) 151 (6.9) <0.0001 <0.0001 <0.0001 <0.05 Diabetes 224 (39.4) 354 (51.2) 66 (9.4) <0.0001 <0.0001 <0.001 <0.01 Hypercholesterolemia 565 (32.7) 1054 (60.2) 141 (7.2) <0.0001 <0.0001 <0.001 ___ Pulmonary disease 65 (31.0) 113 (59.7) 20 (9.3) 0.0010 <0.05 <0.05 ___ Cardiac disease 218 (33.9) 359 (54.4) 90 (11.8) <0.0001 <0.001 <0.0001 <0.0001 Gastrointestinal disease 190 (33.7) 287 (58.8) 47 (7.5) <0.0001 <0.0001 <0.001 ___ Neurologic disease 54 (18.3) 129 (74.9) 19 (6.8) 0.7257 ___ ___ ___ Allergy 135 (18.5) 371 (76.7) 28 (4.8) 0.4468 ___ ___ ___ Neoplasm disease 93 (31.2) 181 (59.8) 31 (9.0) 0.0045 <0.05 ___ ___ Rheumatic disease 154 (25.9) 296 (65.8) 43 (8.4) 0.0497 <0.01 <0.05 ___ Depression 141 (31.4) 265 (59.1) 37 (5.8) <0.0001 <0.01 <0.05 ___ Anxiety 79 (26.1) 159 (65.7) 23 (5.8) 0.1338 ___ ___ ___ Multimorbidity, N (%) Yes 532 (36.3) 899 (56.1) 142 (7.6) <0.0001 <0.0001 <0.0001 <0.01 No 698 (16.0) 2585 (79.2) 207 (4.8) <0.0001 <0.001 <0.05 Hospitalized in previous 12 months, N (%) 212 (28.1) 425 (61.9) 70 (10.0) <0.0001 <0.01 <0.05 <0.05
Physical function, mean
+ (SD)
HAQ score (0-3) 0.6 (0.7) 0.3 (0.5) 0.5 (0.7) <0.0001 <0.0001 <0.01 <0.0001
Quality of life, mean +
(SD)
EQ-5D-3L score 0.7 (0.3) 0.8 (0.2) 0.7 (0.3) <0.0001 <0.0001 ___ <0.0001
Drugs for sleep (self- reported) , N (%)
Yes 93 (40.3) 122 (53.1) 19 (6.6) <0.0001 <0.0001 <0.01 ___
No 1244 (20.2) 3571 (74.0) 387 (5.9) ___ ___ ___
aAnova and Pearson Qui2 tests.
NUTSII regions and educational level. To be overweight or obese (OR=1.57; 95%CI:1.24-1.99) was statistically significant associated to reported short sleep duration. Diabetes and de-pression presented higher prevalence values for SSD and LSD presenting an increased risk for both conditions. Hypercholes-terolemia had an increased risk for SSD (OR=1.47; 95%CI:1.16-1.86). Gastrointestinal disease presented also an increased risk
for the same group (OR=1.68; 95%CI:1.19-2.37). Cardiac dis-ease was associated to LSD (OR=2.01; 95%CI:1.45-2.78).
For the remaining chronic diseases studied like rheumatic, neoplastic and pulmonary diseases there was an association to sleep duration only in the univariate analysis, this association was not found for the adjusted analysis. Allergic and neurologic diseases had no association to SSD and LSD in this population (Table 3).
Table 2. Lifestyles factors associated with short and long sleep durations for the Portuguese population.
Crude Multivariable adjusteda
Sleep duration
(≤ 5 h/day vs 6-8h/day) (≥ 9h/day vs 6-8 h/day)Sleep duration (≤ 5 h/day vs 6-8h/day)Sleep duration (≥ 9h/day vs 6-8 h/day)Sleep duration
OR 95 % CI OR 95 % CI OR 95 % CI OR 95 % CI Alcohol intake Daily 0.98 0.73-1.31 0.67 0.48-0.93 0.99 0.75-1.32 0.62 0.42-0.90 Occasionally 0.59 0.45-0.77 0.56 0.39-0.81 0.87 0.67-1.13 0.80 0.56-1.15 Smoking habits Past smoker 0.92 0.70-1.21 1.03 0.75-1.42 0.99 0.74-1.33 1.20 0.81-1.77 Never 0.53 0.39-0.72 0.72 0.46-1.11 0.75 0.53-1.07 1.05 0.65-1.68 Physical activity Active 0.91 0.73-1.15 0.82 0.61-1.10 1.11 0.89-1.39 1.02 0.76-1.37 Time watching TV ≥ 5 hours/per day 1.28 0.77-2.13 1.92 1.15-3.21 0.78 0.52-1.17 1.25 0.80-1.96 Mediterranean diet
High adherence to MD (PREDIMED ≥ 10) 0.71 0.53-0.97 0.83 0.53-1.30 0.79 0.56-1.10 0.85 0.54-1.33
aOdds ratios from logistic regression model adjusted for age, sex, NUTS II regions and educational level.
Table 3. Health and health resources consumption factors associated with short and long sleep durations for the Portuguese population.
Crude Multivariable adjusteda
Sleep duration
(≤ 5 h/day vs. 6-8h/day) (≥ 9h/day vs. 6-8 h/day)Sleep duration (≤ 5 h/day vs. 6-8h/day)Sleep duration (≥ 9h/day vs. 6-8 h/day)Sleep duration
OR 95 % CI OR 95 % CI OR 95 % CI OR 95 % CI
Drugs for sleep (self- reported)
Yes 0.36 0.25-0.52 0.64 0.36-1.16 0.62 0.42-0.91 1.12 0.62-2.03
BMI
Overweight and obese
(≥ 25 kg/m2) 2.01 1.59-2.54 1.29 0.95-1.74 1.57 1.24-1.99 1.00 0.72-1.38
Non-communicable chronic diseases (self-reported)
Hypertension 2.86 2.27-3.60 1.75 1.32-2.33 1.43 1.11-1.83 0.98 0.74-1.31 Diabetes 3.10 2.20-4.36 2.58 1.82-3.66 1.60 1.15-2.24 1.48 1.04-2.10 Hypercholesterolemia 2.53 2.01-3.18 1.77 1.33-2.36 1.47 1.16-1.86 1.11 0.82-1.49 Pulmonary disease 1.88 1.26-2.80 2.00 1.14-3.52 1.13 0.77-1.67 1.22 0.68-2.18 Cardiac disease 2.45 1.74-3.46 3.15 2.27-4.37 1.42 0.99-2.03 2.01 1.45-2.78 Gastrointestinal disease 2.22 1.57-3.15 1.69 1.04-2.74 1.68 1.19-2.37 1.40 0.88-2.24 Neurologic disease 0.86 0.56-1.33 1.14 0.55-2.36 0.75 0.45-1.25 1.04 0.49-2.19 Allergy 0.84 0.59-1.20 0.77 0.43-1.38 1.16 0.84-1.62 0.99 0.53-1.83 Neoplastic disease 1.91 1.17-3.12 1.95 1.22-3.12 1.15 0.71-1.87 1.29 0.80-2.09 Rheumatic disease 1.43 0.95-2.14 1.65 1.07-2.54 1.08 0.75-1.55 1.36 0.88-2.09 Depression 1.98 1.47-2.67 2.16 1.36-3.42 1.56 1.16-2.11 1.77 1.08-2.88 Anxiety 1.43 1.00-2.06 1.60 0.75-3.39 1.29 0.86-1.94 1.39 0.60-3.23 Multimorbidity Yes 3.20 2.51-4.08 2.24 1.67-3.01 1.56 1.20-2.02 1.28 0.94-1.76 Physical function HAQ score 2.84 2.37-3.41 2.32 1.87-2.88 1.75 1.42-2.15 1.58 1.22-2.05 Quality of life EQ-5D-3L score 0.20 0.14-0.28 0.53 0.35-0.79 0.15 0.10-0.23 0.31 0.20-0.50
Hospitalised in previous 12 months 1.71 1.33-2.20 2.23 1.56-3.19 1.36 1.05-1.76 1.83 1.25-2.70
Reis, et al.
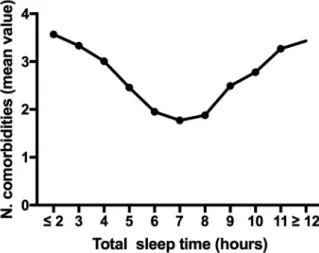
Multimorbidity presented only an increased risk for SSD in the adjusted model (OR=1.56; 95%CI:1.20-2.02). The rela-tionship between sleep duration and mean number of comor-bidities for the Portuguese population is showed in Figure 2.
Physical function and quality of life were reduced for both groups (SSD: OR=1.75; 95%CI:1.42-2.15; LSD: OR=1.58; 95%CI:1.22-2.05) and (SSD: OR=0.15; 95%CI:0.10-0.23; LSD: OR=0.31; 95%CI: 0.20-0.50) respectively, indicating that poor sleep is related to poor quality of life and poor physical functioning. As a proxy for the costs for the National Health Care System we used the number of hospitalizations in the previous twelve months; both groups presented an increased risk of being hospitalized in the pre-vious twelve months to the inquire (SSD: OR=1.36; 95%CI:1.05-1.76; LSD: OR=1.83; 95%CI:1.25-2.70) (Table 3).
Splitting the sample in two groups, bellow and above 65 years, some differences were found. Marital status was (p<0.0001) only associated to sleep duration in the age group
bellow 65 years, with a high percentage of divorced people in the SSD group. Also, a higher percentage of retired/unem-ployed or with a temporary work was associated to SSD in this age group (p=0.0198); and the alcohol intake (p=0.0157) was
also higher for SSD. More statistically significant associations in this age group were found in non-communicable chronic diseas-es: diabetes (p<0.0001), hypercholesterolemia (p<0.0001),
gas-trointestinal disease (p=0.0001), rheumatic diseases (p=0.0191),
depression (p<0.0001) and anxiety (p=0.0477). A higher number
of hospitalizations (p=0.0007) and a higher use of drugs for
sleep was associated to SSD for the age group < 65 years. The only variable associated to sleep duration for the age group ≥ 65 was the adherence to Mediterranean diet, where participants with a lower adherence were more present in the SSD group (Table 4).
For the <65 years group the lifestyle factors with a predictive value for SSD were being married (OR=1.95; 95%CI:1.33-2.86), divorced (OR=1.26; 95%CI:1.26-3.56) and widowed (OR=4.59; 95%CI:2.51-8.37); and for LSD only to consume alcohol daily (OR=0.41; 95%CI:0.24-0.70). For the ≥ 65 years group they were, for SSD, never smoked (OR=0.39;
Figure 2. Relationship between sleep duration and chronic diseases.
95%CI:0.16-0.96) and the high adherence to the Mediterranean diet (OR=0.56; 95%CI:0.36-0.86). For the LSD it was being ac-tive (OR=0.60; 95%CI:0.39-0.92) (Table 5).
For the < 65 years group the health and health resources consumption factors with a predictive value to SSD were the con-sumption of drugs for sleep (OR=0.44; 95%CI:0.24-0.80), to be obese (OR=1.74; 95%CI:1.30-2.32), to be hypertense (OR=1.80; 95%CI:1.36-2.39), to have diabetes (OR=2.14; 95%CI:1.41-3.23), to have hypercholesteremia (OR=1.98; 95%CI:1.52-2.58), to have a cardiac disease (OR=1.75; 95%CI:1.06-2.88), to suffer from a gastrointestinal disease (OR=2.20; 95%CI:1.42-3.41), depression (OR=2.14; 95%CI:1.48-3.08), multimor-bidity (OR=2.28; 95%CI:1.75-2.97), worse physical function (OR=2.46; 95%CI:1.98-3.05), worse quality of life (OR=0.30; 95%CI:0.14-0.38) and the number of hospitalizations in the previous 12 months (OR=1.48; 95%CI:1.04-2.10); for the LSD they were to suffer from a rheumatic disease (OR=1.88; 95%CI:1.06-3.33), depression (OR=2.55; 95%CI:1.16-4.35), worse physical function (OR=1.74; 95%CI:1.21-2.50), worse quality of life (OR=0.30; 95%CI:0.15-0.60) and to be hospital-ized in the previous 12 months (OR=2.19; 95%CI:1.26-3.80).
For the ≥65 years group the health and health resources consumption factors with a predictive value to SSD were to be hypertense (OR=1.57; 95%CI:1.07-2.31), to suffer from cardiac disease (OR=1.54; 95%CI:1.00-2.37), multimorbid-ity (OR=2.06; 95%CI:1.41-3.02) and worse physical function (OR=1.56; 95%CI:1.14-2.12. For the LSD they were to suf-fer from a cardiac disease, worse physical function (OR=1.50; 95%CI:1.06-2.11) and quality of life (OR=0.30; 95%CI:0.17-0.52) (Table 6).
DISCUSSION
The associations to chronic diseases and abnormal total sleep time namely SSD were found for PT. The prevalence for SSD in PT is very high, contrary to LSD. In the USA, data from the National Health Interview Survey, for the same cut-off value (≤5h/day) the prevalence was much lower, 7.8%28, and
in a sample of the Brazilian population, the prevalence value for reported SSD with a cut-off value of ≤6h/day, was 15.8%5.
The prevalence value for LSD (≥9h/day) in PT is low (5.9%) if compared with the USA (8.5%) and even lower than the Brazil-ian cohort (21.9%)5. The metropolitan area of Lisbon, the most
populated urban region of the all country, with a high 24h/7days rhythm, was the region with a higher prevalence value of NSD (75.8%). No explanation for this result was found, as so, future studies evaluating sleep duration comparing urban and rural ar-eas should be performed in PT.
Diabetes and depression presented a significant as-sociation with SSD and LSD with an increased risk for both conditions. This was also found in the USA [9]diabetes, and cardiovascular disease; and although 7-8 h of sleep seems to confer the least health risk, these findings are often based on non-representative data. We hypothesize that short sleep (<7 h in Brazil5, and in a recent revision study6. This is in line with
Table 4. Baseline characteristics by categories of short (≤5 h/day) and long (≥9h/day) sleep duration, having as reference group the normal sleep duration
(6-8 h/day) for age groups (< 65years and ≥65 years).
Age group < 65 years Age group ≥65 years
Characteristic Short sleep duration (≤5 h/day) Normal sleep duration (6-8 h/day) Long sleep duration (≥ 9h/day) p-value
a Short sleep duration
(≤ 5 h/day) Normal sleep dura-tion (6-8 h/day) Long sleep duration (≥ 9h/day) p-value a N (%) 717 (19.8) 2704 (74.7) 199 (5.5) 620 (34.1) 989 (54.5) 207 (11.4) Sex, N (%) Male 501 (17.1) 1653 (78.4) 129 (4.6) 0.2605 425 (36.5) 639 (52.8) 126 (10.7) 0.9130 Female 216 (14.4) 1051 (81.2) 70 (4.4) 195 (36.2) 350 (53.8) 81 (10.0) Age, mean ± (SD) 47.6 (12.2) 40.2 (11.7) 41.8 (14.8) <0.0001 73.6 (6.0) 74.2 (6.8) 76.1 (7.9) 0.0014 NUTS II region N(%) North 225 (15.7) 831 (79.4) 65 (4.9) 0.1755 179 (37.4) 249 (52.7) 55 (9.9) 0.0840 Centre 131 (16.0) 476 (79.4) 35 (4.6) 129 (33.4) 212 (53.2) 56 (13.4) Lisbon 127 (14.1) 583 (83.0) 28 (3.0) 117 (42.0) 215 (50.9) 25 (7.1) Alentejo 40 (20.1) 125 (74.4) 12 (4.7) 35 (23.7) 83 (63.0) 16 (13.3) Algarve 22 (18.7) 68 (72.3) 6 (9.0) 35 (46.9) 41 (49.4) 2 (3.6) Azores 81 (13.6) 338 (78.6) 40 (7.8) 49 (28.0) 92 (52.1) 36 (19.9) Madeira 91 (16.9) 283 (79.9) 13 (3.2) 76 (40.3) 97 (8.5) 17 (8.5) BMI, mean ± (SD) 26.9 (5.1) 25.2 (4.1) 25.5 (5.3) <0.0001 27.1 (3.8) 26.8 (4.3) 27.2 (5.2) 0.0097 Education level, N (%) > 12 years 115 (10.4) 782 (87.5) 23 (2.1) <0.0001 27 (18.8) 88 (75.9) 7 (5.3) <0.0001 10-12 years 136 (13.3) 730 (81.7) 52 (5.1) 28 (24.9) 71 (64.6) 14 (10.5) 5-9 years 197 (19.4) 629 (76.2) 42 (4.4) 66 (24.5) 138 (68.2) 22 (7.4) 0-4 years 266 (25.9) 558 (66.7) 80 (7.4) 490 (40.7) 686 (48.2) 159 (11.2) Marital status, N (%) Single 108 (9.2) 665 (85.7) 46 (5.1) <0.0001 26 (21.2) 48 (66.6) 11 (12.2) 0.5327 Married 460 (19.3) 1643 (76.7) 114 (4.0) 373 (35.3) 624 (54.5) 121 (10.2) Divorced 63 (20.5) 211 (73.7) 20 (5.8) 23 (47.0) 55 (44.7) 8 (8.4) Widowed 55 (41.3) 61 (54.7) 8 (4.0) 195 (39.1) 258 (50.1) 64 (10.8) Consensual union 31 (14.7) 122 (81.3) 11 (4.5) 3 (34.3) 4 (48.6) 1 (17.2) Employment status, N (%) Employed full-time/part-time/ domestic 483 (15.1) 2095 (81.1) 128 (3.9) 0.0198 540 (36.9) 883 (52.9) 183 (10.2) 0.5384 Retired/unemployed/ temporary work 233 (17.9) 607 (75.5) 71 (6.7) 78 (31.2) 103 (56.3) 24 (12.5) Alcohol intake, N (%) Daily 283 (18.1) 755 (75.9) 81 (6.0) 0.0157 290 (37.1) 387 (51.2) 95 (11.7) 0.7278 Occasionally 179 (17.0) 704 (80.0) 40 (3.0) 192 (36.7) 354 (53.7) 73 (9.6) Never 253 (13.7) 1240 (81.9) 78 (4.4) 136 (33.9) 247 (9.6) 37 (9.4) Smoking habits, N (%) Current smoker 443 (16.9) 1565 (78.9) 104 (4.2) 0.3933 458 (38.0) 707 (51.2) 151 (10.9) 0.2133 Past smoker 141 (15.9) 532 (78.9) 49 (5.2) 135 (35.4) 232 (55.2) 44 (9.5) Never 132 (13.4) 605 (82.0) 46 (4.5) 25 (22.0) 49 (9.5) 12 (9.3) Physical activity, N(%) Inactive 413 (16.3) 1442 (79.6) 113 (4.2) 0.6342 390 (35.0) 593 (52.6) 148 (12.4) 0.1156 Active 304 (15.3) 1262 (79.9) 86 (4.9) 230 (38.5) 396 (54.3) 59 (10.4) Time watching TV, N (%) < 5 hours/per day 655 (15.8) 2562 (80.0) 171(4.3) 0.3449 515 (37.4) 804 (52.5) 162 (10.1) 0.5578 ≥ 5 hours/per day 60 (16.0) 139 (76.3) 28 (7.7) 103 (32.5) 179 (55.7) 43 (11.8) Adherence to Mediterranean diet, N (%)
Reis, et al.
highest prevalence of diabetes when compared with European
countries29; in our data the crude odds ratio is 3.10 for SSD
and 2.58 for LSD; these values are lower, but still significant for the multivariable adjusted model. In clinical terms these associa-tions reflect a share of sleep duration in the risk of diabetes, although other factors such as low physical activity also shown in our study, must have significant contributions.
The prevalence of depression in PT is among the high-est values in the WHO European Region (5.7%), since only
Ukraine and Estonia present higher values30 The odds ratio
be-tween depression and SSD is 1.98 and LSD is 2.16 for the crude analysis, with values a bit lower but significant for the multivari-able adjusted model; in our sample the influence of age, gender, region and education in the association between sleep duration and depression is minor when compared with diabetes. How-ever in the sub-sample of older adults from the EpiDoc cohort, the prevalence of depression is higher in the elder (11.8%)31
when compared to WHO data30.
Obesity was a predictor for SSD. These results were in accordance with previous studies6,9,32 in a twin study14 and also in
adolescents33. The mean BMI for Portuguese males and females
was 26.7kg/m2 and 25.7kg/m2 respectively; the prevalence of
obesity was in 2014 19.8% for males and 20.3% for females. In fact these data are a bit lower when compared with the mean
EU data29, and therefore this low obesity prevalence may
ex-plain the low odds ratio values found. For LSD, in the adjusted model, this association was not found, contrary as observed in other studies; LSD was associated with an increased sedentary behavior, inactivity, and obesity6,32. Abdominal fat, besides being
a health risk by itself for cardiometabolic diseases34, the waist
circumference was not measured, although the association to BMI is well established35.
The adherence to Mediterranean diet was analyzed as a proxy of healthy diet. Although being a protective variable to SSD, in the adjusted analysis this association was not found. A previous study resulting from an analysis of the adherence to the Mediterranean diet between 1961 and 2003 had already showed that the adherence to Mediterranean diet has gradually declined in the last years in the Portuguese population36.
In the USA’s, the U-shaped risk was observed for
hy-pertension and cardiovascular disease9. In our study
hyperten-sion had an increased risk only for SSD and cardiovascular
aAnova and Pearson Qui2 tests
High adherence to MD (PREDIMED ≥ 10) 68 (14.0) 327 (82.3) 20 (3.4) 0.4111 54 (25.2) 112 (62.6) 20 (10.4) 0.0372 Low adherence to MD (PREDIMED ≤ 10) 649 (16.1) 2377 (79.3) 179 (4.6) 566 (37.7) 877 (52.1) 187 (10.2) Non-communicable chronic diseases (self-reported), N (%) Hypertension 218 (26.7) 530 (69.1) 50 (4.2) <0.0001 367 (41.7) 523 (48.9) 101 (9.4) 0.0238 Diabetes 75 (32.3) 144 (61.3) 19 (6.4) <0.0001 149 (44.1) 210 (44.6) 47 (11.3) 0.0689 Hypercholesterolemia 245 (26.2) 597 (68.2) 55 (5.6) <0.0001 320 (40.9) 457 (50.0) 86 (9.8) 0.1583 Pulmonary disease 26 (25.0) 65 (70.7) 4 (4.3) 0.0803 39 (38.4) 48 (46.3) 16 (15.3) 0.3096 Cardiac disease 62 (24.0) 155 (69.8) 21 (6.3) 0.0147 156 (40.7) 204 (43.8) 69 (15.6) 0.0097 Gastrointestinal disease 98 (28.7) 164 (66.2) 20 (5.1) 0.0001 92 (42.4) 123 (46.1) 27 (11.5) 0.2634 Neurologic disease 27 (14.5) 98 (79.6) 10 (4.5) 0.7730 27 (30.2) 31 (60.3) 9 (9.6) 0.6007 Allergy 90 (15.9) 310 (80.9) 12 (4.5) 0.6601 45 (35.9) 61 (48.7) 16 (15.3) 0.2834 Neoplasm disease 34 (20.0) 98 (76.4) 7 (3.7) 0.4149 59 (41.9) 83 (44.0) 24 (14.1) 0.2785 Rheumatic disease 89 (18.8) 204 (73.3) 24 (8.0) 0.0191 65 (41.2) 92 (49.6) 19 (9.2) 0.6672 Depression 89 (30.0) 181 (61.6) 20 (4.5) <0.0001 52 (34.6) 84 (53.3) 17 (12.1) 0.7781 Anxiety 51 (25.0) 113 (68.7) 9 (6.4) 0.0477 28 (30.5) 46 (55.0) 14 (14.5) 0.4362 Multimorbidity, N (%) Yes 281 (26.9) 696 (67.9) 65 (5.2) <0.0001 369 (43.3) 534 (47.4) 107 (9.3) 0.0003 No 367 (12.4) 1878 (83.6) 115 (4.1) 175 (28.2) 314 (63.2) 51 (8.6) Hospitalized in previous 12 months N(%) 89 (20.9) 266 (70.1) 26 (8.4) 0.0007 123 (40.1) 159 (47.4) 44 (10.4) 0.1925
Physical function, mean ± (SD)
HAQ score (0-3) 0.4 (0.7) 0.2 (0.4) 0.3 (0.6) <0.0001 0.8 (0.7) 0.6 (0.7) 0.8 (0.7) <0.0001
Quality of life, mean ±
(SD)
EQ-5D-3L score 0.6 (0.3) 0.9 (0.2) 0.8 (0.3) <0.0001 0.6 (0.3) 0.7 (0.3) 0.5 (0.3) <0.0001
Drugs for sleep (self- reported), N(%)
Yes 35 (36.2) 48 (59.4) 4 (4.4) 0.0002 58 (43.8) 74 (47.7) 15 (8.5) 0.2720
No 682 (15.4) 2656 (80.1) 195 (4.5) 562 (35.9) 915 (53.6) 192 (10.5)
Table 5. Lifestyles factors associated with short and long sleep durations for age groups (< 65 and ≥ 65 years).
<65 years ≥65 years
Crude Multivariable adjusteda Crude Multivariable adjusteda
Sleep duration (≤5 h/day vs. 6-8h/day) Sleep duration (≥9h/day vs. 6-8 h/day) Sleep duration (≤5 h/day vs. 6-8h/day) Sleep duration (≥9h/day vs. 6-8 h/day) Sleep duration (≤5 h/day vs. 6-8h/day) Sleep duration (≥9h/day vs. 6-8 h/day) Sleep duration (≤5 h/day vs. 6-8h/day) Sleep duration (≥9h/day vs. 6-8 h/day) OR 95% CI OR 95% CI OR 95% CI OR 95% CI Alcohol intake Daily 0.89 0.65-1.23 0.47 0.29-0.77 0.97 0.69-1.38 0.41 0.24-0.70 0.94 0.60-1.49 0.78 0.50-1.21 0.99 0.61-1.60 0.89 0.53-1.49 Occasionally 0.70 0.51-0.97 0.68 0.43-1.08 0.83 0.61-1.13 0.74 0.48-1.45 0.82 0.56-1.21 0.72 0.42-1.22 1.06 0.70-1.58 0.77 0.44-1.34 Smoking habits Past smoker 0.94 0.69-1.28 1.24 0.79-1.95 0.91 0.69-1.37 1.36 0.81-2.27 0.86 0.54-1.38 0.81 0.52-1.25 0.92 0.54-1.55 0.91 0.52-1.59 Never 0.76 0.55-1.06 1.08 0.65-1.81 0.83 0.57-1.20 1.19 0.70-2.04 0.41 0.20-0.91 0.64 0.25-1.61 0.39 0.16-0.96 0.56 0.19-1.64 Physical activity Active 0.93 0.72-1.21 1.17 0.78-1.72 1.07 0.82-1.39 1.33 0.90-1.96 1.07 0.71-1.61 0.57 0.38-0.85 1.17 0.78-1.73 0.60 0.39-0.92 Time watching TV ≥5 hours/per day 1.06 0.52-2.20 1.89 0.84-4.26 0.87 0.47-1.62 1.63 0.78-3.42 0.82 0.48-1.40 1.10 0.68-1.79 0.74 0.46-1.21 1.06 0.63-1.78 Marital status Married 2.36 1.60-3.51 0.87 0.55-1.35 1.95 1.33-2.86 0.66 0.41-1.05 2.04 0.89-4.67 1.02 0.39-2.69 2.01 0.78-5.22 1.02 0.37-2.85 Divorced 2.60 1.54-4.41 1.32 0.67-2.58 2.12 1.26-3.56 0.91 0.46-1.80 3.31 0.85-12.96 1.02 0.30-3.51 3.52 0.97-12.77 1.21 0.32-4.52 Widowed 7.06 3.89-12.82 1.24 0.42-3.62 4.59 2.51-8.37 0.62 0.21-1.84 2.46 1.06-5.67 1.17 0.43-3.23 2.13 0.80-5.62 1.08 0.37-3.13 Consensual union 1.70 0.91-3.15 0.82 0.38-1.78 1.53 0.82-2.84 0.73 0.34-1.60 2.22 0.31-16.12 1.93 0.16-23.83 3.14 0.54-18.37 2.52 0.22-28.41 Mediterranean diet High adherence to MD (PREDIMED ≥ 10) 0.84 0.56-1.24 0.71 0.39-1.31 0.88 0.57-1.34 0.69 0.36-1.31 0.56 0.36-0.86 1.00 0.51-1.93 0.65 0.43-0.99 1.07 0.56-2.05
aOdds ratios from logistic regression model adjusted for sex, NUTS II regions and educational level.
disease only for LSD. The prevalence of high blood pressure in PT is high (28.1%) in 2014, and it is the 9th highest
preva-lence in Europe29, the highest values include Russian
Federa-tion, other countries from the Eastern Europe and Luxem-bourg. The odds ratio for SSD is high (2.86) but decreases, although remaining significant in the multivariable adjusted model (1.43); these results suggest that sleep reduction is in-cluded in a set of other risk factors for hypertension. The age standardized prevalence for 100,000 inhabitants of cardio-vascular disease in PT in 2015 is 4,765 for females and 5,764 for males, which, within the European framework, are among the lowest values29. This might be a partial explanation for the
absent association with SSD, which has been found by other authors in the USA37 and Netherlands38. In fact this result
de-serves further studies since the prevalence of cardiovascular disease is similar in Netherlands and PT. For the association only to LSD to cardiovascular disease no explanation can be found since like stated by Covassin & Singh39, experimental
evidence corroborating harmful cardiovascular effects of ex-cessive sleep duration is lacking, which contributes to making any causal association between long sleep and cardiovascular disease more elusive. Hypercholesterolemia had an increased risk for SSD in accordance to literature which indicates SSD as a risk factor for metabolic function40,41 PT has a reasonable
prevalence of raised blood cholesterol (16.7), which is much
lower than in most Northern and Eastern EU countries29 and
USA42. The Mediterranean diet might be an explanation in
spite of the reduced adherence. Contrary to a previous study5
rheumatic diseases were not associated with sleep duration. Most of the rheumatic diseases are inflammatory diseases so,
an association namely to SSD was expected43. The same
hap-pened to cancer, in this population an association with sleep duration was not found. The association to sleep duration and cancer, namely for LSD, was described in studies for cancer related mortality44,45. In this study, there was an increased risk
for neoplasm disorders in SSD and LSD, although, adjusting for age, gender, regions and educational level this association was not found; the low prevalence of LSD may be a possible explanation, as well as the low rates of cancer for PT
compar-ing to other countries15. The reduced immunological defenses
in individuals with short or increased sleep durations was dem-onstrated by Patel et al.46 in a study where pneumonia risk was
higher for these individuals; in our study pulmonary disease, had an association in the univariate analysis, which was missed in the adjusted data. An association with SSD was however expected since the chronic obstructive pulmonary disease is usually one of the most prevalent pulmonary diseases and is
associated to SSD47,48.Even separating by age groups below
and above 65 years this association was still not found. Anxiety is usually associated to insomnia; nevertheless in this population the association to SSD was not found, only in the group <65 years this association was present49.
Reis, et al.
Table 6. Health and health resources consumption factors associated with short and long sleep durations for age groups (<65 and ≥65 years).
<65 years ≥65 years
Crude Multivariable adjusteda Crude Multivariable adjusteda
Sleep duration (≤5 h/day vs. 6-8h/day) Sleep duration (≥9h/day vs. 6-8 h/day) Sleep duration (≤5 h/day vs. 6-8h/day) Sleep duration (≥9h/day vs. 6-8 h/day) Sleep duration (≤5 h/day vs. 6-8h/day) Sleep duration ≥9h/day vs. 6-8 h/day) Sleep duration (≤5 h/day vs. 6-8h/day) Sleep duration (≥9h/day vs 6-8 h/day) OR 95 % CI OR 95 % CI OR 95 % CI OR 95 % CI
Drugs for sleep (self- reported) Yes 0.32 0.17-0.60 0.76 0.26-2.23 0.44 0.24-0.80 0.92 0.32-2.65 0.73 0.46-1.14 1.10 0.55-2.22 0.78 0.50-1.23 1.21 0.60-2.44 BMI Overweight and obese (≥25 kg/m2) 1.96 1.49-2.59 1.36 0.76-1.69 1.74 1.30-2.32 0.99 0.66-1.49 1.33 0.86-2.07 1.02 0.63-1.64 1.26 0.83-1.90 0.99 0.60-1.64 Non-communicable chronic diseases (self-reported) Hypertension 2.27 1.73-3.00 1.11 0.72-1.69 1.80 1.36-2.39 0.90 0.59-1.37 1.63 1.08-2.44 1.07 0.71-1.61 1.57 1.07-2.31 1.10 0.72-1.69 Diabetes 2.83 2.91-4.20 1.96 1.07-3.58 2.14 1.41-3.23 1.54 0.85-2.78 1.63 0.99-2.66 1.47 0.94-2.28 1.52 0.99-2.32 1.44 0.92-2.24 Hypercholesterolemia 2.34 1.80-3.04 1.61 1.07-2.44 1.98 1.52-2.58 1.41 0.95-2.10 1.38 0.92-2.06 0.98 0.65-1.47 1.37 0.95-1.99 0.92 0.60-1.40 Pulmonary disease 1.81 1.05-3.13 1.11 0.38-3.25 1.36 0.80-2.29 0.86 0.29-2.54 1.22 0.69-2.17 1.76 0.89-3.50 1.26 0.70-2.27 1.56 0.73-3.31 Cardiac disease 1.81 1.11-2.94 1.66 0.92-1.99 1.75 1.06-2.88 1.63 0.94-2.83 1.49 0.95-2.35 2.32 1.56-3.46 1.54 1.00-2.37 2.18 1.43-3.30 Gastrointestinal disease 2.38 1.52-3.70 1.44 0.73-2.83 2.20 1.42-3.41 1.55 0.80-3.02 1.43 0.89-2.29 1.35 0.73-2.50 1.59 0.99-2.55 1.43 0.75-2.72 Neurologic disease 0.91 0.51-1.65 1.35 0.50-3.63 0.86 0.47-1.56 1.30 0.52-3.27 0.73 0.37-1.43 0.82 0.32-2.12 0.65 0.31-1.40 0.74 0.28-1.98 Allergy 1.00 0.66-1.50 0.68 0.29-1.60 1.10 0.73-1.67 0.77 0.30-1.96 1.08 0.66-1.79 1.71 0.87-3.35 1.11 0.67-1.84 1.60 0.78-3.25 Neoplastic disease 1.34 0.82-2.19 0.85 0.34-2.14 1.13 0.68-1.89 0.76 0.30-1.91 1.44 0.72-2.90 1.77 0.99-3.14 1.49 0.75-2.97 1.69 0.90-3.17 Rheumatic disease 1.31 0.91-1.90 2.05 1.17-3.61 1.15 0.80-1.65 1.88 1.06-3.33 1.25 0.61-2.50 0.95 0.51-1.77 1.18 0.65-2.14 0.88 0.47-1.64 Depression 2.67 1.85-3.86 2.62 1.40-4.90 2.14 1.48-3.08 2.25 1.16-4.35 0.94 0.58-1.54 1.22 0.63-2.36 1.03 0.64-1.66 1.34 0.68-2.64 Anxiety 1.91 1.24-2.94 1.71 0.57-5.14 1.70 1.09-2.66 1.58 0.49-5.10 0.80 0.44-1.45 1.42 0.61-3.27 0.75 0.41-1.37 1.31 0.54-3.19 Multimorbidity Yes 2.68 2.06-4.47 1.58 1.02-2.45 2.28 1.75-2.97 1.42 0.88-2.29 2.05 1.40-3.00 1.44 0.88-2.35 2.06 1.41-3.02 1.39 0.83-2.34 Physical function HAQ score 2.97 2.43-3.64 2.12 1.50-3.00 2.46 1.98-3.05 1.74 1.21-2.50 1.63 1.21-2.21 1.56 1.16-2.10 1.56 1.14-2.12 1.50 1.06-2.11 Quality of life EQ-5D-3L score 0.17 0.11-0.26 0.24 0.12-0.47 0.23 0.14-0.38 0.30 0.15-0.60 0.70 0.40-1.23 0.26 0.16-0.43 0.77 0.44-1.33 0.30 0.17-0.52 Hospitalised in previous 12 months 1.56 1.11-2.20 2.34 1.36-4.04 1.48 1.04-2.10 2.19 1.26-3.80 1.29 0.89-1.89 1.45 0.93-2.27 1.41 0.98-2.03 1.49 0.94-2.35
aOdds ratios from logistic regression model adjusted for sex, NUTS II regions and educational level.
An increased risk of multimorbidity for people report-ing SSD was also found in our study like in a Brazilian cohort, where it was stated that people suffering from chronic diseases have a greater chance of exhibiting a SSD pattern, and that such individuals may have a tendency towards an accumulation of sleep problems, generating a deficiency in the normal sleep
pat-tern5. In Figure 2 it was possible to observe the U shape for
the relationship between sleep duration and number of comor-bidities. Like in other study where 7h of sleep presented a lower mortality risk13 also in our study 7h of sleep presented the lower
number of comorbidities, increasing with higher or lower sleep time.
Poor quality of life and poor physical functioning pre-sented an increased risk for both conditions SSD and LSD. This was also well demonstrated in a representative sample from the
USA population50. Worse quality of life and health complaints
were also reported for sleep deprivation in Portuguese adoles-cents33.
The number of hospitalizations represents costs to the National Health Care System and in this study almost 30% of the total sample, had abnormal sleep (SSD or LSD) and report-ed to be hospitalizreport-ed in the previous 12 months.
A recent study in the UK presented the economics costs of insufficient sleep across five different OECD countries: up to $680 billion are lost each year across these countries due to insufficient sleep. Insufficient sleep increases mortality risk, and the amounts of working time lost due to absenteeism or presen-teeism7. All the countries evaluated in this study presented lower
prevalence values for SSD than PT, demonstrating that this might be a very important issue for the Portuguese economy.
One of the major strengths of our study is its large sample size and representativeness with mainland and islands. The other is the fact that in the EpiDoc1 participants had a complete clinical examination performed by a physician and besides EpiDoc3 being a telephonic interview, the registries to confirm chronic diseases were consulted. Our study had also some limitations: since this is a cross-sectional study it was not possible to establish the temporal nature of the association between the tested variables and self-reported sleep duration; daily sleep duration was measured subjectively by self-report, an objective measure like actigraphy would be of great value, giving the possibility of register workdays and off-days; ask-ing for workdays and off-days separately would be somethask-ing
very important since a recent study51 showed that when asking
about total sleep time duration, the answer reflects only work-days times. Sleep timing and sleep quality were also variables not considered in this study and are important factors when study-ing sleep. The influence of menopause was not evaluated in this study and there are clear evidences that menopause by itself influences objective sleep patterns52.
Like in the majority of questionnaires there were some questions that the volunteers did not know or refused to answer, resulting in some missing values. However, it was not possible to eliminate those participants because the representativeness for the Portugal could be compromised.
This study screens the self-reported daily sleep duration for the Portuguese population and shows the very high preva-lence of self-reported SSD in the population. Also, the increased risk for chronic diseases and the high costs for the Portuguese National Health Care System were well demonstrated, with the association between SSD and LSD with chronic diseases and with a higher number of hospitalizations. Although some of the chronic diseases that are commonly associated to SSD and LSD like rheumatic diseases and cancer were not significantly associ-ated in this population. Looking closer to the population bellow 65 years of age some significant differences were found. Being unemployed before retirement is associated to SSD as well as being divorced and widowed, these are stress factors that can steal sleep. For some chronic diseases the association to SSD or LSD is only present in individuals bellow 65 years of age. The significant association to sleep duration and increased mortal-ity risk only for this age group and not in older individuals was
shown in a Swedish cohort13, the same relationship might be
present in our sample. In a future follow up of this cohort, this relationship should be tested for Portugal.
Future studies are needed evaluating not only reported daily total sleep time, but also the time of the day that people sleep, preferably with objective quantitative measures. Studies on interventions aimed at sleep duration should be conducted to investigate whether adverse health risks decrease in different community settings.
This study emphasizes the burden of self-reported SSD for PT, its consequences to health and the need to increase sleep aware-ness campaigns enhancing the importance of sleep in health.
Furthermore, it emphasizes that chronic diseases risks are dependent on multiple parameters which varying in different countries or regions, imply the need of regional studies taking into account the local specificities.
REFERENCES
1. Leproult R, Van Cauter E. Role of sleep and sleep loss in hormone re-lease. In: Loche S, Cappa M, Ghizzoni L, Maghnie M, Savage MO, eds. Pediatric Neuroendocrinology. Basel: Karger: 2011. p. 11-21. DOI: 10.1159/000262524
2. Hirshkowitz M, Whiton K, Albert SM, Alessi C, Bruni O, DonCarlos L, et al. National Sleep Foundation’s updated sleep duration recommenda-tions: Final report. Sleep Health. 2015;1(14):233-43. DOI: 10.1016/j. sleh.2015.10.004
3. Gradisar M, Gardner G, Dohnt H. Recent worldwide sleep patterns and problems during adolescence: a review and meta-analysis of age, region, and sleep. Sleep Med. 2011;12(2):110-8. DOI: 10.1016/j.sleep.2010.11.008 4. Shankar A, Charumathi S, Kalidindi S. Sleep duration and self-rated health:
the national health interview survey 2008. Sleep. 2011;34(9):1173-7. DOI: 10.5665/SLEEP.1232
5. Lima MG, Bergamo Francisco PMS, de Azevedo Barros MB. Sleep duration pattern and chronic diseases in Brazilian adults (ISACAMP, 2008/09). Sleep Med. 2012;13(2):139-44. DOI: 10.1016/j.sleep.2011.07.011 6. Tan X, Chapman CD, Cedernaes J, Benedict C. Association between long
sleep duration and increased risk of obesity and type 2 diabetes: A re-view of possible mechanisms. Sleep Med Rev. 2018;40:127-34. DOI: 10.1016/j.smrv.2017.11.001
7. Hafner M, Stepanek M, Taylor J, Troxel WM, Stolk CV. Why sleep matters – the economic costs of insufficient sleep - A cross-country comparative analysis. Santa Monica: Rand; 2016. DOI: 10.7249/RR1791
8. Czeisler CA. Duration, timing and quality of sleep are each vital for health, performance and safety. Sleep Health. 2015;1(1):5-8. DOI: 10.1016/j. sleh.2014.12.008
9. Buxton OM, Marcelli E. Short and long sleep are positively associated with obesity, diabetes, hypertension, and cardiovascular disease among adults in the United States. Soc Sci Med. 2010;71(5):1027-36. DOI: 10.1016/j. socscimed.2010.05.041
10. Silva-Costa A, Griep RH, Rotenberg L. Associations of a Short Sleep Duration, Insufficient Sleep, and Insomnia with Self-Rated Health among Nurses. PLoS One. 2015;10(5):e0126844. DOI: 10.1371/journal. pone.0126844
11. Itani O, Jike M, Watanabe N, Kaneita Y. Short sleep duration and health outcomes: a systematic review, meta-analysis and meta-regression. Sleep Med. 2016;32:246-56. DOI: 10.1016/j.sleep.2016.08.006
12. Watson NF, Badr MS, Belenky G, Bliwise DL, Buxton OM, Buysse D, et al. Recommended Amount of Sleep for a Healthy Adult: A Joint Con-sensus Statement of the American Academy of Sleep Medicine and Sleep Research Society. Sleep. 2015;38(6):843-4. DOI: 10.5664/jcsm.4758 13. Åkerstedt T, Ghilotti F, Grotta A, Bellavia A, Lagerros YT, Bellocco R.
Sleep duration, mortality and the influence of age. Eur J Epidemiol. 2017;32(10):881-91. DOI: 10.1007/s10654-017-0297-0
14. Watson NF, Buchwald D, Vitiello MV, Noonan C, Goldberg J. A twin study of sleep duration and body mass index. J Clin Sleep Med. 2010;6(1):11-7. 15. EUROSTAT. European Regional statistics: Reference guide.
Luxem-bourg: EUROSTAT; 2004.
16. Gonçalves M, Paiva T, Maltês J, Ramos E. Epidemiology of insom-nia in Portugal. J Sleep Res. 2010;19:S254:74. DOI: 10.1111/j.1365-2869.2008.00690.x
17. Sateia M. International classification of sleep disorders-third edition: highlights and modifications. Chest. 2014;146(5):1387-94. DOI: 10.1378/ chest.14-0970
18. Rodrigues AM, Gouveia N, da Costa LP, Eusébio M, Ramiro S, Machado P, et al. EpiReumaPt- the study of rheumatic and musculoskeletal dis-eases in Portugal: a detailed view of the methodology. Acta Reumatol Port. 2015;40(2):110-24.
19. Branco JC, Rodrigues AM, Gouveia N, Eusébio M, Ramiro S, Macha-do PM, et al. Prevalence of rheumatic and musculoskeletal diseases and their impact on health-related quality of life, physical function and mental health in Portugal: results from EpiReumaPt- a national health survey. RMD Open. 2016;2(1):e000166. DOI: 10.1136/rmdo-pen-2015-000166
20. World Health Organization - WHO. Physical status: the use and interpre-tation of anthropometry. Report of a WHO Expert Committee. WHO Technical Report Series No. 854. Geneva: WHO; 1995. 452 p.
Reis, et al. 21. Martínez-González MA, Salas-Salvadó J, Estruch R, Corella D, Fitó M,
Ros E; PREDIMED INVESTIGATORS. Benefits of the Mediterra-nean Diet: Insights From the PREDIMED Study. Prog Cardiovasc Dis. 2015;58(1):50-60. DOI: 10.1016/j.pcad.2015.04.003
22. Diederichs C, Berger K, Bartels DB. The measurement of multiple chronic diseases--a systematic review on existing multimorbidity indices. J Gerontol A Biol Sci Med Sci. 2011;66(3):301-11. DOI: 10.1093/gerona/glq208 23. Ferreira LN, Ferreira PL, Pereira LN, Oppe M. EQ-5D Portuguese
popu-lation norms. Qual Life Res. 2014;23(2):425-30. DOI: 10.1007/s11136-013-0488-4
24. Ferreira LN, Ferreira PL, Pereira LN, Oppe M. The valuation of the EQ-5D in Portugal. Qual Life Res. 2014;23(2):413-23. DOI: 10.1007/ s11136-013-0448-z
25. Fries JF, Spitz P, Kraines RG, Holman HR. Measurement of patient out-come in arthritis. Arthritis Rheum. 1980;23(2):137-45. DOI: 10.1002/ art.1780230202
26. Gouveia N, Rodrigues AM, Ramiro S, Machado P, da Costa LP, Mourão AF, et al. EpiReumaPt: how to perform a national population based study - a practical guide. Acta Reumatol Port. 2015;40(2):128-36.
27. World Medical Association. World Medical Association Declaration of Helsinki: ethical principles for medical research involving human sub-jects. JAMA. 2013;310(20):2191-4. DOI: 10.1001/jama.2013.281053 28. Krueger PM, Friedman EM. Sleep duration in the united states: a
cross-sectional population-based study. Am J Epidemiol. 2009;169(9):1052-63. DOI: 10.1093/aje/kwp023
29. Wilkins E, Wilson L, Wickramasinghe K, Bhatnagar P, Rayner M, Luen-go-Fernandez R, et al. European Cardiovascular Disease Statistics 2017. Brussels: European Heart Network; 2017.
30. World Health Organization - WHO. Depression and other common mental disorders: global health estimates. Geneva: World Health Organization; 2017. 31. de Sousa RD, Rodrigues AM, Gregório MJ, Branco JDC, Gouveia MJ,
Canhão H, et al. Anxiety and Depression in the Portuguese Older Adults: Prevalence and Associated Factors. Front Med (Lausanne). 2017;4:196. DOI: 10.3389/fmed.2017.00196
32. Xiao Q, Keadle SK, Hollenbeck AR, Matthews CE. Sleep duration and total and cause-specific mortality in a large US cohort: Interrelationships with physical activity, sedentary behavior, and body mass index. Am J Epidemiol. 2014;180(10):997-1006. DOI: 10.1093/aje/kwu222 33. Paiva T, Gaspar T, Matos MG. Sleep deprivation in adolescents:
correla-tions with health complaints and health-related quality of life. Sleep Med. 2015;16(4):521-7. DOI: 10.1016/j.sleep.2014.10.010
34. Klein S, Allison DB, Heymsfield SB, Kelley DE, Leibel RL, Nonas C, et al.; Association for Weight Management and Obesity Prevention; NAASO; Obesity Society; American Society for Nutrition; American Di-abetes Association. Waist circumference and cardiometabolic risk: a con-sensus statement from shaping America’s health: Association for Weight Management and Obesity Prevention; NAASO, the Obesity Society; the American Society for Nutrition; and the American Diabetes Association. Diabetes Care. 2007;30(6):1647-52. DOI: 10.2337/dc07-9921
35. Janssen I, Heymsfield SB, Allison DB, Kotler DP, Ross R. Body Mass Index and waist circumference independently ontribute to the prediction of nonabdominal, abdominal subcutaneous and visceral fat. Am J Clin Nutr. 2002;75(4):683-8. DOI: 10.1093/ajcn/75.4.683
36. Cruz GM. Adherence to the mediterranian dietary pattern and to ad-herence to the World Health Organization dietary recommendations in Portugal: 1961-2003 2009.
37. Sabanayagam C, Shankar A. sleep duration and cardiovascular dis-ease: results from the national health interview survey. Sleep Med. 2010;33(8):1037-42. DOI: 10.1093/sleep/33.8.1037
38. Hoevenaar-Blom MP, Spijkerman AM, Kromhout D, van den Berg JF, Verschuren WM. Sleep duration and sleep quality in relation to 12-year cardiovascular disease incidence: the MORGEN study. Sleep. 2011;34(11):1487-92. DOI: 10.5665/sleep.1382
39. Covassin N, Singh P. Sleep Duration and Cardiovascular Disease Risk: Ep-idemiologic and Experimental Evidence. Sleep Med Clin. 2016;11(1):81-9. DOI: 10.1016/j.jsmc.2015.10.007.Sleep
40. Spiegel K, Leproult R, Van Cauter E. Impact of sleep debt on metabolic and endocrine function. Lancet. 1999;354(9188):1435-9. DOI: 10.1016/ S0140-6736(99)01376-8
41. Depner CM, Stothard ER, Wright KP Jr. Metabolic consequences of sleep and circadian disorders. Curr Diab Rep. 2014;14(7):507. DOI: 10.1007/s11892-014-0507-z
42. National Center for Health Statistics. Health, United States, 2016: With Chartbook on Long-term Trends in Health. Hyattsville: National Center for Health Statistics; 2017. p. 314-7.
43. Mullington JM, Haack M, Toth M, Serrador JM, Meier-Ewert HK. Car-diovascular, inflammatory, and metabolic consequences of sleep dep-rivation. Prog Cardiovasc Dis. 2009;51(4):294-302. DOI: 10.1016/j. pcad.2008.10.003.
44. Ma QQ, Yao Q, Lin L, Chen GC, Yu JB. Sleep duration and total cancer mortality: a meta-analysis of prospective studies. Sleep Med. 2016;28:39-44. DOI: 10.1016/j.sleep.2016.06.036
45. Zhao H, Yin JY, Yang WS, Qin Q, Li TT, Shi Y, et al. Sleep duration and cancer risk: a systematic review and meta-analysis of prospective stud-ies. Asian Pacific J Cancer Prev. 2013;14(12):7509-15. DOI: 10.7314/ APJCP.2013.14.12.7509
46. Patel SR, Malhotra A, Gao X, Hu FB, Neuman MI, Fawzi WW. A Pro-spective study of sleep duration and pneumonia risk in women. Sleep. 2012;35(1):97-101. DOI: 10.5665/sleep.1594
47. Budhiraja R, Siddiqi TA, Quan SF. Sleep disorders in chronic obstructive pulmonary disease: etiology, impact, and management. J Clin Sleep Med. 2015;11(3):259-70. DOI: 10.5664/jcsm.4540
48. Kutty K. Sleep and chronic obstructive pulmonary disease. Curr Opin Pulm Med. 2004;10(2):104-12.
49. Neckelmann D, Mykletun A, Dahl AA. Chronic insomnia as a risk factor for developing anxiety and depression. Sleep. 2007;30(7):873-80. 50. Pandey A, Demede M, McKoy F, Zizi F, Girardin JL. Race/ethnicity,
sleep duration and quality of life: Analysis of the behavioral risk factor surveillance system. Sleep Med. 2011;12(Suppl 1):S92.
51. Pilz LK, Keller LK, Lenssen D, Roenneberg T. Time to rethink sleep quality: PSQI scores reflect sleep quality on workdays. Sleep. 2018;41(5). DOI: 10.1093/sleep/zsy029
52. Hachul H, Frange C, Bezerra AG, Hirotsu C, Pires GN, Andersen ML, et al. The effect of menopause on objective sleep parameters: data from anepidemiologic study in São Paulo, Brazil. Maturitas. 2015;80(2):170-8. DOI: 10.1016/j.maturitas.2014.11.002