Ecology and photosynthetic activity of a newly-discovered
Vaucheria sp. dominated Arctic microphytobenthos, Svalbard.
Claude-Eric Souquieres
UNIVERSIDADE DO ALGARVE
Marine Biology Master (MBM) Programme
i
Ecology and photosynthetic activity of a newly-discovered
Vaucheria sp. dominated Arctic microphytobenthos, Svalbard.
Claude-Eric Souquieres
UNIVERSIDADE DO ALGARVE
Marine Biology Master (MBM) Programme
2016/2018
Student: Claude-Eric Souquieres (student n° a57343), claude.souquieres@gmail.com
Supervisor: Josef Elster (CPE), Josef.Elster@ibot.cas.cz
Co-Supervisors: Rui Santos (uAlg), rosantos@ualg.pt
Sending institution: Universidade do Algarve, Faro, Portugal – Faculty of Marine Biology (uAlg)
Receiving organization/Enterprise: University of South Bohemia – Faculty of Science, Centre for Polar ecology (CPE)
ii
Declaração de autoria de trabalho
Ecology and photosynthetic activity of a newly-discovered Vaucheria
sp. dominated Arctic microphytobenthos, Svalbard.
Declaro ser o(a) autor(a) deste trabalho, que é original e inédito. Autores e trabalhos consultados estão devidamente citados no texto e constam da listagem de referências incluída.
_______________________________________________________
A Universidade do Algarve reserva para si o direito, em conformidade com o disposto no Código do Direito de Autor e dos Direitos Conexos, de arquivar, reproduzir e publicar a obra, independentemente do meio utilizado, bem como de a divulgar através de repositórios científicos e de admitir a sua cópia e distribuição para fins meramente educacionais ou de investigação e não comerciais, conquanto seja dado o devido crédito ao autor e editor respetivos.
iii
Acknowledgements
I would like to express my sincere gratitude to my supervisor and co-supervisor, Dr. Josef Elster & Dr. Jana Kviderova whose understanding, and knowledge of the Arctic have helped me through the achievement of this Master Thesis. Not only have I benefited from their skills and knowledge in several areas, but also from their attentive support, providing me with many opportunities to study and work in the exalting landscapes of the Norwegian archipelago of Svalbard.
I would also like to address a special thank you to all the people whom contributed to make this thesis possible, including all the staff of the Centre for Polar Ecology in Ceske Budejovice. Especially, Petra Luláková for her help regarding the granulometric analysis. Jakub Ondruch for his experienced help mapping the tidal flat by means of drone. Dr. Tomáš Hajek for the recommendations he provided us regarding the photosynthetic measurements. Tomáš Hubáček for the time he spent explaining me the Triple Quadrupole ICP-MS Technology and numerous other people whose names might have escaped my distracted mind.
I am grateful to this MBM Master Program for the opportunity I had to live and study in Portugal as well as in Czech Republic, with its ups and downs along the way but eventually coming together as an irrefutable uplifting experience.
Finally, I would like to thank with all my heart my parents and my family who have always showed an infinite support for every decision I took and regardless of their apparent madness at times. Far away in too many circumstances though always closely caring.
This work was supported by the University of South Bohemia (USB), Faculty of Science, Centre for Polar Ecology (projects LM2015075, EF16_013/0001782 – SoWa Ecosystems Research).
iv
Resumo
Um estudo abrangente da ecologia e atividade fotossintética de uma espécie recém-descoberta no Ártico, Vaucheria sp., que domina o microfibentos foi abordado neste estudo. O microfitobentos é uma comunidade muito diversificada de organismos microscópicos localizada nos sedimentos superficiais dos ecossistemas aquáticos. Ocorre geralmente nos vários milímetros superiores de sedimentos iluminados, formando um subtil biofilme acastanhado ou esverdeado no fundo do mar. O microfitobentos é constituído por vários grupos de diatomáceas fotossintéticas, cianobactérias, flagelados e algas. Esta comunidade fotossintética de microrganismos desempenha um papel ecológico central no ambiente estuarino. É responsável por uma fração significativa da produção primária total, podendo até exceder a produtividade pelágica em certas circunstâncias. Além disso, o microfitobentos desempenha um papel importante na mediação das trocas de nutrientes entre o sedimento e a água. Sabe-se também que melhora o acoplamento bento-pelágico e em algumas circunstâncias, afeta positivamente a bio estabilização do fundo do mar. Apesar da sua importância ecológica nas áreas costeiras, muito pouco se sabe sobre o microfitobentos ártico em relação à sua ecologia, desempenho fotossintético e produtividade. No litoral ártico, onde existem grandes variações inter-sazonais de luz, temperaturas e concentrações de nutrientes, juntamente com pressões crescentes, as comunidades microfitobênticas mostraram sinais de excelentes adaptações metabólicas. No estudo que foi realizado da planície de maré da costa ocidental de Svalbard em que habita a Vaucheria sp. foram encontrados bons desempenhos fotossintéticos. Demonstramos que neste ecossistema, existe um impacto forte das coocorrências marinhas e de água doce na qual a Vaucheria sp. habita. Sugere-se que a Vaucheria sp. pode tolerar uma grande variedade de conteúdo de salinidade até aproximadamente 40 PSU. A heterogeneidade ecológica desta planície de maré em que Vaucheria sp. ocorre foi descrita cuidadosamente. Através da amostragem da coluna de água, observou-se que o fósforo era um fator limitante. No entanto, no final de agosto de 2017, observou-se uma alteração temporal que afetou os níveis de nutrientes na coluna de água. Observou-se que ao alterar as condições, alterando o fósforo como fator limitante para sílica, observou-se a natureza altamente dinâmica desse ecossistema de maré e sugerindo uma transição na comunidade estuarina. Especula-se que o florescimento tardio de diatomáceas árticas no verão, deve-se a uma exaustão significativa de sílica na coluna de água, sendo responsável por esta mudança de nutrientes no final da amostragem. Outros compostos químicos foram relatados como variar significativamente ao longo da amostragem. Notavelmente, na coluna de água registou-se uma diminuição significativa no NO2-N,
v enquanto que no Azoto total, PO4-P, Fósforo Total, Mg, SO4, K, Na e Ca observou-se um
aumento significativo. Da mesma forma, observou-se uma diminuição significativa nas concentrações de NO3-N e PO4-P no sedimento da planície de maré.
Em relação ao ecossistema, demonstrou-se que existe uma forte contribuição da Vaucheria sp. para a produtividade fotossintética local, afetando o ciclo de carbonatos na coluna de água. Portanto, esta comunidade de Vaucheria sp. afeta significativamente os fatores químicos da água, especialmente o ciclo de carbonato. O microfitobentos não afeta apenas os fatores hidroquímicos da planície de maré, afeta também as características físicas e químicas do sedimento. A comunidade de Vaucheria sp. está correlacionada com baixo teor de unidade sedimentar e baixa percentagem de carbono orgânico nos sedimentos da planície de maré. Essa observação pode indicar o forte impacto dessa comunidade microfitobêntica na biogeoquímica do leito marinho. Um efeito que foi estudado e que é bem conhecido dos microfitobentos no sedimento é a bio estabilização do fundo do mar. Os organismos microfitobentónicos desempenham um papel fundamental no aumento da estabilização de sedimentos, protegendo o leito marinho da erosão causada pelo constante movimento da maré, libertando substâncias poliméricas extracelulares resultantes da atividade fotossintética, auxiliando na-bio estabilização do leito marinho. Embora não se tenha investigado diretamente a estabilidade do sedimento, especula-se que as observações ecológicas podem ser uma consequência indireta da bio-estabilização local do sedimento induzido pela comunidade de Vaucheria sp.. Outras investigações seriam necessárias para confirmar o hipotético efeito bio-estabilizante desta comunidade no ecossistema.
Embora Vaucheria sp. pareça dominar este ecossistema de maré baixa, foram encontradas evidências da ocorrência de uma comunidade microfitobêntica muito mais dinâmica e complexa e na qual Vaucheria sp. parece desempenhar uma função essencial. A comunidade de Vaucheria sp. exibiu uma notável plasticidade fisiológica em relação a um amplo espectro de intensidades luminosas que variam de 10 a 650 μmol m-2 s-1. A combinação de técnicas gasométricas e de várias técnicas de fluorescência de clorofila a foram utilizadas neste estudo, permitindo determinar os desempenhos fotossintéticas gerais da comunidade de Vaucheria sp. A comunidade de Vaucheria sp. foi capaz de utilizar um amplo espectro de intensidades PAR sem mostrar qualquer fotoinibição para intensidades PAR até um máximo de 650 μmol m-2 s-1. Foram medidas características fotossintéticas gerais das Vaucheria sp. e,
foi reportado nesta espécie uma eficiência fotossintética média (α) de 0,00641 (± 0,00061), a qual não se alterou com a intensidade PAR a que foi aclimatada. A fotossíntese máxima (Pmax)
vi variou de 0,756 a 1,188 nmol g-1 s-1, medida por via gasométrica. O Icomp médio foi de 38,53
μmol m-2 s-1, aproximadamente dez vezes menor do que o das algas bentónicas análogas
extremamente sombreadas. Além disso, dados os valores de irradiância de saturação, Ek ou Isat, Vaucheria sp. parece estar adaptada à pouca luz. Por fim, Vaucheria sp. foi capaz de uma fotoaclimatação rápida através da transição consecutiva entre a luz de baixa irradiância recebida e a de alta. Esta qualidade de fotoaclimação rápida de Vaucheria sp. está provavelmente ligada às transições de estado ou ao ciclo das xantofilas.
Palavras-chaves (4-6): Ecologia litoral ártica, microphytobenthos, ecofisiologia da Vaucheria sp.
vii
English abstract
A comprehensive study of the ecology and photosynthetic activity of a newly-discovered Vaucheria sp. dominated arctic microphytobenthos was addressed here. The microphytobenthos is a very diversified community of microscopic organisms from the surficial sediment of aquatic ecosystems. It typically consists of various assemblages of substrate-dwelling photosynthetic diatoms, cyanobacteria, flagellates and algae. The microphytobenthos plays a central ecological role in estuarine environment, responsible for a significant fraction of the total primary production, mediating water-sediment nutrient exchanges, enhancing benthic-pelagic coupling and efficiently stabilizing the sediment. Despite their ecological value in coastal areas, very little is known about arctic microphytobenthos ecology and photosynthetic performances. Across the arctic coastline, where large inter-seasonal variations in light, temperatures and nutrient levels are experienced along with increasing pressures, microbenthic communities have shown signs of excellent metabolic adaptations. In case, across this arctic tidal flat, Vaucheria sp. was found to show a remarkable adaptation to the local ecological parameters. We demonstrated in this ecosystem the strong impacts of both marine and freshwater co-occurrences creating Vaucheria sp. environment. The heterogeneity of Vaucheria sp. habitat was described. Locally, the water column was phosphorus-limited and a temporal shift from phosphorous to silica-limited conditions occurred throughout the sampling period, witnessing of the highly dynamic nature of this tidal ecosystem. At the ecosystem level, the strong microphytobenthos’ photosynthesis was supported by significant high water-pH values, correlated to Vaucheria sp. spatial occurrence. Even though Vaucheria sp. seemed to dominate, we found evidences of a more complex micro-phytobenthic community functioning. Vaucheria sp. community exhibited adaptability to large variations in abiotic factors. Gasometric and Chlorophyll fluorescence measurements did not show any limitation of the photosynthetis over the range of environmental PAR suggesting good photoacclimation of Vaucheria sp. to arctic conditions. Based on the compensation irradiance value of Vaucheria sp. we demonstrated this alga to be low-light adapted. Furthermore, Vaucheria sp. was capable of fast photo-acclimation through the consecutive transition from low to high incoming light irradiances. This quality of Vaucheria sp. fast photo-acclimation is thought to be linked to state transitions or effective xanthophyll cycle.
viii Keywords (4-6): Arctic coastal ecology, microphytobenthos, Vaucheria sp.
ix
Table of content
DECLARAÇÃO DE AUTORIA DE TRABALHO ... II ACKNOWLEDGEMENTS ... III RESUMO ... IV ENGLISH ABSTRACT ... VII LIST OF FIGURES ... X LIST OF TABLES ... XII
CHAPTER 1 – INTRODUCTION ... 1
1. ARCTIC OCEAN HYDROGRAPHY ... 1
1.1. Arctic ocean physical oceanography ... 1
1.2. Arctic Ocean bathymetry ... 3
1.3. Arctic Ocean hydrochemistry ... 4
2. ARCTIC LIGHT REGIME AND POLAR DAY LENGTH... 5
2.1. Irradiance quantity (E) ... 6
2.2. Spectral composition ... 6
3. THE CRYOSPHERE ... 7
3.1. Sea-ice ... 8
4. GEOSCIENCE OF SVALBARD ... 8
5. SVALBARD CLIMATIC CONDITIONS ... 10
6. ARCTIC MICROPHYTOBENTHOS ... 10
6.1. Arctic microphytobenthos growth ... 11
6.2. Arctic microphytobenthic primary production ... 11
6.3. Arctic microphytobenthic biodiversity ... 12
7. VAUCHERIA SP.– YELLOW-GREEN ALGA ... 13
7.1 Morphology ... 13
7.2. Reproduction and reproductive features ... 14
7.3. Distribution and habitat ... 14
8. OBJECTIVES ... 15
CHAPTER 2 – ECOLOGY AND PHOTOSYNTHETIC ACTIVITY OF A NEWLY-DISCOVERED VAUCHERIA SP. DOMINATED ARCTIC MICROPHYTOBENTHOS, SVALBARD. ... 16
MATERIAL &METHODS ... 16
Study area description ... 16
Sampling ... 17
Data collection and analysis ... 17
Statistical analysis ... 22
RESULTS ... 23
Physical environment & Topography ... 23
Spatial & temporal ecological heterogeneity ... 24
Data summary & ANOVA interpretation... 25
Vaucheria sp. biogeographical & ecological dispersion ... 27
Spatial & temporal biochemistry ... 28
N:P:Si ratio and limiting nutrients ... 34
Hydrochemical spatial distribution patterns – Principal Component Analysis ... 35
Sediment biochemistry ... 38
x
Vaucheria sp. photosynthetic activity ... 42
DISCUSSION ... 45
Tidal flat abiotic characterisation ... 45
General ecological parameters ... 45
Hydrochemical and biogeochemical parameters ... 47
Abiotic PCA summary ... 47
Hydrochemical and biogeochemical temporal evolution ... 48
Vaucheria sp. Ecological distribution ... 50
Vaucheria sp. community photosynthetic profile ... 51
CONCLUSION ... 52
REFERENCES ... 53
ANNEX ... 60
-List of figures
FIGURE I-1MAP OF THE ARCTIC OCEAN SHOWING THE MAJOR OCEANIC CURRENTS CARRYING ARCTIC WATER MASSES IN AND OUT OF THE ARCTIC OCEANIC SYSTEM.CREDIT TO THE AUDUN IGGESUND, AND THE NORWEGIAN POLAR INSTITUTE. ... 1FIGURE I-2BATHYMETRIC MAP OF THE ARCTIC OCEAN (COORDINATES: LON1=-10, LON2=66, LAT1=60, LAT2=82).MAP CREDIT TO NATIONAL OCEANOGRAPHIC AND ATMOSPHERIC ADMINISTRATION (NOAA).(RSTUDIO VERSION 3.4.4, PACKAGE: MARMAP)(RSTUDIO TEAM 2016). ... 3
FIGURE I-3BATHYMETRIC PROFILE OF THE ARCTIC OCEAN.(COORDINATES: LON1=-10, LON2=66, LAT1=60, LAT2=82).MAP CREDIT TO NATIONAL OCEANOGRAPHIC AND ATMOSPHERIC ADMINISTRATION (NOAA).(RSTUDIO VERSION 3.4.4, PACKAGE: MARMAP)(RSTUDIO TEAM 2016)... 4
FIGURE I-4SUN DIAGRAM FOR LONGYEARBYEN,SVALBARD,2018.PRODUCED BY SVALBARD SAMFUNNS DRIFT AS AND LONGYEARBYEN LOKALSTYRE. ... 5
FIGURE I-5DESCRIPTIVE SKETCH OF THE DIFFERENT ELEMENTS CONSTITUTING THE ARCTIC CRYOSPHERE SYSTEM.SOURCE:SWIPA (AMAP)2011. ... 7
FIGURE I-6GEOLOGICAL MAP OF SVALBARD.COLOR LEGENDS: SEE ANNEX.(QGIS3.0)(QGISDEVELOPMENT TEAM 2018) ... 9
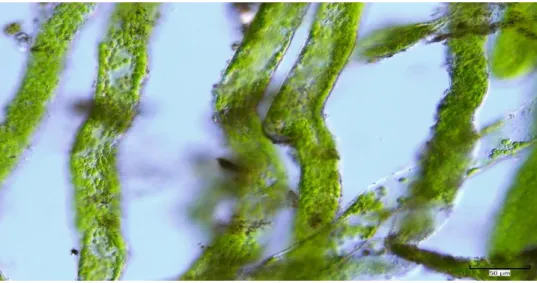
FIGURE I-7MICROSCOPIC PICTURE OF VAUCHERIA SP. FILAMENTS COLLECTED IN THE TIDAL FLAT ADJOINING LONGYEARBYEN, SVALBARD,2017. ... 13
FIGURE I-8PICTURE OF A DENSE BIOFILM OF VAUCHERIA SP. MICROBENTHIC ALGAE COVERING THE SEABED IN ADVENTDALEN -ADVENTFJORDEN TIDAL FLAT.SVALBARD,2017.CREDIT PHOTO TO DR.ELSTER. ... 14
FIGURE II-1GEOGRAPHIC LOCATION OF THE STUDIED TIDAL FLAT, RED DOT = STUDIED LOCATION (UPPER MAP).DETAILED MAP OF THE SAMPLING AREA WITH TRANSECTS I,II AND III(LOWER MAP).SAMPLING SITES ALONG THE TRANSECT ARE NUMBERED FROM ONE TO FOUR FROM BOTTOM TO TOP STARTING FROM TI.1.THE RED ZONE DELIMITS THE HIGH TIDE FRONT AND IN BLUE THE LOW TIDE CHANNEL.SAMPLING SITES IN GREEN REFER TO THE PRESENCE OF VAUCHERIA SP.(QGIS3.0+GOOGLE EARTH PRO) (QGISDEVELOPMENT TEAM 2018). ... 16
FIGURE II-2EVOLUTION OF THE LIGHT ENVIRONMENT THROUGHOUT THE SAMPLING PERIOD STARTING FROM AUGUST 12,2017, 14:00UTC, TO AUGUST 31,2017,8:00UTC. ... 24
FIGURE II-3SOIL TEXTURE TRIANGLE WITH RESULTS OF THE GRANULOMETRY ANALYSIS OVER THE STUDIED TIDAL FLAT. ... 24
FIGURE II-4BOX PLOTS DATA ANALYSIS OF THE MAIN PHYSICAL ABIOTIC PARAMETERS INCLUDING WATER PH, SALINITY, DENSITY, SEDIMENT MOISTURE AND WATER TEMPERATURE. ... 26 FIGURE II-5BIPLOT DATA ANALYSIS OF VAUCHERIA SP. DISTRIBUTION BASED ON THE MAIN ABIOTIC PHYSICAL PARAMETERS (SCORES OF
xi
DENSITY AND SEDIMENT MOISTURE).EACH SMALL DOT REPRESENTS ONE SAMPLING SITE.BLUE =PRESENCE OF VAUCHERIA, RED = ABSENCE.THE LARGER DOT REPRESENTS THE OVERALL AVERAGE SCORE FOR THE RESPECTIVE GROUPS.(RSTUDIO TEAM 2016). ... 28 FIGURE II-6BOX PLOTS DATA ANALYSIS OF THE HYDROCHEMICAL PARAMETERS INCLUDING:NH4-N,N02-N,N03-N,TN,PO4-P,TP,
MG,SI,SO4,K,FE,MN,NA,CA.(RSTUDIO TEAM 2016). ... 33
FIGURE II-7SCATTER DIAGRAMS OF THE SI:N:P ATOMIC NUTRIENT RATIOS INTRINSIC TO THE TIDAL FLAT’S WATER COLUMN FOR THE MONTH OF AUGUST 2017.THE MOLAR QUOTIENTS ARE DELIMITED IN THIS LOGARITHMIC PLOT BY THE SI:N=1:1(VERTICAL LINE),N:P=16:1(HORIZONTAL LINE) AND SI:P=16:1(OBLIQUE LINE) LINES.THE LINES ENABLE TO DIVIDE THE PLOT INTO SIX DIFFERENT AREAS.EACH OF THESE AREAS INDICATES THE POTENTIALLY LIMITING NUTRIENT WATER PROFILE, WITH LIMITING NUTRIENTS LISTED BY ORDER OF IMPORTANCE.(RSTUDIO TEAM 2016). ... 35 FIGURE II-8BIPLOT DATA ANALYSIS OF THE SPATIAL HYDROCHEMICAL DISTRIBUTION BY TRANSECTS (SCORES OF EACH SAMPLING SITES
AND LOADINGS OF THE DIFFERENT CHEMICAL VARIABLES INCLUDING:NH4-N,N02-N,N03-N,TN,PO4-P,TP,MG,SI,SO4,
K,FE,MN,NA,CA) ON THE LEFT.THE LARGER DOT REPRESENTS THE OVERALL AVERAGE SCORE FOR THE RESPECTIVE GROUPS. (RSTUDIO TEAM 2016). ... 37 FIGURE II-9BIPLOT DATA ANALYSIS OF THE SPATIAL HYDROCHEMICAL DISTRIBUTION BY SITES (SCORES OF EACH SAMPLING SITES AND
LOADINGS OF THE DIFFERENT CHEMICAL VARIABLES INCLUDING:NH4-N,N02-N,N03-N,TN,PO4-P,TP,MG,SI,SO4,K,FE, MN,NA,CA).EACH SMALL DOT REPRESENTS ONE SAMPLING SITE.THE LARGER DOT REPRESENTS THE OVERALL AVERAGE SCORE FOR THE RESPECTIVE GROUPS.(RSTUDIO TEAM 2016). ... 37 FIGURE II-10.BOX PLOTS DATA ANALYSIS OF THE SEDIMENT CHEMICAL PARAMETERS INCLUDING:NH4-N,N03-N,PO4-P.(RSTUDIO
TEAM 2016). ... 39 FIGURE II-11BOX PLOT DATA ANALYSIS OF THE ORGANIC CARBON CONTENT PRESENT IN THE SURFACE LAYER OF THE SEAFLOOR
ACROSS THE TIDAL FLAT.(RSTUDIO TEAM 2016). ... 40 FIGURE II-12BIPLOT DATA ANALYSIS OF THE SPATIAL SEDIMENT CHEMICAL DISTRIBUTION BY TRANSECTS (SCORES OF EACH SAMPLING
SITES AND LOADINGS OF THE DIFFERENT CHEMICAL VARIABLES INCLUDING:NH4-N,N03-N,PO4-P).EACH SMALL DOT REPRESENTS ONE SAMPLING SITE.LEFT, RED =TRANSECT I, GREEN =TRANSECT II,BLUE =TRANSECT III.THE LARGER DOT REPRESENTS THE OVERALL AVERAGE SCORE FOR THE RESPECTIVE GROUPS.(RSTUDIO TEAM 2016). ... 41 FIGURE II-13BIPLOT DATA ANALYSIS OF THE SPATIAL SEDIMENT CHEMICAL DISTRIBUTION BY TRANSECTS (SCORES OF EACH SAMPLING
SITES AND LOADINGS OF THE DIFFERENT CHEMICAL VARIABLES INCLUDING:NH4-N,N03-N,PO4-P).EACH SMALL DOT REPRESENTS ONE SAMPLING SITE.THE LARGER DOT REPRESENTS THE OVERALL AVERAGE SCORE FOR THE RESPECTIVE GROUPS. (RSTUDIO TEAM 2016). ... 42 FIGURE II-14THE DEPENDENCE OF THE NET PHOTOSYNTHESIS (PNET), GROSS PHOTOSYNTHESIS (PGROSS) AND DARK RESPIRATION (RD)
EXPRESSED AS CO2 ASSIMILATION RATE (MEAN ± S.D., N =3) AT DIFFERENT PAR INTENSITIES.THE LETTERS INDICATE HOMOLOGOUS GROUPS RECOGNIZED BY TUKEY HSD TEST AT P=0.05.THE NUMBER IN LEGEND INDICATES PAR IN µMOL M-2 S-1. ... 42 FIGURE II-15THE DEPENDENCE OF ETR MEASURED IN THE LIGHT (ETR-LIGHT) AND ETR MEASURED IN THE DARK (ETR-DARK) AT
DIFFERENT PAR INTENSITIES (MEAN ± S.D., N =3).THE LETTERS INDICATE HOMOLOGOUS GROUPS RECOGNIZED BY TUKEY HSD TEST AT P=0.05.THE NUMBER IN LEGEND INDICATES PAR IN µMOL M-2 S-1. ... 43 FIGURE II-16THE DEPENDENCE OF COMPENSATION (ICOMP; MEAN ± S.D., N =3) AND SATURATION (ISAT; MEAN ± S.D., N =3)
IRRADIANCES ESTIMATED FROM GASOMETRIC (CO2 ASSIMILATION) AND FLUORESCENCE (ETR) MEASUREMENTS FOR DIFFERENT
PAR INTENSITIES.THE LETTERS INDICATE HOMOLOGOUS GROUPS RECOGNIZED BY TUKEY HSD TEST AT P=0.05. ... 44 FIGURE II-17PHOTOSYNTHESIS-IRRADIANCE CURVES FOR CO2 ASSIMILATION AND ETR(MEAN ± S.D., N =3).LL– LOW LIGHT OF 10
µMOL M-2 S-1,ML– MEDIUM LIGHT OF 230 µMOL M-2 S-1,HL– HIGH LIGHT OF 650 µMOL M-2 S-1. ... 44 FIGURE II-18QUALITATIVE TEMPORAL EVOLUTION OF A SPECIFIC SET OF BIOCHEMICAL PARAMETERS ACROSS ADVENTDALEN
-ADVENTFJORDEN’S TIDAL FLAT INCLUDING:N02-N,TN,PO4-P,TP,MG,SI,SO4,K,NA,CA IN THE WATER SURFACE LAYER &
N03-N,PO4-P IN THE SEDIMENT SURFACE LAYER. THE MONITORING TOOK PLACE DURING THE MONTH OF AUGUST 2017 FROM THE 09/08 TO THE 25/08/17.RED = HIGH CONCENTRATED &BLUE = LOW CONCENTRATED. ... 48
xii
List of tables
TABLE II-1SUMMARY OF THE MAIN ABIOTIC PARAMETERS ... 25 TABLE II-2PCA SUMMARY OF THE MAIN PHYSICAL PARAMETERS & ASSOCIATED EIGEN VALUES SCORES. ... 27 TABLE II-3HYDROCHEMICAL PARAMETERS FROM THE WATER SURFACE OF ADVENTDALEN'S TIDAL FLAT. ... 29 TABLE II-4KRUSKAL-WALLIS STATISTICAL SCORES OF THE TIDAL FLAT HYDROCHEMICAL PARAMETERS (UPPER TABLE)&WILCOXON
STATISTICAL SCORES OF THE HYDROCHEMICAL VARIABLES (LOWER TABLE).STATISTICALLY SIGNIFICANT FOR P <0.05(DISPLAYED IN RED). ... 34 TABLE II-5PCA SCORES SUMMARY.IN GREEN VALUES <0.5(NEGATIVELY CORRELATED) AND RED >0.5(POSITIVELY CORRELATED). . 35 TABLE II-6HYDROCHEMISTRY PCA EIGEN VALUES AND CUMULATIVE VARIANCE. ... 36 TABLE II-7SEDIMENT BIOCHEMICAL INVENTORY. ... 38 TABLE II-8KRUSKAL-WALLIS STATISTICAL SCORES OF THE BIOCHEMICAL PARAMETERS (UPPER TABLE)&WILCOXON STATISTICAL
SCORES OF THE SEDIMENT BIOCHEMICAL PARAMETERS (LOWER TABLE).STATISTICALLY SIGNIFICANT FOR P <0.05(DISPLAYED IN RED). ... 40 TABLE II-9PCA SUMMARY OF THE BIOCHEMICAL PARAMETERS & ASSOCIATED EIGEN VALUES.IN GREEN VALUES <0.5(NEGATIVELY
1
CHAPTER 1 – Introduction
1. Arctic ocean hydrography
The Arctic region is a fundamental and unique area among the Earth’s ecosystems, raising northwards from the 66° parallel north. This region is presently transforming at an unequivocal pace, exceeding any other regions globally (Serreze and Francis 2006). Furthermore, the rate of its change is predicted to accelerate in the coming future (Serreze and Francis 2006). Across its extent, the arctic ocean and its coastal zone are particularly vulnerable.
1.1. Arctic ocean physical oceanography
A substantial portion of the arctic region is occupied by a large Arctic Ocean, itself surrounded by several landmasses and rich industrialized countries. The Arctic Ocean forms a semi-enclosed system profoundly affected by diverse oceanic and atmospheric influences from neighbouring sub-arctic regions (Sakshaug, Johnsen, and Kovacs 2011; Hattermann et al. 2016). The Arctic ocean connects two of the world’s major oceans: connecting the Pacific Ocean through the Chukchi Sea and the Atlantic Ocean through the Greenland Sea and Labrador Sea (Cokelet, Tervalon, and Bellingham 2008; The Norwegian Polar Institute, n.d.). The Arctic Ocean is divided in the middle in two major basins, delimited by the Lomonosov ridge. The Canadian basin extends westwards from the Lomonosov ridge, while The Eurasian basin including Svalbard locates to the East (Jakobsson et al. 2012).
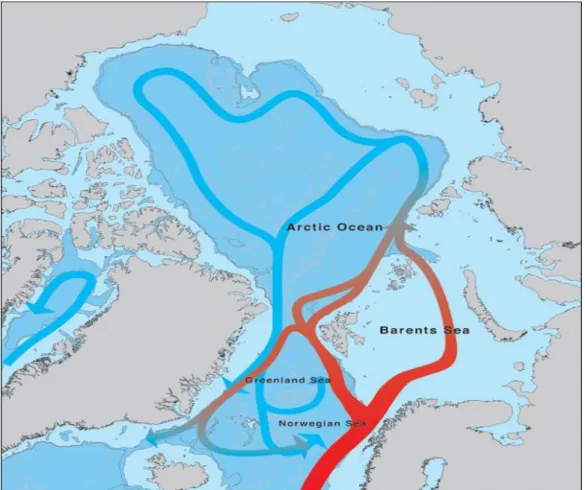
Figure I-1 Map of the Arctic ocean showing the major oceanic currents carrying Arctic water masses in and out of the Arctic oceanic system. Credit to the Audun Iggesund, and The Norwegian Polar Institute.
2 The Arctic Ocean’s physical oceanography is tightly correlated to its hydrochemistry, hence affecting profoundly arctic marine productivity as a whole (Nikiforov, Colony, and Timokhov 2001; Rudels, Larsson, and Sehlstedt 2016). Water masses enter the Arctic Ocean system from two main passages. They enter through the Bering Strait driven along by the Bering Sea gyratory current, but also and primarily via the Fram Strait as a powerful North Atlantic inflow (Figure I-1) (Cokelet, Tervalon, and Bellingham 2008; The Norwegian Polar Institute, n.d.). Subsequently, water masses exit the Arctic system either via deep currents from the Norwegian Sea toward the Atlantic, or via surface currents driven along by the Greenland and Labrador currents (Changsheng 2014) (Figure I-1). To the Pacific side, very little Arctic water flows out due to the narrow morphology of the seafloor (Changsheng 2014; Cokelet, Tervalon, and Bellingham 2008).
The Arctic Ocean’s physical oceanography is strongly seasonally influenced (Rudels, Larsson, and Sehlstedt 2016). Likewise, spatially the Arctic Ocean’s physical oceanographic differs remarkedly throughout its extent (Rudels, Larsson, and Sehlstedt 2016). Across the Barents Sea, oceanographic variations are believed to be mainly of advective origin, depending primarily on the transfer of water masses (Sakshaug, Johnsen, and Kovacs 2011). Furthermore, in this shallow region, the water column is typically deep and strongly stratified (Rudels, Larsson, and Sehlstedt 2016). Along Svalbard’s western littoral, the interplay of various oceanic currents produce together the set of environmental variables intrinsic to Svalbard coastal ecosystems (Cokelet, Tervalon, and Bellingham 2008; Howe, Moreton, & Morris, 2003). As warm North Atlantic currents gradually progress northwards, these dense Atlantic water masses are funnelled down underneath local Arctic water masses in the vicinity of Svalbard’s western littoral (Cokelet, Tervalon, and Bellingham, 2008). Atlantic water masses are typically characterized by temperatures above 0°C and high salinity above 35 PSU (Cokelet, Tervalon, and Bellingham 2008). The warm and salty West Spitsbergen Current flows northwards along Svalbard’s western continental ridge, mixing up with the inflow of Atlantic waters causing the relatively ice-free conditions inherent to western Svalbard (Vinje 2001). The mixing of Atlantic water masses and regional water masses results in the formation of a unique water mass referred as “Transformed Atlantic Water”, with lower salinity and temperatures values compared to Atlantic water masses, around one degree Celsius and 34.7 PSU (Cokelet, Tervalon, and Bellingham 2008). This transformed water mass is principally confined to the intermediate layer of the water column. Beneath it the bottom water layer also called Local Water mass displays colder waters resulting from winter cooling, sea ice formation and seasonal convection processes (Cokelet, Tervalon, and Bellingham 2008; Rudels, Larsson, and Sehlstedt 2016). This bottom water layer originates from the local accumulation of brine-enriched water masses throughout the winter period. The accumulation of brine creates dense, very cold high-salinity waters which consecutively sink down in a process referred as convection (Rudels, Larsson, and Sehlstedt 2016). Eventually, the bottom water layer becomes too dense that these water masses are hardly resuspended to upper layers (Rudels, Larsson, and Sehlstedt 2016). This stratification has a strong influence on marine primary production and especially for the benthos, as it selectively keeps nutrients to the benthos (Gazeau et al. 2004).
3 With today’s strengthened and increasing north atlantic inflow, we currently observe what is referred as the “Atlantification” of the Arctic Ocean (Vesman, Ivanov, and Volkov 2017; Polyakov et al. 2017). More and more evidences report the profound impact of increasing atlantic inputs to the physical oceanography intrinsic to the arctic ocean (Berge et al. 2005; Pavlov et al. 2013). These observations in most cases were strongly linked to climate change effects, local atmospheric conditions and large-scale weather phenomenon such as the North Atlantic Oscillation (Sakshaug, Johnsen, and Kovacs 2011).
1.2. Arctic Ocean bathymetry
The Arctic Ocean expands over 15 558 000 km2 of seafloor with a total average depth of 1 205 m, and a maximum depth reaching 5 549 m at the Litke Deep trench (Eakins and Sharman 2010). Arctic coastal regions occupy a total area of up to 5.8 to 6.1 million km2 (Lantuit et al. 2012). Most of these Arctic coastal regions are characterized by shallow bathymetric profiles, especially along the Russian littoral (Figure 2, I-3) (Jakobsson et al. 2012). More than 60% of the Arctic ocean consists of extensive stretches of shallow continental shelves laying on average at depths about 230 m (Stein et al. 2004; Gattuso et al. 2006; Sakshaug, Johnsen, and Kovacs 2011).
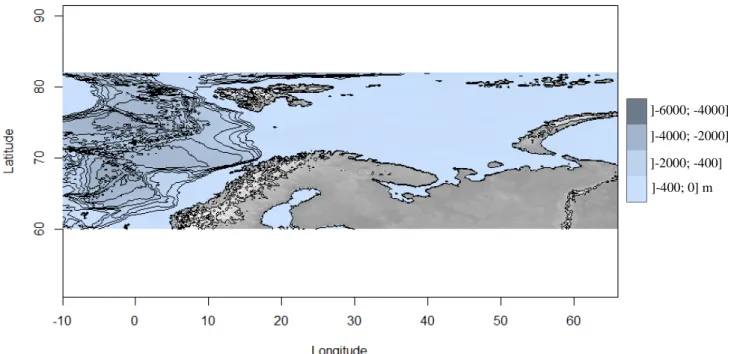
Along Svalbard’s littoral, or more generally in the Eurasian basin to the East side of Svalbard, most of the coastal seafloor lies at shallow depth reaching depths up to 400 meters maximum (Figure I-2, I-3) (Jakobsson
Figure I-2 Bathymetric map of the Arctic Ocean (coordinates: lon1= -10, lon2= 66, lat1= 60, lat2= 82). Map credit to National Oceanographic and Atmospheric Administration (NOAA). (Rstudio version 3.4.4, package: marmap)(RStudio Team 2016).
]-6000; -4000] m ]-4000; -2000] m ]-2000; -400] m ]-400; 0] m
4 et al. 2012). Due to this shallowness A significant portion of this coastal seafloor is believed to accommodate large communities of benthic organisms (macrobenthic and microbenthic) (Gattuso et al. 2006).
1.3. Arctic Ocean hydrochemistry
The Arctic Ocean is the world’s smallest (14 056 000 km2), shallowest and coldest ocean on Earth (The world Factbook 2011). It is comprised of the following regional seas: the Barents Sea (1 405 000 km2), Kara Sea (880 000 km2), Laptev Sea (714 837 km2), Chukchi Sea (582 000 km2), Beaufort Sea (476 000 km2), Greenland Sea, Lincoln Sea and the East Siberian Sea (Briney 2018). Throughout the Arctic Ocean, nutrient concentrations are typically low and varies largely throughout the year (Sakshaug, Johnsen, and Kovacs 2011).
Arctic Ocean hydrochemistry is a key feature for arctic marine life as it produces the necessary ecological conditions for the development and inhabitancy of a specific flora and fauna (Nikiforov, Colony, and Timokhov 2001). A variety of ecological processes including oceanographic, cryogenic, atmospheric and biological processes, affects profoundly nutrients concentration and distribution throughout the Arctic Ocean and within the water column (Cokelet, Tervalon, and Bellingham 2008). Comparatively to light, nutrients concentration is the second most important limiting factor in marine ecosystems accountable for the growth of primary producers (Sakshaug, Johnsen, and Kovacs 2011). Marine nutrients comprise a highly diverse spectrum of chemical elements of which the dominant ones, include nitrogen, phosphorus, and silicate (Sakshaug, Johnsen, and Kovacs 2011). In the Barents Sea around Svalbard, the nutrient concentration is typically regarded as one of the poorest across the Arctic Ocean (Sakshaug, Johnsen, and Kovacs 2011). However, arctic spring nutrient admixtures (mainly nitrogen and silicic acid) from adjacent Arctic freshwater rivers seasonally supplies the Arctic Ocean from the onset of the springtime sea-ice melt (Stein et al. 2004). Yet the significance of these nutrient inputs to the Arctic Ocean must be contrasted, as it appears to be restricted only to very local coastal sites where nutrients are rapidly exhausted (Tremblay and Gagnon 2009). Arctic estuaries typically experience limiting phosphorous concentration because arctic rivers are relatively rich in nitrogen and silicic acid but poor in phosphate (Stein et al. 2004; Popova et al. 2010).
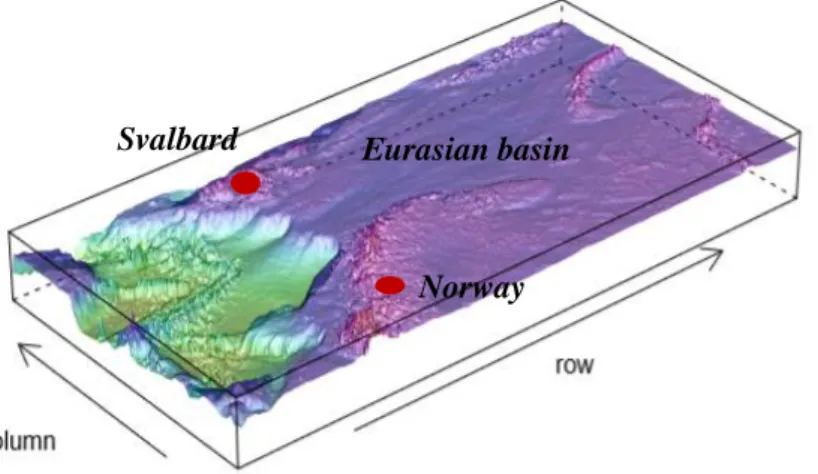
Eurasian basin
Norway Svalbard
Figure I-3 Bathymetric profile of the Arctic ocean. (Coordinates: lon1= -10, lon2= 66, lat1= 60, lat2= 82). Map credit to National Oceanographic and Atmospheric Administration (NOAA). (Rstudio version 3.4.4, package: marmap) (RStudio Team 2016).
5
2. Arctic light regime and polar day length
The light regime corresponds to the properties of the light occurring over a certain interval of time in a given medium and by which photosynthetic activity is regulated (Mascarenhas et al. 2017). It comprises a set of different parameters including: irradiance quantity (E; amount of incoming energy), irradiance quality (spectral composition), and day length, which varies simultaneously as a function of astronomical parameters and cyclical movements (e.g; Milankovic cycle), latitude and local inherent optical properties (Sakshaug, Johnsen, and Kovacs 2011).
The light regime is an ecologically important factor, profoundly influencing a wide range of biological processes (Mascarenhas et al. 2017). In the poles, the light climate is unique displaying extreme temporal and spatial variations, ranging from polar night conditions in winter to midnight sun conditions in summer (Figure I-4) (Sakshaug, Johnsen, and Kovacs 2011). At latitudes beyond the 66° parallel north, while there are high variations in light regime throughout the year, there are significantly less fluctuations with respect to diurnal variations (Sakshaug, Johnsen, and Kovacs 2011). The polar night season is the period of the year when the night lasts for more than 24 hours while the midnight sun season is when the sun remains above the horizon for more than 24 hours. This period of long darkness differs with respect to the light regime produced, depending on the geographical position from the North pole (Ludvigsen et al. 2018). It is usually divided into 3 periods according to the position of the sun (Ludvigsen et al. 2018).
Civil polar night: The civil polar night occurs when the sun is between 0°and 6° below the horizon.
It is perceived at latitudes above 72°.
Nautical polar night: The nautical polar night occurs when the sun is between 6°and 12° below the
horizon. It is experienced at latitudes above 78°.
Figure I-4 Sun Diagram for Longyearbyen, Svalbard, 2018. Produced by Svalbard Samfunns drift AS and Longyearbyen Lokalstyre.
6 Astronomical polar night: The astronomical polar night occurs when the sun is between 12°and 18°
below the horizon. It is limited to latitudes above 84° 33′.
2.1. Irradiance quantity (E)
The sun emits a uniform beam of electromagnetic radiations called the solar constant (Sakshaug, Johnsen, and Kovacs 2011). The Irradiance noted (E) refers to the sum of the incident spectral radiations that reached the Earth’s surface (Stine and Geyer 2001). It is a measure of the sum of solar radiations striking a unit surface per unit time and given in µmol of photons per m-2 s-1. At higher latitudes, the typical low sun angle reduces significantly the incoming irradiance from the sun (Stine and Geyer 2001). It is because at higher latitudes the incident solar radiations must travel through a thicker layer of air compared to zenith solar radiations (Sakshaug, Johnsen, and Kovacs 2011). This optical phenomenon is known as the cosine effect (Stine and Geyer 2001; Sakshaug, Johnsen, and Kovacs 2011). Despite the low solar elevation, the typical maximum solar irradiance experienced on a clear arctic summer day can reach up to 2000 µmol per m–2 s–1 at a latitude of 60°N (Sakshaug, Johnsen, and Kovacs 2011).
The polar irradiance constitutes a significant actinic source for all organisms, not to mention the sun illumination period characteristic of the midnight sun season (Mascarenhas et al. 2017; Sakshaug, Johnsen, and Kovacs 2011). Hence, over a 24-h integrated irradiance period, the polar irradiance experienced at latitudes higher than 66° is considerable and potentially as large as the diurnal irradiance experienced at the equator (Sakshaug, Johnsen, and Kovacs 2011). Arctic primary productivity is strongly dependent upon light availability. In the Arctic region, the spatial and temporal variability of the light field plays a central ecological role profoundly affecting all organisms both directly and indirectly (Mascarenhas et al. 2017).
2.2. Spectral composition
The spectral irradiance is the respective intensity for every single wavelength of the incident light spectrum and measured in µmol of photons per m-2 s-1 nm-1 (Sakshaug, Johnsen, and Kovacs 2011). Some of the constitutive wavelengths of this spectrum are attenuated along their paths, as they travel through the Earth’s atmosphere or any other given medium (Sakshaug, Johnsen, and Kovacs 2011; Kirk 2011; Mascarenhas et al. 2017). Indeed atoms, particles, clouds, phototrophic organisms and gasses present in the distinct media along the light path (e.g: H2O, O2, CO2, O3, DOM, POM, CDOM) governs the fate of the light
spectral composition (Kirk 2011). On average, about 50% of the total incident solar radiations is estimated to reach the Earth’s surface producing the natural light spectrum available for terrestrial photosynthetic organisms (Sakshaug, Johnsen, and Kovacs 2011).
In aquatic medium, the solar light regime is even more attenuated, determined as a function of the medium inherent optical properties (Mascarenhas et al. 2017; Kirk 2011). The fate of the incident spectral irradiance is essentially shaped by absorption and scattering events taking place as the incident light penetrates deeper through the water column (Kirk 2011). Coloured dissolved organic matter (CDOM), total suspended matter (TSM) and phototrophic biomass within the water column constitute altogether the inherent optical
7 properties of one’s aquatic medium (Kirk 2011). These properties are of particular importance for marine photosynthetic organisms as they regulate light availability for marine photochemistry (Kirk 2011; Mascarenhas et al. 2017). The actinic fraction of the solar light spectrum admitted to regulate photosynthesis is referred as the Photosynthetically Active Radiation (PAR) and spans between 400 and 700 nm (Kirk 2011). Yet, recently, several cyanobacteria have been reported to harvest radiations beyond this spectrum down to UV radiations at about 320 nm (Nürnberg et al., n.d.).
3. The Cryosphere
The cryosphere is comprised of the Earth’s sea-ice and snow cover, glaciers and ice caps, ice sheets, lake ice and permafrost-dominated grounds altogether (Figure I-5) (SWIPA, 2011). Cryospheric processes have large-scale fundamental implications on global circulation patterns and global atmospheric events (Vesman, Ivanov, and Volkov 2017). Furthermore, they affect locally the ecology, the biodiversity and the physico-chemistry of Arctic coastal and marine ecosystems (Vesman, Ivanov, and Volkov 2017).
While in the sub-Arctic region a rather seasonal sea ice coverage is experienced, across the high-Arctic the sea ice is more or less permanent forming multiyear-old sea ice (Sakshaug, Johnsen, and Kovacs 2011). Arctic ice extent fluctuates on a yearly basis, typically reaching a maximum in February-March and a minimum in September (Sakshaug, Johnsen, and Kovacs 2011). Major large-scale atmospheric phenomenon such as the North Atlantic Oscillation may greatly affect cryospheric processes throughout the Arctic (Sakshaug, Johnsen, and Kovacs 2011). Due to the large contribution of marine ecosystems to the overall
ecosystem production of Svalbard, sea-ice conditions in specific years may deeply affect coastal marine production throughout Svalbard’s archipelago (Polyakov et al. 2017).
Figure I-5 Descriptive sketch of the different elements constituting the Arctic cryosphere system. Source: SWIPA (AMAP) 2011.
8 3.1. Sea-ice
Sea-ice is an exclusive feature of polar ecosystems and displays major structuring and insulating functions (Comiso et al. 2008; Muckenhuber et al. 2016). Sea ice comes in a variety of types. The structure of the sea ice depends mainly on its stage of development as well as the ambient meteorological and atmospheric conditions. Sea ice types include: new ice, young ice, first-year ice and old ice (second year and multiyear sea ice). Old ice is the most robust type of sea ice, established after at least one year surviving over the summer melting season. Other sea ice types are less than a year-old sea ice with respective thickness and morphological features. Fast ice is defined as sea-ice that is attached to the coastline while other sea ice forms are drifting, afloat at the surface of the water. The drifting patterns of afloat sea-ice forms are dependent on arctic oceanic currents (Sakshaug, Johnsen, and Kovacs 2011). Arctic sea ice drift patterns are presumably key biological processes for the distribution of several ice-related species across the Arctic ocean and have a huge impact on marine productivity (Sakshaug, Johnsen, and Kovacs 2011). Typically, bare sea-ice is characterized by a high albedo up to 0.7 (National Snow and Ice Data Center 2016). This key insulating physical property gives rise to the development of characteristic low-temperature across the Arctic and to its specific polar climate (Michon and Hansen 2016). Incidentally, a gradient of temperature spanning from the equator to the Arctic promote global atmospheric & oceanic circulations. Furthermore, Sea-ice has a great structuring role across the Arctic seafront, shaping the morphology of the littoral (erosion, ice scouring etc…) and producing specific conditions for the development of sea-ice related communities.
As a result of climate change, over the last decade arctic sea ice has shown dramatic signs of retreat (Comiso et al. 2008). Due to the later freeze-up and earlier melting of the ice, the ice season has been markedly shortened over the past years (Meier et al. 2014). A study carried out in 2008 by Drobot at al. registered the extent annual fluctuation of the Arctic sea ice cover. The annual sea ice cover was reported to range from a minimum of approximately 5 million km2 to a maximum extent of approximately 14 million km2 (Drobot et al. 2008). In September 2012, sea ice extent was reported to set a new lowest minimum extent record (Beitler, J. 2012). The new record loss totalled to 3.41 million km2 below the 1981 to 2010 Arctic sea ice minimum average according to the National Snow & Ice Data Centre (Beitler, J. 2012). This decline is magnifying the warming up in the Arctic through the Arctic amplification positive feedback phenomenon. The effect of climate change on the arctic cryosphere is predicted to increment progressively over the next 100 years, promising fundamental ecological, physical, social, and economic changes (Serreze and Francis 2006).
4. Geoscience of Svalbard
At mid-distance between Norway and the North Pole, between the latitudes 74º - 81º N, and longitudes 10º - 35º E, is located Svalbard. Svalbard is an archipelago system with a rich geological history comprising several islands and skerries, of which the main ones are: Spitsbergen, Nordaustlandet, Barentsøya, Edgeøya, Kong Karls Land, Prins Karls Forland, and Bjørnøya (Ingólfsson 2000). The present landscape of Svalbard
9 originates from a long and complex geological history, going as far back in time as the late Archean era, about 42.5 billion years ago (Dallman et al. 2015).
A disparate assemblage of bedrock types composes Svalbard’s heterogenous geology including sedimentary, metamorphic and igneous rock types (Dallman et al. 2015) (Figure I-6). Long-term continental displacements have driven the gradual and heterogenous stratigraphic depositions responsible for Svalbard’s present geology. Overtime, Svalbard’s unique geological architecture was formed by the accumulation of large deposits deriving from various climate zones (Dallman et al. 2015). Extensive tectonic processes like uplift and subsidence, deposition and erosion, have progressively led to Svalbard’s present geographical situation (Dallman et al. 2015; Elvevold, Dallmann, and Blomeier 2007)
Svalbard’s chronostratigraphic succession is usually subdivided into three major components: The Basement (Precambrian and lower Palaeozoic), Sedimentary rocks (Devonian to Tertiary), and recent unconsolidated deposits (Quaternary) (Elvevold, Dallmann, and Blomeier 2007). The oldest metamorphic formation is described as “the Basement”. This geological stratum spans large patchy areas across the north of the Archipelago encompassing parts of Wijdefjorden, Hinlopenstretet and further east in Nordaustlandet and across Spitsbergen forming a peripheral belt along the west littoral (Dallman et al. 2015). Amongst these three major geological components, recent unconsolidated deposits are mainly responsible for the majority of Svalbard’s present geological formations (Dallman et al. 2015; Ingólfsson 2000).
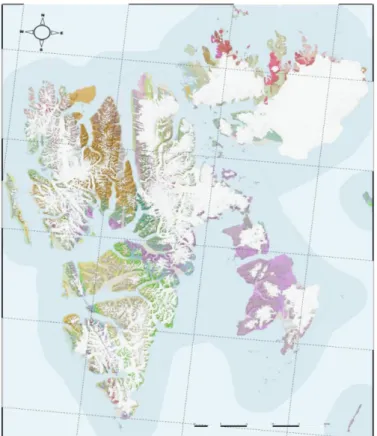
Figure I-6 Geological Map of Svalbard. Color legends: see annex. (QGIS 3.0) (QGIS Development Team 2018)
10 It is only from the onset of the Cretaceous period that Svalbard locates within the polar circle (Dallman et al. 2015). In the course of the Quaternary, Svalbard’s landscapes withstood several major episodes of glaciation (Elvevold, Dallmann, and Blomeier 2007; Dallman et al. 2015). Geological and cryogenic processes responsible for Svalbard’s unique geology are profoundly linked to these major glaciation events (Dallman et al. 2015). Svalbard’s unique geology was gradually shaped over a relatively long-timescale by the successive episodes of glaciation/deglaciation which produced the diversity of geological features, including: mountains, valleys, cirques, horns, arêtes, glaciated fjords, bays, beach terraces and beach ridges, we observe today (Ingólfsson 2000; Elvevold, Dallmann, and Blomeier 2007; Dallman et al. 2015).
Regarding Svalbard’s coastline in particular, long periods of deglaciation have progressively induced the erosion of the littoral. The gradual erosion of coastal areas eventually produced the variety of raised beaches, postglacial marine terraces and fjord-systems (Elvevold, Dallmann, and Blomeier 2007).
5. Svalbard climatic conditions
The climate experienced in Svalbard is referred as polar climate. Polar climate zones occupy the utmost regions on Earth. These regions are typically characterized by very large inter-annual differences in mean precipitation and temperatures and huge seasonal solar intensity variations (Popova et al. 2010; Sakshaug, Johnsen, and Kovacs 2011). As we previously mentioned in the paragraph Arctic light regime and polar day length, a long season of darkness with cold temperatures and strong winds occurs in winter known as polar night, while in spring-summer a short light season with mild temperatures referred to as midnight sun is experienced. In the vicinity of Longyearbyen, in Svalbard, the average annual air temperature is about – 6°C at sea level (Sakshaug, Johnsen, and Kovacs 2011). Lower temperatures are experienced at higher latitudes further north toward the high Arctic (Sakshaug, Johnsen, and Kovacs 2011). Throughout the Arctic, the total precipitations are amongst the lowest experienced worldwide with snow as the dominant form of precipitation, making up to half of the total precipitation (Stein et al. 2004).
6. Arctic microphytobenthos
The microphytobenthos represents this complex community of microscopic organisms inhabiting the surface layer of illuminated seafloor in aquatic ecosystems (Macintyre and Cullen 1996; Miller, Geider, and MacIntyre 1996). Microphytobenthic organisms are major biotic components of aquatic ecosystems. They play a central ecological role in coastal environment, primarily as a major food supply for higher trophic levels, but also by mediating water-sediment nutrient exchanges and by enhancing benthic-pelagic coupling in the water column (Sigmon and Cahoon 1997; Brandini et al. 2001; Facca, Sfriso, and Socal 2002; Glud et al. 2009). Furthermore, the cohesive nature of microscopic benthic communities has the ability to reduce considerably resuspension and erosion of the benthic seafloor (Williams, Yarish, and Gill 1985; Jiménez Reyes 2013). This process is known as biostabilisation and relies on the release of extracellular polymeric substances (EPS or “slime”) derived from the photosynthetic activity of benthic microphytes (Blanchard et al. 2000; De Brouwer and Stal 2001; Decho and Gutierrez 2017). In the arctic particularly, benthic microalgae
11 contribute significantly to the overall coastal productivity and typically exceed arctic pelagic productivity at shallow depths down to 30 m (Nelson et al. 1999).
6.1. Arctic microphytobenthos growth
Across the Arctic littoral, the biomass of coastal benthic communities exhibits huge spatial and annual variations (Sakshaug, Johnsen, and Kovacs 2011). One of the prevailing factors governing the occurrence and growth of the microphytobenthos is light availability. Other ecological factors add up for the regulation of the microphytobenthos across the Arctic seafloor. Arctic benthic microphytes are tightly dependent from regional oceanographic processes, atmospheric processes, seasonal nutrient admixtures, annual sea-ice distribution and sea-ice drift patterns (Rudels, Larsson, and Sehlstedt 2016; Slagstad, Wassmann, and Ellingsen, 2015). The texture, topography and organic content of the surface layer of the seafloor may also regulates the distribution of benthic microorganisms. This surface layer is extremely variable, affected periodically by strong physicochemical gradients due to the movement of tidal waters (Zacher et al. 2009). Arctic benthic microalgae typically display striking metabolic adaptations and resilient abilities allowing them to cope up with the extreme ecological variations occurring at the sediment-water interface of intertidal ecosystems (Zacher et al. 2009). Most benthic microalgae show indeed adaptive diurnal and tidal cycles adjusted with changing light conditions, tide cycles, desiccation, predation and resuspension (Paterson et al. 2011; Pushkareva et al. 2017). Arctic seasonal microphytobenthic variations in biomass typically exhibit a maximum during the spring and summer blooms and periods of low production (oligotrophy) in winter (Dalpadado et al. 2014). These maxima are believed to be triggered by enriched coastal nutrient concentration, increasing temperature and increasing day length coincident with coastal pelagic spring blooms. Consecutively, increased grazing pressure slows down microphytobenthic growth considerably. Toward the end of the summer season most microphytobenthic communities undergo changes in composition, coincident with variations in nutrient supplies potentially with the decrease in silicon concentration (Barranguet 1997).
6.2. Arctic microphytobenthic primary production
In the Arctic little is known on the productivity of coastal microphytobenthic communities mainly due to the logistic and technical limitations imposed by polar climatic constraints. Furthermore, in benthic tidal habitats productivity measurements may be erroneous and often are difficult to achieve due to large coastal disturbances (sea ice drifting, wind forcing, erosion, desiccation etc…). The major factors affecting the productivity of the microphytobenthos are light availability and local hydro-chemical parameters (salinity, temperature, nutrients, DIN/DIP ratio, etc…) (Longphuirt, Sorcha Ni Leynaert et al. 2007; Longphuirt et al. 2009; Vetrov and Romankevich 2004). The very first measurements of marine primary production in the Barents Sea date back to the end of the 1950s and focus mainly on the production of pelagic phytoplankton (Corlett 1953). More recent estimates were achieved by Dalpadado et al. in 2014, who estimated a mean annual net primary production for the Barents Sea of 59.0 Tg C year−1 (Dalpadado et al. 2014). They monitored the evolution of the marine primary productivity over 13 years from 1998 until 2011 in distinct areas of the Arctic Ocean. Overall, they concluded that the marine net primary production intrinsic to the Barents Sea
12 region is significantly increasing in recent years, from 41.6 Tg C in 1999 to 80.9 Tg C in 2011 (Dalpadado et al. 2014). Moreover, the mean annual net primary production of the Barents Sea was determined to derive from the combinatorial contributions of the Atlantic (53%) coastal (37%) and arctic regions (10%) altogether (Dalpadado et al. 2014). However, over the whole studied period the specific mean annual net primary production of coastal regions comes out on top (Dalpadado et al. 2014). It suggests the significance of the coastal primary production around Svalbard’s littoral as one of the highest across the Arctic Ocean and arctic coastal regions (Frey et al. 2017; Vetrov and Romankevich 2004). Arctic benthic microalgae contribute significantly to this coastal productivity (Nelson et al. 1999; Glud et al. 2009; Vetrov and Romankevich 2004). Even sometimes, when light availability is sufficient and nutrients are locally abundant, benthic primary production may even dominate the net coastal primary production at shallow depths (Gazeau et al. 2004).
6.3. Arctic microphytobenthic biodiversity
The arctic microphytobenthos represents a unique and complex community of microscopic organisms. These organisms selectively occupy the sediment surface of aquatic ecosystems where they are found on all types of substrates: rocks, logs, sand, soft sediments but also as epiphytes developing on macroalgae and aquatic plants (Ask, Rowe, and Brugel 2016). Various taxonomic groups develop across arctic microphytobenthic habitats and some of them distinctly predominate depending on the nature of the physical habitat and the local ecological parameters. Bacillariophyceae generally dominate microphytobenthic habitats but in certain conditions where microphytobenthic algal biofilms occur a few other groups can outcompete this previous class, notably: Cyanobacteria, Chlorophyceae, Haptophyceae and/or Dinophyceae (Nozaki, Misumi, and Kuroiwa 2003).
Microphytobenthic communities often develop as extensive microbial biofilms on top of the sediment. These benthic microbial biofilms generally exhibit a characteristically flat unstructured two-dimensional arrangement (D. C. Miller, Geider, and MacIntyre 1996). Given the large number and dynamic set of environmental variables operating at the arctic coastal interface, there are large inter-annual and spatial variations in the composition of coastal arctic communities, including microphytobenthic communities (Sakshaug, Johnsen, and Kovacs 2011). The composition of microbenthic communities is all the more dynamic as there is a very tight and complex relationship with the pelagic zone. Indeed, there is a very subtle line between pelagic and benthic communities since transfers are known to take place across the water column, notably due to resuspension and sedimentation processes (de Jonge 1995; Aberle-Malzahn 2004). The composition, distribution and abundance of coastal benthic biota is strongly dependant on the local environmental, physicochemical conditions (Water temperature, hydrochemistry, salinity, nutrients supply, hydrodynamic, substrate type etc…) and inter-species biological interactions (Stein et al. 2004). While some species show a strong affinity for hard substrata, others prefer soft sediment substrates such as in mudflat habitats. For instance, the brown alga Chordaria sp., the green alga Ulotrix sp. and the pennate diatoms Navicula sp. found across the littoral of Svalbard, have been reported to typically grow on sheltered beaches
13 with hard substrates (Sakshaug, Johnsen, and Kovacs 2011). Vaucheria sp. studied herein on the contrary, showed a strong affinity for soft sediments such as mud.
Despite large coastal disturbance (ice scouring, sea ice…) occurring along the Arctic littoral some algae have developed strategies to adapt. In the Arctic, coastal algae typically exhibit fast seasonal growing strategies, making them able to colonise coastal denuded substratum in less than 15 days (Sakshaug, Johnsen, and Kovacs 2011). Other species tend to grow heterotrophically in winter surviving on nutrient stocks accumulated over previous favourable growing seasons (e.g. Acrosiphonia sp. and Spongomorpha sp) (Sakshaug, Johnsen, and Kovacs 2011). To our knowledge, there has been to this date little study on the seasonal dynamics of arctic microphytobenthic communities. This scarce knowledge is greatly hindering our understanding of arctic coastal ecosystems and must be mended.
7. Vaucheria sp. – yellow-green alga
Vaucheria sp. is a xantophycean algae, of the family Vaucheriaceae. The genus Vaucheria was first described in the book “Histoire des conferves d’eau douce”, by the botanist J-P Vaucher in 1803. This genus
comprises to this date, about 70 species disseminated ubiquitously across all continents including Antarctica (Johnson et al. 2012; Guiry 2008). The most common species are the terrestrial species V. sissilis and the
freshwater species V. geminata (Guiry 2008). Most species are terrestrial and/or limnic with only a few marine and estuarine representatives, so far reported and described (Wilcox 2012; Johnson et al. 2012).
7.1 Morphology
These algae may develop with different morphologies depending on the environmental parameters and the species’ order such as motile unicells, coccoid, filamentous or motile colonial forms (Reddy 2001; Ott and Brown 1974). However, the most common form is filamentous, forming long cylindrical or siphonous yellow-green filaments (Elvebakk et al. 1996; Wilcox 2012; Johnson et al. 2012) (Figure I-7). The thallus of these algae is characterized by monopodial multinucleate tubular filaments and apical growth (Reddy 2001; Ott and Brown 1974). The algae are generally fixed to the substratum via a rhizoplast (rhizome) or holdfast (Reddy
Figure I-7 Microscopic picture of Vaucheria sp. filaments collected in the tidal flat adjoining Longyearbyen, Svalbard, 2017.
14 2001). Each filament is covered by a rigid thin cell wall made up of 2 layers (Ott and Brown 1974; Lee 2008). The outer layer of the cell wall is made up of pectose while the inner layer is made up of a combination of cellulose and pectin (Lee 2008; Ott and Brown 1974). The cytoplasm contains multiple peripheral discoid chloroplasts without pyrenoids and a large central vacuole surrounded by numerous nuclei (Coenocyte) (Reddy 2001; Lee 2008; Ott and Brown 1974). The vacuole is continuous throughout the length of the filament with very little cross-walls or septa formation (Reddy 2001; Ott and Brown 1974). Food supplies are stored as oil droplets in the cytoplasm (Ott and Brown 1974).
7.2. Reproduction and reproductive features
Reproduction in Vaucheria sp. comes in many ways: by vegetative fragmentation of the filaments, by asexual multi-flagellate motile zoospores, or by oogamous sexual reproduction (Reddy 2001; Lee 2008). Typically, the respective female and male reproductive organs are produced on nearby branches. The female reproductive organ, called oogonium, is spherical while the male reproductive organ (antheridium) is hook-alike in shape (The Editors of Encyclopaedia Britannica 2018; Reddy 2001). After fertilization of the egg, the zygote completes a resting phase before developing into a new alga. Out of these three, vegetative fragmentation is typically the most common mode of reproduction in Vaucheria sp. (Chapman, 1962). During this process, filaments break accidentally into small fragments each of which grows into a new functional plant (Reddy 2001; Lee 2008).
7.3. Distribution and habitat
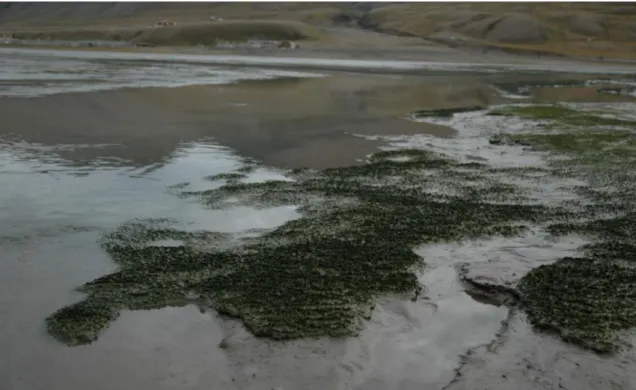
The algae are widespread in almost any wetland habitat such as mudflats, salt marshes, estuaries, wet farmlands, mangroves, streams, channels, lakes and pond fringes (Baker et al. 2012; The Editors of Encyclopaedia Britannica 2018) (Figure I-8). Vaucheria sp. typically manifests a remarkable physiological
Figure I-8 Picture of a dense biofilm of Vaucheria sp. microbenthic algae covering the seabed in Adventdalen-Adventfjorden tidal flat. Svalbard, 2017. Credit photo to Dr. Elster.
15 resilience to desiccation (The Editors of Encyclopaedia Britannica 2018). The Algae may be submergent, amphibious, semi-emergent, or terrestrial and was reported to colonize habitats from the sublittoral to the intertidal zone and beyond in terrestrial habitats (Wilcox 2012; Baker and et al. 2012). Estuarine and Marine representatives of Vaucheria sp. have been discovered and described in various manuscripts across Europe (Christensen 1987; Kersen 2012) as well as across North America (Schneider et al. 2014). However the occurrence of Marine Vaucheria sp. does not seem to appear in the literature on Svalbard’s coastal ecology (Elvebakk et al. 1996).
8. Objectives
The objective of this master thesis was primarily to characterise the abiotic environment intrinsic to this tidal flat and in which Vaucheria sp. occurs. We attempted to capture the environmental settings of Vaucheria sp. habitats at two different scales, by sites and to a larger extent by transects spanning across the tidal flat. This allowed us to accurately define the habitats of Vaucheria sp. with respect to local general abiotic parameters (salinity, temperature, sediment texture) as well as physico-chemical parameters from both the sediment and the water column. Incidentally, we could establish the abiotic profile of this arctic estuarine ecosystem, describing the temporal evolution of the local physico- and biogeochemical parameters characteristic of late summer arctic conditions (August 2017). Secondly, we attempted to measure the photosynthetic activity of this newly-discovered arctic marine Vaucheria sp. using a combination of gasometric and chlorophyll a fluorescence measurements.
The questions we attempted to answer were the following ones:
What are the characteristic abiotic parameters of this arctic tidal flat?
Which parameters defines Vaucheria sp. habitat? and how does Vaucheria sp. locally distribute?
Is Vaucheria sp. adapted to arctic late summer conditions?
What are the photosynthetic characteristics of Vaucheria sp.? Are these adapted to these specific arctic conditions?
We proposed to address this problem in this order:
- First, we characterised the physicochemical parameters inherent to this arctic estuarine ecosystem, in which Vaucheria sp. inhabits.
16
Chapter 2 – Ecology and photosynthetic activity of a newly-discovered
Vaucheria sp. dominated arctic microphytobenthos, Svalbard.
Material & Methods
Study area description
The Field sampling was performed in one locality on the western coast of Svalbard during august 2017. The total surface of Svalbard is about 61 020 km² with a coastline extending across 8 782 km (Lantuit et al. 2012). Across the full stretch of its territory, up to 60% of Svalbard is markedly influenced by snow and ice cover, affecting mainly northern and easternmost territories for eight to nine months year-round (Sakshaug, Johnsen, and Kovacs 2011). These territories feature the most extreme climatic conditions, hosting untouched wilderness over large protected areas. However, milder climatic conditions are experienced on the west coast of Svalbard due to the impact of warm atlantic currents mixing with arctic water masses and subsequently flowing along the west littoral.
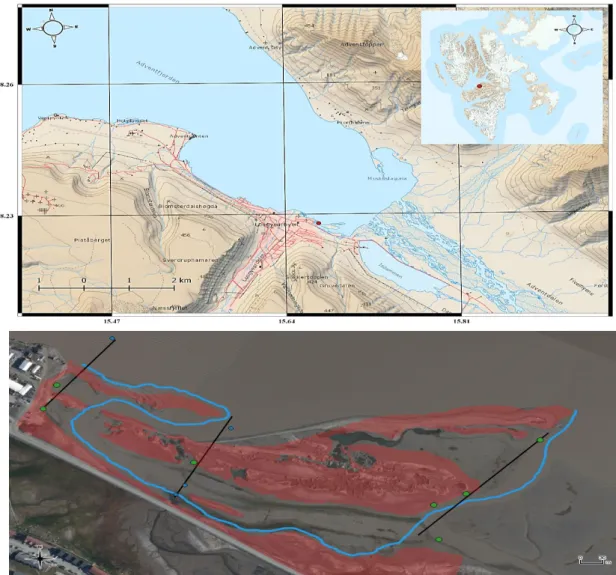
Figure II-1 Geographic location of the studied tidal flat, red dot = studied location (Upper map). Detailed map of the sampling area with transects I, II and III (Lower map). Sampling sites along the transect are numbered from one to four from bottom to top starting from TI.1. The red zone delimits the high tide front and in blue the low tide channel. Sampling sites in green refer to the presence of Vaucheria sp. (QGIS 3.0 + Google Earth pro) (QGIS Development Team 2018).
17 We observed across this tidal flat the presence of a newly-discovered Vaucheria sp. dominated microphytobenthos. The studied microphytobenthos occupied a tidal flat at the head of Adventfjorden within the larger fjord of Isfjorden, in central Spitsbergen. The field survey was performed over the month of August 2017, starting from the 9.8.17 and finishing on the 31.8.17. Around Svalbard, the annual sea-ice conditions are assumed to strongly influence marine coastal production, to a higher extent in particular years (Polyakov et al. 2017). The sea ice period in Isfjorden, generally starts between the end of November or mid-December and terminates between April - July (Muckenhuber et al. 2016). Over the past recent years ice-free conditions throughout winter in Isfjorden have become more and more frequent, with seasonal fast sea-ice occurring exceptionally (Muckenhuber et al. 2016). According to the Norwegian Meteorological Institute, Isfjorden has remained mostly ice-free since 2005. Throughout the duration of the field sampling, we did not report any influence of the sea ice on the studied microphytobenthos.
Sampling
The field sampling was achieved using several protocols expressed in HIMOM book of Protocols (Van Leeuwe, Morgan, and Brockmann 2005). The methods used for sampling were carefully carried out in respect with the requirements expressed in this manual. A total of three transects were defined across the tidal flat. A total of 11 sites were assayed along these transects and are illustrated on the map (Figure II-1) (QGIS Development Team 2018). The location of the transects and samples were specifically designed in the intention to embrace the scope of coastal influences acting on this tidal flat ecosystem. A comprehensive inventory of the physico-chemical parameters pertaining to this ecosystem was established. Nutrient supplies from the sediment and the overlying water were respectively and methodically quantified. Major cations, anions, nitrogen-based compounds, silica and phosphorus-based compounds were determined. The sediment was further analysed for organic carbon, and granulometry.
Data collection and analysis
Physical measurements
The temperature, pH and salinity profiles of the water column were determined using a low range pH/conductivity/TDS tester in combination with a refractometer for salinity measurements. Variations in the major four sea water ions mainly chloride, sulphate, sodium and magnesium accounted for the detected salinity by using the refractometer. Based on the TDS tester measurements, we calculated the consecutive sea water density (sigma-t). The ambient climatic conditions for the month of august 2017 including: PAR [μmol.m− 2 s− 1] and air temperatures were recorded using QTi datalogger (EMS Brno, Czech Republic). Furthermore, in situ air and seawater temperature were monitored in the close vicinity of Vaucheria sp. communities, respectively when unsubmerged during low tide or when submerged during high tide using Tie datalogger (EMS Brno, Czech Republic). The climatic data were taken from site TI.1 and were used to draw the overall climatic profile of the whole studied tidal flat ecosystem. Furthermore, the inter-tidal variations within the tidal flat were monitored and registered by time-lapse photography using two cameras (LTL-5310A, Acorn, China) and a graduated pole, throughout the duration of the field sampling.