Abstract — The Emergency Departments (ED) are a complex and important area of a hospital. With limited resources, it is mandatory to focus on efficiency. When hospitals are unable to deal with high demand, problems may rise leading to longer waiting times and more dissatisfaction. In this research, the authors extracted knowledge from a hospital ED, through data analysis and data mining, applying Random Forest and Naïve Bayes to study the ED patient waiting time and diseases.
Keywords — Big Data, Data mining, Emergency Department, Healthcare
I. INTRODUCTION
Emergency departments (ED) are an important and complex area of a hospital and are the major entry point to the healthcare system [1]. With the increase of life expectancy, population aging and bigger amount of health issues, ED tends to have greater demand [2]. If hospitals and more specifically, ED, are not ready, this will increase emergencies crowding, creating a problem to authorities and hospital management since resources are limited [2], and it can have consequences on patient length of stay, waiting times and consequently patient experience [3].
ED wait times are the second most referred theme regarding patient experience [4] which indicates that this area requires intervention to increase care quality and resource efficiency to achieve greater patient satisfaction. That can be achieved using Predictive Analytics (PA) which has the potential to improve the operational flexibility and throughput quality of ED services [5]. Waiting time prediction would help clinicians prioritize patients and adjust work flow to minimize time spent [6]. Big data refers large volumes of high velocity, complex and variable data that require advanced techniques and technologies to enable the capture, storage, distribution, management and analysis
Manuscript received March 2018; revised April 2018.
Filipe Gonçalves is a Master’s student from Instituto Universitário de Lisboa (ISCTE-IUL), ISTAR, Lisbon (e-mail: filipe_silva_gonçalves@iscte-iul.pt).
Ruben Pereira and Joao C. Ferreira are with Instituto Universitário de Lisboa (ISCTE-IUL), ISTAR, Lisbon, Portugal (e-mail: ruben.filipe.pereira@iscte-iul.pt and joao.carlos.ferreira@iscte.pt).
José Braga Vasconcelos is with Centro de Administração e Politicas Publicas (CAPP) da Universidade de Lisboa, and with Universidade Europeia, Laureate International Universities, Lisbon, Portugal (e-mail: jose.vasconcelos @universidadeeuropeia.pt).
Fernando Melo and Iria Velez are with Hospital Garcia da Horta (e-mail: ({fmelo,iria.velez}@hgo.min-saude.pt).
Of the information as stated in [7] based on a report delivered to the U.S Congress in 2012. Big data is complex due to its dimensions velocity, variety and volume [8], but in the healthcare industry, there is another important dimension, veracity [7]. Data on healthcare needs to be veracious so that the decisions can be as accurate as possible since sometimes those decisions can mean life or death of the patient. Some authors defend the inclusion of other dimensions like value [9], validity or volatility [10]. Big Data in healthcare can be overwhelming not only due to the volume dimension but also because of the variety of sources from where it is collected and the speed at what it must be managed [7]. Using this data, analytics can be performed, extracting knowledge by discovering and communicating patterns on that data [11], that would allow to know new diseases and treatments, predict treatment outcomes, support real-time decisions, control outbreaks, manage population health, etc. [9].
An example where big data analytics was applied with success is at the Johns Hopkins School of Medicine where Google Flu Trends data is used to predict sudden increases in flu-related emergency room visits earlier [7].
According to [11], one tactic that healthcare organizations should adopt is the more effective use of predictive analytics, which allows predicting future events or trends using retrospective and current data [12].
Grounded on the previous points, this research describes the application of data mining techniques with data collected from a Portuguese hospital. Analyzed data are strict to hospital’s ED. This research aimed to help hospital’s decision-makers to improve their service quality by giving them more insights into their waiting time and diseases behaviour regarding several dimensions forwardly identified. To study and predict ED waiting time, the authors applied Random Forest and Naïve Bayes algorithm.
The rest of this paper is organized into eight more sections: Related work, where projects in this area are reported; Work Methodology, that corresponds to the section where it is explained how the work developed during this research was organized; Hospital data, the explanation of the dataset attributes and its dimension; Privacy data anonymization, where sensitive data was anonymized due to privacy rules; Data pre-processing, where it is explained the data preparation for the data analysis and data mining; Data Analysis, where knowledge was extracted from the data; Data Mining where it is reported the applied algorithms and its results; Conclusions, where the final results of this research are analyzed.
II. RELATED WORK
The authors started by searching for big data in
Emergency Waiting Times Data Analysis
Filipe Gonçalves, Ruben Pereira, Joao C. Ferreira, José B. Vasconcelos, Fernando Melo and Iria Velez
E
IAENG International Journal of Computer Science, 45:3, IJCS_45_3_14
healthcare, analyzing predictive analytics applications. Later on, the focus shifted to articles studying the ED waiting time, to understand the factors which have the most influence on patient waiting time as well as the best data mining approaches.
A. Kankanhalli et al. [8], studied on how big data analytics can be applied in the healthcare industry, defending that it has three main characteristics: volume, velocity and variety. The authors claim that predictive analytics will be “the next revolution both in statistics and medicine around the world”.
W. Raghupathi and V. Raghupathi [7] also studied big data analytics in the healthcare industry adding a new characteristic for big healthcare data, veracity. They’ve studied some of the existent challenges like the new data sources and unstructured data and some of the possible benefits in areas like early detection of diseases, treatment outcome prediction or risk for medical complications. H. Asri et al. [9] defend that big data in healthcare has the same characteristics as described by W. Raghupathi and V. Raghupathi [7], adding value as a new characteristic. The authors studied the application of big data in healthcare, exploring some of the big data analytics challenges in healthcare like data sources, data quality and human resources needed to implement and manage big data analytics systems and how it can help patients, clinicians and researchers.
M. Ojha and K. Mathur [10] added two new characteristics to the idea of W. Raghupathi and V. Raghupathi [7], validity and volatility. They defined big data as “extremely large data sets that can be analyzed computationally to find patterns, trends, and associations, visualization, querying, information privacy and predictive analytics on large wide spread collection of data.” exploring the advantages and limitations of its usage.
Regarding predictive analytics, R. Chauhan and R. Jangade [13] claim that predictive analytics in healthcare can be beneficial as it would allow for patient disease prediction, fraud detection and cost management initiatives. That idea is also supported by A. T. Janke et al. [5] that studied predictive analytics implementation challenges and opportunities and how it could improve the ED patient flow.
Focusing on the ED waiting time, E. Bruballa et al. [2] created an agent-based simulation to study the patient length Of stay, considering it as “one of the most important problems for the management of the healthcare system worldwide”. They also defend that the existence of a recommendation system showing ED state information would help to avoid long waiting times for the services.
Other authors that defend the idea of providing patients with an expected waiting time were R. Ding et al. [14], that created a system to predict the length of stay in ED, claiming that it “might result in an increased patient satisfaction. Y. Sun et al. [6] defined waiting time as the “interval from triage end time to the physician’s consultation time” and considered that the patient flow rates of other acuity levels could impact on other levels since clinicians could move between queues. They developed a model to predict ED waiting time, based on triage information, the patient flow rate in the last hour, the day of the event, start time and end time of the triage and patient acuity as inputs for the model. One limitation is the fact that they ignored patient characteristics.
III. WORK METHODOLOGY
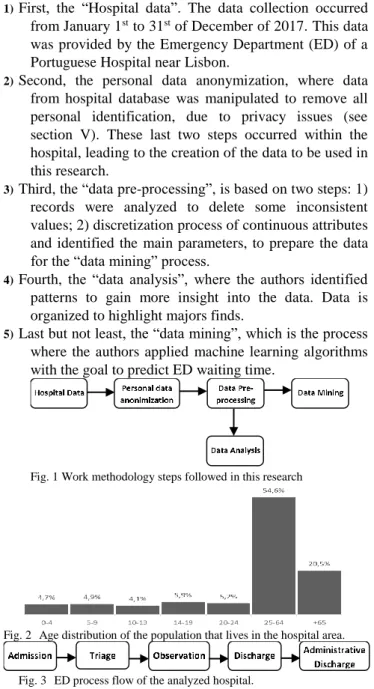
The work methodology of this research can be divided into five different sub-phases, as illustrated on Fig. 1.
1) First, the “Hospital data”. The data collection occurred from January 1st to 31st of December of 2017. This data was provided by the Emergency Department (ED) of a Portuguese Hospital near Lisbon.
2) Second, the personal data anonymization, where data from hospital database was manipulated to remove all personal identification, due to privacy issues (see section V). These last two steps occurred within the hospital, leading to the creation of the data to be used in this research.
3) Third, the “data pre-processing”, is based on two steps: 1) records were analyzed to delete some inconsistent values; 2) discretization process of continuous attributes and identified the main parameters, to prepare the data for the “data mining” process.
4) Fourth, the “data analysis”, where the authors identified patterns to gain more insight into the data. Data is organized to highlight majors finds.
5) Last but not least, the “data mining”, which is the process where the authors applied machine learningalgorithms with the goal to predict ED waiting time.
Fig. 1 Work methodology steps followed in this research
Fig. 2 Age distribution of the population that lives in the hospital area.
Fig. 3 ED process flow of the analyzed hospital.
IV. HOSPITAL DATA
As aforementioned, this data collection process occurred from January 1st to December 31st of 2017, in the ED of a Portuguese Hospital and stored in an SQL database.
This hospital is situated in a region, that according to the Portuguese Census 2011, has a population density of 2478.8/km², with 14.33% of the population is unemployed. Regarding age, 54% of the population has between 25 and 64 years old and 20.5% has over 65 years old Fig. 2.
Hospital’s ED process has five main steps. It starts with patient admission, which will lead to its triage, followed by an observation done by a doctor and ends with its discharge and the respective administrative discharge, Fig. 3. The patient discharge happens when a doctor, after evaluating the patient’s health, approves its release or transfer to another department or hospital, while the administrative discharge occurs when the patient effectively left the urgent care and all the necessary documentation for its discharge
IAENG International Journal of Computer Science, 45:3, IJCS_45_3_14
was reviewed and approved. The original dataset used in this research contains 108296 records, each one with 20 attributes in total, summarized in Fig. 4.
TABLEI
MANCHESTER TRIAGE PROTOCOL
Color Treatment Target time (minutes)
Red Immediate 0
Orange Very urgent 10
Yellow Urgent 60
Green Standard 120
Blue Non-urgent 240
The first ten attributes represent the dates (dd/MM/yyyy) and times (in the hh:mm:ss format) from each step of the previously mentioned ED process in Fig. 3 (Admission defined as D1 and T1, triage (T2 and D2), observation (T3 and D3), discharge (T4 and D4) and administrative discharge date and time, T5 and D5). The other attributes are the patient associated triage color (defined in Fig. 4 as TC), anonymized patient id, doctor and nurse id, ED department, discharge status, discharge destination, readmission, the International Classification of Diseases version 9 code (ICD) and its respective description (ICD description) for the observed patient disease (defined as D_CODE and D_DESC in Fig. 4, respectively). This code, managed by the World Health Organization (WHO), allows to classify and statistically analyze diseases, providing diagnostic codes and description for those diseases. These diseases are grouped into bigger categories according to its similarity, allowing to statistically analyze groups of similar disorders. The analyzed ED follows the Manchester Triage Protocol (MTP), which implies that patients will be categorized with one of five different triage colors: red (patients that need immediate care), orange (very urgent cases), yellow (urgent patients), green (standard patient situation) and blue (non-urgent patients). The MTP also defines the recommended time limit for the patients to be taken care of based on the given triage colour, Table I.
V. PERSONAL DATA ANONYMIZATION
Data from the hospital database was manipulated to remove all personal identification, like patients and doctor name changes, to the numerical field and the original relation was encrypted in a separated database to handle privacy issues. The author's developed tools for Patient Controlled . Encryption (PCE), as an approach to handle privacy issues of patients. To provide external data access with every personal information of patient (e.g. name, address, email) and the doctor is encrypted and an Id is created for each doctor and each patient. Correlation of patientID to patient information or doctorID to the doctor is possible only based on the knowledge of a private key.
PCE uses standards encryption approach based on 1) RSA algorithm to handle key transfer process based on a digital signature adapted from [15]; 2) An encryption algorithm, for example, the AES, which takes the key generated by RSA algorithm and performs encryption for that file field or XML extracted; 3) A decryption algorithm that takes encrypted info and produces the decrypted file. After this process, the data collection was ready to be used in this research.
Fig. 4 Attributes used during this research
VI. DATA PRE-PROCESSING
In this step, the authors remove data inconsistent values and discretization process applied to continuous data attribute like data/time and waiting time.
After exporting the data to an excel file, the authors analyzed the dataset and manipulated the data, removing errors and inconsistent values, preparing it for the data analysis and data mining processes. This process started by the removal of the records that had inconsistent values. Using Microsoft Excel 2016, null or empty field (blank) filters were applied to dates (Dx) and times (Tx) on Fig. 3. This allowed to find and remove data records that had empty or null attributes (inconsistent values), which could not be used for data mining, resulting in the removal of around 1% of the data.
Then, the authors proceeded with the analysis of the ICD code and ICD description attributes of the data. The ICD is a system, assembled by the World Health Organization (WHO), that groups diseases and symptoms, producing disease codes (ICD codes), defining a standard that allows to statistically study the diseases, facilitating storage, data sharing and analysis, being the “diagnostic classification standard for all clinical and research purposes”[16]. In this dataset, 17940 records didn’t have an associated ICD code or description, as those field attributes were empty. The authors also removed these records, to be able to calculate the disease category. This operation resulted in the reduction of 16.73% of the data.
This was important for the next step of the data pre-processing which was the calculation of new attributes. The authors created a new field, the ICD9 disease category (defined in Fig. 4 as D_CAT), using the excel’s vlookup function and a table containing the ICD version 9
IAENG International Journal of Computer Science, 45:3, IJCS_45_3_14
classification table, allowing to match the ICD9 code attribute to the correspondent ICD9 disease category, the new field.
Then, using excel’s weekday function, the day of the week where the event took place was calculated, based on the admission date attribute.
The authors also calculated a new field (absent from the initial dataset) representing the time that the patient waited to be observed by a doctor, the ED waiting time. The authors considered as waiting time, the time spent from admission (first stage of the ED process) (T1 in Fig. 4) to the patient’s first observation (third stage of the ED process) (T3 in Fig. 4), so to calculate it, the authors subtracted the admission time (T1 from Fig. 4) from the first observation time (T3 from Fig. 4) (T3-T1 from Fig. 4). This attribute was calculated as one of the goals of this research is to study the ED patient waiting time. Some of these calculated waiting times became inconsistent, because on this dataset, some of the patient first observation times (third process in Fig. 3) were smaller than the respective patient admission time (first process in Fig. 3), meaning that the patient was first observed, before being admitted to ED, which does not respect the ED flow reported in Fig. 3. This led to a negative inconsistent waiting time. Therefore, these inconsistent records were also removed.
Then, using R and R-Studio, with the cut function, the patient admission time (T1 according to Fig. 4) (time when the patient was admitted to the ED, the first stage of the ED flow reported on Fig. 3) was discretized on five different classes to represent the period of the day where the event took place, based on the admission hour. The cut function generated equal length intervals, meaning that all the different generated classes have the same number of events according to the range of values of the input variable. This function uses the range of values and not the number of events to calculate the classes, which means that the generated classes won’t have the same number of records per class, since for a certain hour (for example, 19:21:35), there can be several admissions (for example, there is more than one patient admitted in the ED at 19:21:35 on the whole dataset). The authors chose to discretize this attribute on five different classes, as a commitment between knowledge extraction and prediction efficiency. With a larger amount of classes, the analysis could be more precise, but it would affect the prediction efficiency of the algorithms that will be performed on section VIII (Data Mining).
The first class/period ranges between 00:00:01h to 08:43:10h. The second class from 8:43:11h to 12:09:09h. The third class starts at 12:09:10 and ends at 15:41:16h. The fourth class includes the events that took place between 15:41:17h and 19:27:47h. Finally, the last class ranges from 19:27:48h to 24:00:00h. On Fig. 4, it is possible to see the percentage of events per period of the day class.
Another attribute that was discretized was the ED waiting time. It was also discretized using the cut function from R, slicing the waiting time in five different classes. As stated before, the number of classes was chosen as a commitment to analysis and data mining efficiency. The first one ranges start at 00:00:00h and ends at 00:51:09h. The second one goes from 00:51:10h to 1:41:50h. The third class ranges
from 1:41:51h to 2:35:26h. The fourth class corresponds to the events from 2:35:27h to 3:47:08h. The fifth and last class starts at 3:47:09h and ends at 21:39:41h (maximum value for patient waiting time in the dataset).
The Fig. 5 represents all the original data set attributes and the new calculated fields.
VII. DATA ANALYSIS
After preparing the data, the authors statistically analyzed it, trying to identify patterns to describe the data in a high-level manner and study some of the most important fields according to the hospital’s interests, like periods of the day, disease categories or waiting times, which were discretized on the previous section.
Fig. 5 Percentadge number of events per period of the day class
By analyzing the period of the day of patients’ admission, the authors realized that, even though all the classes should have the same number of events, some classes had a bigger range than others, which means that those classes should correspond to the hours of less attendance. On the contrary, the classes with shorter range are associated with the hours of more attendance. As previously stated, the first class of the period of the day for the patient admission ranges from 00:00:00h to 08:43:10h, making it the longest class of the periods of the day for patient admission attribute. On the other hand, the class with the smallest range is the second one, which covers the events that happened for a total of 3:25:58h (from 08:43:11h to 12:09:09h). The third class also has a short coverage, 3:32:06 h (from 12:09:10h to 15:41:16). For the first class, the longest one, the most common triage colour (based on the MTP) is yellow (43.86%), followed by the green category (34.72%). For the second class, the one that has the smallest range, the most common triage colour is green (45.08%). These two triage colours, green and red, are the most common, independently of the period of the day, since when considering all the five different periods combined, these two categories cover a total of 80.18% of all data entries
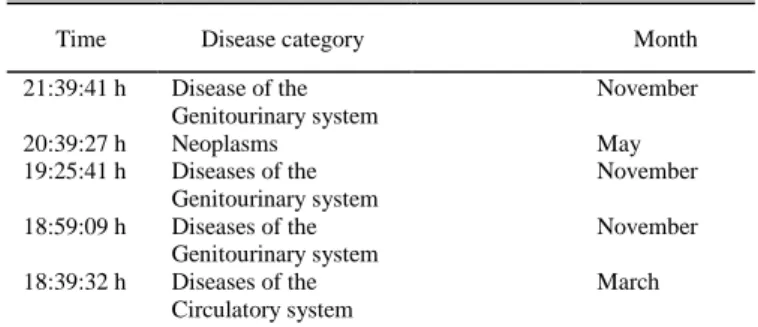
TABLEII TOP FIVE LONGEST EVENTS
Time Disease category Month Weekday
21:39:41 h Disease of the Genitourinary system
November Tuesday
20:39:27 h Neoplasms May Friday
19:25:41 h Diseases of the Genitourinary system November Thursday 18:59:09 h Diseases of the Genitourinary system November Thursday 18:39:32 h Diseases of the Circulatory system March Thursday
IAENG International Journal of Computer Science, 45:3, IJCS_45_3_14
By analyzing the distribution of the period of the day for patient admission by the day of the week, the second and third classes are the most frequent ones during the whole week, except for the weekend, where the events are similarly distributed through all the periods of the day (except for the first period on Saturday, which has a smaller number of events when compared with the other periods).
Regarding the ED waiting times, as expected, the first class of waiting times is the most frequent on every period of the day and the following classes of waiting time are less frequent.
About the waiting time's classes distribution through triage colours, the first classes of waiting times are more frequent for the most urgent related triage colours. For example, for the most urgent triage colour, the first category of waiting times covers 91.41% of the events, which means that the most urgent cases got medical attention within the first 51 minutes. The first and second categories for waiting times are the most frequent on all triage colours, even though for the less urgent situations, correspondent to the triage colours green and blue, the latter waiting time categories associated with longer waiting times, are more frequent when compared with the most urgent situations. This was another expected fact since the MTP advises that the most urgent cases have higher priority.
The maximum waiting time on this dataset is 21:39:41h. It fits on the fifth class of waiting time, during November, on a Tuesday and the fourth-class correspondent to the period of the day for patient admission (15:41:17 to 19:27:47). This patient suffered from a Disease of the Genitourinary System. The five longest events presented on the analyzed dataset are described in Table II.
Regarding the average waiting time per disease ICD9 category, the longest one is “Congenital anomalies”, where the average waiting time is 2:28:36h. The list of the top five disease categories with the longest average waiting time is listed in Table III.
By analyzing the average waiting time for each month, May is the month with the lowest average waiting time, 1:04:19h, having 312 doctors working on that month, taking care of 6136 patients. On the other hand, the month of December is the month with the longest average waiting time, 1:34:00, even though the ratio of patients and doctors is similar to May, 300 doctors for 6197 patients.
About the diseases, the most frequent disease category on this dataset is “Symptoms Signs and Ill-Defined Conditions” (22.13%), which is significative considering that there are in total 19 categories. The disease category with the least number of occurrences is “Certain Conditions Originating in the Perinatal period”.
By analyzing the distribution of the diseases per triage
colour, it is possible to conclude that for the most urgent triage colour, red, the most frequent disease category is “Diseases of the circulatory system”, with 28.44%. On the remaining triage colours, the most frequent disease category is “Symptoms, signs and ill-defined conditions”, apart from the blue triage colour category, the least urgent category, where the most frequent disease category is “Diseases of the nervous system and sense organs”, with 33.28%.
VIII. DATA MINING
In this section, after analyzing the available data, the authors applied data mining algorithms to the data, to predict the waiting time class attribute. To do this, the authors applied the Random Forest and Naïve Bayes algorithms, with R, using R-Studio. In both situations, it was used a proportion of 70% (63097 records) of the data set for training and 30% (27041 records) for testing. The authors used the “rminer” package from R, to compute some metrics and evaluate the algorithms performance. The following metrics were computed: accuracy, precision, true positive rate and F1-score. The inputs used in the algorithms were the triage colour, a period of the day where the patient was admitted, the disease category, weekday and month. The possible values for each one of these attributes are summarized in Table IV. The first algorithm to be applied was the Random Forest algorithm, with the goal to predict the ED wait time. Random Forest builds several decision trees and uses information from all of them to make a
TABLEIV
VALUES FOR EACH INPUT ATTRIBUTE
Attribute Possible values
Triage Color Red, orange; yellow; green; blue Period of the day 1 (00:00:01 – 08:43:10 h); 2 (08:43:11 – 12:09:09h); 3 (12:09:10 – 15:41:16h); 4 (15:41:17 – 19:27:47h); 5 (19:27:48 – 24:00:00h) Disease category
Infectious and parasitic diseases; Neoplasms; Endocrine, Nutritional and metabolic diseases and Immunity disorders; Diseases of the blood and blood-forming organs; Mental disorders; Diseases of the nervous system and sense organs; Diseases of the circulatory system; Diseases of the respiratory system; Diseases of the digestive system; Diseases of the Genitourinary system; Complications of pregnancy, childbirth and the puerperium; Diseases of the skin and subcutaneous tissue; Diseases of the musculoskeletal system and connective tissue; Congenital anomalies; Certain conditions originating in the perinatal period Symptoms, signs and ill-defined conditions; Injury and poisoning; Supplementary classification of factors influencing health status and contact with Health Services; Supplementary classification of external causes of injury and poisoning
Weekday Monday; Tuesday; Wednesday; Thursday; Friday; Saturday; Sunday
Month January; February; March; April; May; June; July; August; September; October; November; December
TABLEV RANDOM FOREST RESULTS
Waiting time class Precision True Positive Rate F1 Score
1 55.9 % 85.9 % 67.8 % 2 35.4 % 26.4 % 30.26 % 3 25.6 % 5.9 % 9.6 % 4 32.2 % 6.1 % 10.35 % 5 33.6 % 14.5 % 20.3 % TABLEIII
TOP FIVE DISEASE CATEGORY LONGEST AVERAGE WAITING TIMES
Disease Category Average waiting time Congenital anomalies 2:28:36 h
Diseases of the musculoskeletal system and connective tissue
1:30:22 h Infectious and parasitic diseases 1:28:22 h Supplementary classification of factors
influencing health status and contact with health service
1:27:51 h Diseases of the genitourinary system 1:27:26 h
IAENG International Journal of Computer Science, 45:3, IJCS_45_3_14
decision. It is better at avoiding overfitting when compared with decision trees because it creates small subsets of decision trees instead of a single denser and deeper decision tree.
To perform this, a new data cleansing process was performed, removing fields that should not be taken into account for the prediction. All the fields were removed except the ones that were used in waiting time prediction formula: day of the week, a period of the day for patient admission, month, triage colour, waiting for time class and disease category. An accuracy of 50.11% was achieved. Other metrics can be seen in Table V.
The first class of waiting time was the class that had achieved better results, being the only one that has over 50% on every measure (precision, true positive rate and f1-score). The third waiting time class was the one that had the worst results, with only 25.6% of precision, 5.9% true positive rate and 9.6% of F1-Score. This means that during the prediction this class was misclassified several times, making the true positive rate low, leading to a lower precision.
Then, the authors applied Naïve Bayes with the goal to compare metrics with the Random Forest’s results. Naïve Bayes, a probabilistic classifier, considers each predictor variable as independent and associates it to a conditional probability. It was applied to the same dataset and environment taking eight minutes of processing time. Achieved an accuracy of 48.2%.
By analysing the results of the Naïve Bayes algorithm, it is possible to conclude that it had the worst performance when compared with Random Forest. Not only it achieved a lower accuracy, but for the third, fourth and fifth waiting time categories the true positive rate and the f1-score was 0 or close to it (Table VI). On the fourth class, precision was 100%, while the true positive rate was 0%. This means that all predictions were negative.
IX. CONCLUSION
Several conclusions can be withdrawn from this research. The authors proposed to analyse and study the ED of a Portuguese Hospital. The focus was on disease and waiting time analysis, and these variables were compared through periods of the day for patient admission, the day of the week, month and triage colour (which is compliant with the MTP). Regarding the used algorithms, Random Forest was more accurate. On the other hand, Naïve Bayes presented some weak values given the same data. Such fact should be further explored, and more algorithms should be used. As expected, the most urgent cases were the ones with the smallest waiting times, respecting the MTP, that sets priorities for patient treatment according to the severity of its diseases at triage. Moreover, according to Table II, three out of the five longest episodes on the ED were related to diseases that fit on the “Diseases of the genitourinary system” category, all in November and two of them on
Thursday. Regarding diseases, congenital anomalies lead the top 5 longest average time by far. Almost 1 hour ahead of the second while the remaining differ few minutes among them.
The authors intend to improve results by increasing the dataset and relate it with external events like the weather conditions on the day of the event, allowing to understand the weather influence on patient affluence to the ED. Clinicians involvement in the patient treatment should also be explored relating it to larger or smaller waiting times.
ACKNOWLEDGE
. This work was supported by national funds through FCT (Fundação para a Ciência e Tecnologia) with references UID/MULTI/4466/2016.
REFERENCES
[1] Z. Liu, D. Rexachs, E. Luque, F. Epelde, and E. Cabrera, “Simulating the micro-level behaviour of the emergency department for macro-level features prediction,” in 2015 Winter
Simulation Conference (WSC), 2015, vol. 2016–February, pp.
171–182.
[2] E. Bruballa, A. Wong, F. Epelde, D. Rexachs, and E. Luque, “A model to predict the length of stay in a hospital emergency department and enable planning for non-critical patients admission,” Int. J. Integr. Care, vol. 16, no. 6, pp. 1–2, 2016. [3] M. Barad, T. Hadas, R. A. Yarom, and H. Weisman, “Emergency
department crowding,” in 19th IEEE International Conference on
Emerging Technologies and Factory Automation, ETFA 2014,
2014.
[4] J. D. Sonis, E. L. Aaronson, R. Y. Lee, L. L. Philpotts, and B. A. White, “Emergency Department Patient Experience,” J. Patient
Exp., p. 237437351773135, Sep. 2017.
[5] A. T. Janke, D. L. Overbeek, K. E. Kocher, and P. D. Levy, “Exploring the Potential of Predictive Analytics and Big Data in Emergency Care,” Ann. Emerg. Med., vol. 67, no. 2, pp. 227– 236, Feb. 2016.
[6] Y. Sun, K. L. Teow, B. H. Heng, C. K. Ooi, and S. Y. Tay, “Real-time prediction of waiting time in the emergency department, using quantile regression,” Ann. Emerg. Med., vol. 60, no. 3, pp. 299–308, Sep. 2012.
[7] W. Raghupathi and V. Raghupathi, “Big data analytics in healthcare: promise and potential,” Heal. Inf. Sci. Syst., vol. 2, no. 1, p. 3, 2014.
[8] A. Kankanhalli, J. Hahn, S. Tan, and G. Gao, “Big data and analytics in healthcare: Introduction to the special section,” Inf.
Syst. Front., vol. 18, no. 2, pp. 233–235, Apr. 2016.
[9] H. Asri, H. Mousannif, H. Al Moatassime, and T. Noel, “Big data in healthcare: Challenges and opportunities,” Proc. 2015 Int.
Conf. Cloud Comput. Technol. Appl. CloudTech 2015, 2015.
[10] M. Ojha and K. Mathur, “Proposed application of big data analytics in healthcare at Maharaja Yeshwantrao Hospital,” in
2016 3rd MEC International Conference on Big Data and Smart City (ICBDSC), 2016, pp. 1–7.
[11] D. W. Bates, S. Saria, L. Ohno-Machado, A. Shah, and G. Escobar, “Big data in health care: Using analytics to identify and manage high-risk and high-cost patients,” Health Aff., vol. 33, no. 7, pp. 1123–1131, 2014.
[12] I. D. Dinov, “Methodological challenges and analytic opportunities for modeling and interpreting Big Healthcare Data,”
Gigascience, vol. 5, no. 1, p. 12, Dec. 2016.
[13] R. Chauhan and R. Jangade, “A robust model for big healthcare data analytics,” in 2016 6th International Conference - Cloud
System and Big Data Engineering (Confluence), 2016, pp. 221–
225.
[14] R. Ding, M. L. McCarthy, J. Lee, J. S. Desmond, S. L. Zeger, and D. Aronsky, “Predicting Emergency Department Length of Stay Using Quantile Regression,” in 2009 International Conference on
Management and Service Science, 2009, vol. 45, no. 2, pp. 1–4.
[15] Cgi, “Public Key Encryption and Digital Signature : How do they work ?,” Reproduction, 2004.
[16] World Health Organization, “WHO| International Classification of Diseases,” WHO| International Classification of Diseases. [Online]. Available: http://www.who.int/classifications/icd/en/. [Accessed: 04-Mar-2018].
TABLEVI NAIVE BAYES RESULTS
Waiting time class Precision True Positive Rate F1 Score
1 51.5 % 90.5 % 65.7 %
2 31 % 18.3 % 23 %
3 10 % 0 % 0 %
4 100 % 0 % 0 %
5 32.4 % 0.9 % 1 %