Submitted 25 June 2015 Accepted 8 October 2015 Published29 October 2015
Corresponding author Tsung Fei Khang, tfkhang@um.edu.my
Academic editor Jaume Bacardit
Additional Information and Declarations can be found on page 16
DOI10.7717/peerj.1360
Copyright 2015 Khang and Lau
Distributed under
Creative Commons CC-BY 4.0
OPEN ACCESS
Getting the most out of RNA-seq data
analysis
Tsung Fei Khang1and Ching Yee Lau2
1Institute of Mathematical Sciences, University of Malaya, Kuala Lumpur, Malaysia 2Institute of Biological Sciences, University of Malaya, Kuala Lumpur, Malaysia
ABSTRACT
Background.A common research goal in transcriptome projects is to find genes that are differentially expressed in different phenotype classes. Biologists might wish to validate such gene candidates experimentally, or use them for downstream sys-tems biology analysis. Producing a coherent differential gene expression analysis from RNA-seq count data requires an understanding of how numerous sources of variation such as the replicate size, the hypothesized biological effect size, and the specific method for making differential expression calls interact. We believe an explicit demonstration of such interactions in real RNA-seq data sets is of practical interest to biologists.
Results.Using two large public RNA-seq data sets—one representing strong, and another mild, biological effect size—we simulated different replicate size scenarios, and tested the performance of several commonly-used methods for calling differentially expressed genes in each of them. We found that, when biological effect size was mild, RNA-seq experiments should focus on experimental validation of differentially expressed gene candidates. Importantly, at least triplicates must be used, and the differentially expressed genes should be called using methods with high positive predictive value (PPV), such as NOISeq or GFOLD. In contrast, when biological effect size was strong, differentially expressed genes mined from unreplicated experiments using NOISeq, ASC and GFOLD had between 30 to 50% mean PPV, an increase of more than 30-fold compared to the cases of mild biological effect size. Among methods with good PPV performance, having triplicates or more substantially improved mean PPV to over 90% for GFOLD, 60% for DESeq2, 50% for NOISeq, and 30% for edgeR. At a replicate size of six, we found DESeq2 and edgeR to be reasonable methods for calling differentially expressed genes at systems level analysis, as their PPV and sensitivity trade-offwere superior to the other methods’.
Subjects Bioinformatics, Computational Biology, Statistics
Keywords Biological effect size, Biological replicate size, Differential gene expression analysis, RNA-seq
INTRODUCTION
Elucidating key genes associated with variation between different biological states at the genomic level typically begins with the mining of high dimensional gene expression data for differentially expressed genes (DEG). For a long time, biologists have been using microarrays for gene expression studies, and over the years, the collective experience of the community has congealed into a set of best practices for mining microarray data (Allison et al., 2006). Hence, to determine optimal replicate size, one may use the SAM package (Tibshirani, 2006); to call DEG, the moderatedt-test (Smyth, 2005;Smyth, 2004) would be applied (Jeanmougin et al., 2014), producingp-values for each gene that adjust for multiple comparisons (Dudoit, Shaffer & Boldrick, 2014). Subsequently, joint consideration ofp-value and fold change (Xiao et al., 2014) allows the researcher to identify a set of DEG with strong potential to be validated by qPCR. Riding on such confidence, the researcher could further study functional enrichment to gain understanding of dysregulated biological processes, or generate network-based hypotheses for targeted intervention.
Despite the microarray’s analytical maturity, RNA-seq, which is based on next-generation sequencing technology—is set to become the method of choice for current and future gene expression studies (Wang, Gerstein & Snyder, 2009). In RNA-seq, direct transcript counting through mapping of short reads to the genome overcomes the problem of limited dynamic range caused by signal saturation in microarrays. In addition, the transcriptome can now be sequenced to unprecedented coverage, thus removing dependence on prior transcriptome knowledge which is crucial for probe design in microarrays. With the availability of numerousde novotranscriptome assembly tools (Li
et al., 2014), meaningful gene expression studies in non-model organisms can now be
done. While conceptually simple, RNA-seq requires the use of sophisticated algorithms to transform raw reads into the final gene counts. These algorithms constitute an important source of non-biological variation that must be appropriately accounted forOshlack,
Robinson & Young (2010), if the result is to be interpretable.
The limited availability of biological material, and the costs of data production and bioinformatic support, are the major limiting factors for replicate size in RNA-seq exper-iments. As a result, RNA-seq data sets with little or no biological replicates remain quite common today. In these type of data sets, statistical power to detect DEG is poor, and fur-ther deteriorates when the biological effect size is not strong. In fact, the problem may be-come worse from a multiple comparison point of view, as potentially many more genes are scored. Studies that aim at a systems level understanding using the list of DEG must there-fore prioritize large replicate sizes over sequencing depth (Rapaport et al., 2013). However, large RNA-seq experiments remain the exception, rather than the rule at the moment.
challenging due to lack of standard guidelines for experimental design, read processing, normalization and statistical analysis (Auer & Doerge, 2010;Auer, Srivastava & Doerge, 2012). Currently, there is a bewildering number of methods for calling DEG. Several recent studies compared the relative performance of various DEG call methods using simulated and also real RNA-seq data sets (eleven inSoneson & Delorenzi (2013); five
inGuo et al. (2013); eight inSeyednasrollah, Laiho & Elo (2015)). Recommendations
for method selection were offered. However, these studies did not explicitly consider variation of the performance of DEG call methods in the context biological effect size and unreplicated experiments, which are of practical concern to the biologist. It may not be an overstatement to say that, at present, how researchers pick a DEG call method out of the plethora of alternatives available is more guided by their degree of familiarity with the methodology literature, computing convenience and democratic evaluation of personal experiences in bioinformatics forums, rather than on empirical evidence.
Most DEG call methods are designed to address analysis of RNA-seq experiments that have biological replicates. A minority such as ASC (Wu et al., 2010), NOISeq (Tarazona et
al., 2011) and GFOLD (Feng et al., 2012) were initially designed for analysis of unreplicated
experiments, though the latter two could also handle replicated experiments. While unreplicated experiments are not suitable for reliable inference at the systems level, DEG mined using particular DEG call methods may nonetheless be useful for targeted study if their expression can be validated independently using qPCR. Such small incremental gains can be crucial to build up the ground work in preparation for more extensive study in non-model organisms. Our study aims to clarify the interaction between replicate size, biological effect size and DEG call method, so as to provide practical recommendations for RNA-seq data analysis that will help researchers get the most out of their RNA-seq experiments.
MATERIALS AND METHODS
Statistical methods for calling differentially expressed gene
A large number of DEG call methods have been proposed (Table 1), with the majority of them being parametric methods that make distributional assumption about the read count data. An exhaustive comparison of all available methods for the present study was not feasible, nor necessary, since the relative performance of various subsets of these methods have been investigated in several studies (Soneson & Delorenzi, 2013;Guo et al., 2013;Zhang
et al., 2014;Seyednasrollah, Laiho & Elo, 2015). As a result, less promising methods can be
omitted from comparison.
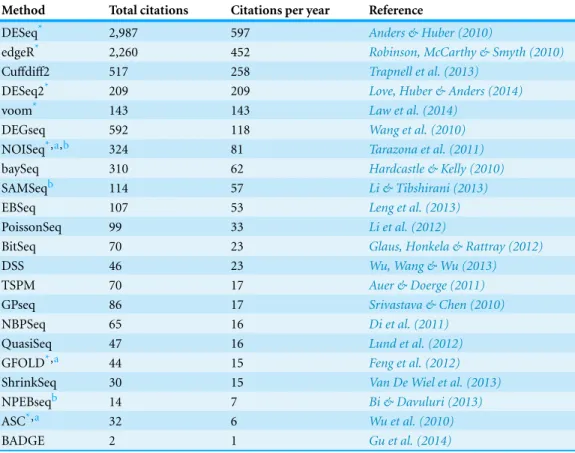
Table 1 Methods for calling differentially expressed genes in RNA-seq data analysis.Total citations were based on Google Scholar search result as of 22 September 2015, and normalized by number of years since formal publication. The methods were ranked according to their citations per year.
Method Total citations Citations per year Reference
DESeq* 2,987 597 Anders & Huber (2010)
edgeR* 2,260 452 Robinson, McCarthy & Smyth (2010)
Cuffdiff2 517 258 Trapnell et al. (2013)
DESeq2* 209 209 Love, Huber & Anders (2014)
voom* 143 143 Law et al. (2014)
DEGseq 592 118 Wang et al. (2010)
NOISeq*,a,b 324 81 Tarazona et al. (2011)
baySeq 310 62 Hardcastle & Kelly (2010)
SAMSeqb 114 57 Li & Tibshirani (2013)
EBSeq 107 53 Leng et al. (2013)
PoissonSeq 99 33 Li et al. (2012)
BitSeq 70 23 Glaus, Honkela & Rattray (2012)
DSS 46 23 Wu, Wang & Wu (2013)
TSPM 70 17 Auer & Doerge (2011)
GPseq 86 17 Srivastava & Chen (2010)
NBPSeq 65 16 Di et al. (2011)
QuasiSeq 47 16 Lund et al. (2012)
GFOLD*,a 44 15 Feng et al. (2012)
ShrinkSeq 30 15 Van De Wiel et al. (2013)
NPEBseqb 14 7 Bi & Davuluri (2013)
ASC*,a 32 6 Wu et al. (2010)
BADGE 2 1 Gu et al. (2014)
Notes.
*Methods included in the present study.
aMethods initially developed to analyze unreplicated RNA-seq data sets. bNon-parametric method.
Programming language: C/C++for GFOLD, Cuffdiff2 and BitSeq; Matlab for BADGE; R for the rest.
experiments with biological replicates, these methods were later modified to accommodate analysis of unreplicated experiments as well, but their performance relative to ASC, GFOLD and NOISeq remains unclear. We did not include two methods with high citations per year: Cuffdiff2 and DEGSeq, based on conclusions from recent method comparative analyses. For example, Cuffdiff2 was found to have very low precision when replicate size increased in the analysis of two large RNA-seq data sets from mouse and human (Seyednasrollah, Laiho & Elo, 2015). Furthermore,Zhang et al. (2014)showed that edgeR had slightly superior performance in the receiver operating characteristic curve compared to DESeq and Cuffdiff2. Another comparative study involving DESeq, DEGseq, edgeR, NBPSeq, TSPM and baySeq showed that DEGseq had the largest false positive rate among them (Guo et al., 2013).
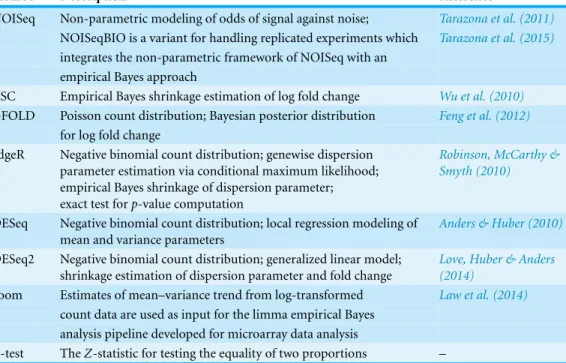
Table 2 Description of the core modeling strategy of differential gene expression analysis methods investigated in the present study.
Method Description Reference
NOISeq Non-parametric modeling of odds of signal against noise; Tarazona et al. (2011) NOISeqBIO is a variant for handling replicated experiments which Tarazona et al. (2015) integrates the non-parametric framework of NOISeq with an
empirical Bayes approach
ASC Empirical Bayes shrinkage estimation of log fold change Wu et al. (2010) GFOLD Poisson count distribution; Bayesian posterior distribution Feng et al. (2012)
for log fold change
edgeR Negative binomial count distribution; genewise dispersion parameter estimation via conditional maximum likelihood; empirical Bayes shrinkage of dispersion parameter; exact test forp-value computation
Robinson, McCarthy & Smyth (2010)
DESeq Negative binomial count distribution; local regression modeling of mean and variance parameters
Anders & Huber (2010)
DESeq2 Negative binomial count distribution; generalized linear model; shrinkage estimation of dispersion parameter and fold change
Love, Huber & Anders (2014)
voom Estimates of mean–variance trend from log-transformed Law et al. (2014) count data are used as input for the limma empirical Bayes
analysis pipeline developed for microarray data analysis
Z-test TheZ-statistic for testing the equality of two proportions –
(Smyth, 2004;Smyth, 2005) that has been used so successfully for detecting DEG in
microarray data analysis. Finally, theZ-test for equality of two proportions was included to set upper bounds in the tested performance metrics that are attainable by naive application of a common textbook statistical method. LetNijbe the pooled normalized read counts of theith gene in thejth phenotype class (j=1,2),N+j=iNijthe total normalized read counts in thejth phenotype class, andNi+=j=1,2Nijthe total normalized read counts of theith gene in all phenotype classes. Specifically, theZ-test statistic for theith gene is given by
Zi= ˆ pi1− ˆpi2
ˆ
pi(1− ˆpi)/N
,
wherepˆij =Nij/N+j,pˆi =Ni+/N, andNis the total number of normalized counts.
Table 2provides a description of the core modeling approaches of the eight methods
considered in the present study.
Criteria for differential expression
|x| ≥1 yields the inequalityy>2/|x|. Thus, genes that fell in the region defined byy>2/x were differentially up-regulated, and those in the region ofy>−2/xwere differentially down-regulated. The union of the sets of differentially up and down-regulated genes constituted the set of DEG candidates.
To handle analysis of unreplicated experiments in edgeR, we set the biological coefficient of variation (BCV) parameter as 0.4 for the Cheung data set (see details in ‘Benchmarking’), and 0.1 for the Bottomly data set, following recommendations inChen et
al. (2015). The exact test option was used to computep-values.
For NOISeq, we used the recommended criteria for calling DEG as described in the NOISeq documentation—q=0.9 for unreplicated experiments, andq=0.95 for experiments with biological replicates. For ASC, genes that had log2 fold change above 1 or−1, and posterior probability 99% or more were declared to be differentially expressed. For GFOLD, we used the default significant cut-offof 0.01. A gene with GFOLD value of 1 or larger was considered differentially up-regulated, and differentially down-regulated if GFOLD value was−1 or smaller. Except GFOLD, which is written in the C/C++language and requires the Linux platform, the other methods were executed in R version 3.1.3 (R
Core Team, 2015).
Benchmarking
Data sets
To set up our benchmarking exercise, we needed two RNA-seq data sets whereby variation in their phenotype classes produced mild and strong biological effect sizes in the tissue of interest, respectively. We further required the RNA-seq data sets to have fairly large replicate sizes to enable the simulation of different replicate size scenarios. To this end, we identified two suitable RNA-seq data sets in the Recount database (Frazee, Langmead
& Leek, 2011). The latter contains unnormalized RNA-seq count data sets from 18 major
studies that have been assembled from raw reads using the Myrna (Langmead, Hansen &
Leek, 2010) pipeline.
The Bottomly data set (Bottomly et al., 2011) consists of gene expression data (22 million Illumina reads per sample, read length of∼30 bases) obtained from the brain striatum tissues of two mice strains: C57BL/6J (n=10) and DBA/2J (n=11). Both mice strains are known to show large, strain-specific variation in neurological response when subjected to opiate drug treatment (Korostynski et al., 2006;Korostynski et al., 2007;Grice et al., 2007).
The Cheung data set (Cheung et al., 2010) consists of gene expression data (40 million Illumina reads per sample, read length of 50 bases) from immortalized human B-cells of 24 males and 17 females. Sex hormones are known to modulate B cell function (Klein,
2000;Verthelyi, 2001). For example, estrogen modulates B cell apoptosis and
activa-tion (Grimaldi et al., 2002), while testosterone suppresses immunoglobulin production by B cells (Kanda, Tsuchida & Tamaki, 1996). In the absence of antigenic challenge, however, it seems reasonable to expect only a modest number of DEG in male and female B cells.
count table contained 12,410 transcripts, down from 52,580. Prior to analysis, the count data were normalized using DESeq normalization (Anders & Huber, 2010), which has been shown to be robust to library size and composition variation (Dillies et al., 2013). However, raw counts were used for DESeq2 analysis since the method explicitly requires such type of data as input.
Method for constructing a reliable reference DEG set
The construction of a reliable reference DEG set from which performance metrics for each method is evaluated is a non-trivial problem, if one eschews a simulation-based approach. To avoid circular reasoning, this reference set needs external validation from independent evidence such as confirmation from qPCR results.
Here, we chose voom (Law et al., 2014;Ritchie et al., 2015) as the method of choice for setting the reference DEG set. Unlike other DEG methods that primarily model mean–variance relationships in the count data using discrete distributions such as the Poisson or negative binomial distributions, voom log-transforms count data into a microarray-like data type suitable for analysis using the robust limma pipeline (Smyth,
2004;Ritchie et al., 2015). Because of this, using voom to set the reference DEG set can
avoid biasing results of the called DEG due to algorithmic similarities. A gene was defined as differentially expressed using the same joint filtering criteria for edgeR, DESeq, DESeq2 andZ-test. We found the nonparametric SAMSeq (Li & Tibshirani, 2013), which has also been reported to have strong DEG mining performance, unsuitable for setting the reference DEG set as it returned different DEG sets for different random seeds and number of permutation parameters (Fig. S1).
The validity of voom as a tool for constructing reasonablein silicoreference DEG sets for the Bottomly and Cheung data set requires justification. To this end, we compared its performance with other DEG call methods on an RNA-seq data set in which qPCR validation results for sufficiently large numbers of genes are available. Briefly, the Rajkumar data set (Rajkumar et al., 2015) consists of gene expression count data (26,119 genes; minimum of 10 million Illumina reads per sample, read length of∼50 bases) from the amygdala tissues of C57BL/6NTac strain mice. There are two phenotype classes: wild type (n=8), and heterozygotes for theBrd1gene deletion (n=8). A total of 115 genes were selected for qPCR validation (additional Table 5 inRajkumar et al., 2015); differential expression was observed in 60 of them, and not in the remaining 55. Each DEG call method returnsNgdifferentially expressed gene candidates. We considered a method to be sound for setting the reference DEG set if it did not return too few (tens) or too many (thousands) candidates. Among methods that satisfied this criterion, the one that had relatively higher positive predictive value (PPV; the complement of the false discovery rate) would be preferred. LetNTPbe the number of true positives, andNFPthe number of false positives. Then the number of DEG that lack validation result isU=Ng−NFP−NTP. IfU is not too large or too small, then the expected number of true positives can be estimated as
NTP∗ =NTP+
NTP
NTP+NFP
a) b)
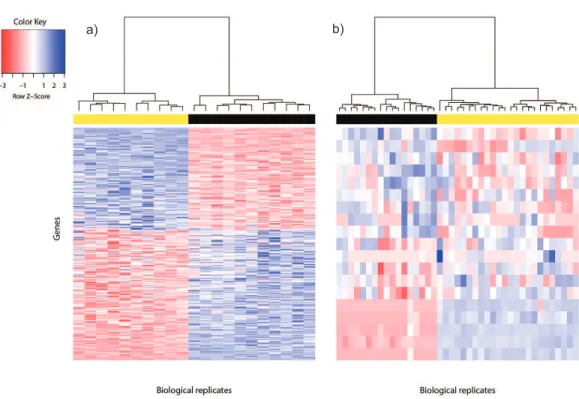
Figure 1 Heat map of differentially expressed genes in (A) Bottomly data set (362 DEG) and (B) Cheung data set (19 DEG).Phenotype class legend: (A) Black for DBA/2J strain (n=11); yellow for C57BL/6J strain (n=10). (B) Black for female (n=17); yellow for male (n=24). The heat maps were made using thegplots(Warnes et al., 2014) R package. Pairwise sample distances were estimated using the Euclidean distance and sample clustering was done using the Ward algorithm. The DEG were sorted based on the magnitude and sign of theirt-statistic.
The expected PPV is therefore given by
PPV∗= NTP+N ∗ TP
Ng
.
Characteristics of constructed reference DEG sets
Ideally, thein silicoreference DEG set called using voom for the two test data sets should be independently validated using qPCR, but evidence at such level may not always be available. Where microarray data are available for the same study, a DEG candidate can be considered reliable if it is called in both RNA-seq and microarray analyses, since fold change of DEG from the latter has been found to correlate strongly with fold change from qPCR (Wang et al., 2014). A total of 362 DEG for the Bottomly data set were thus called (Fig. 1A). About 88% (320/362) of the DEG for the Bottomly data called using voom were identical with those called inBottomly et al. (2011)using edgeR (1,727 DEG). Approximately two fifths of them (153/362) were detected using limma applied on Affymetrix or Illumina microarray expression data (Table S1).
chromosomes, or interacted with at least one gene product from the sex chromosomes were used to construct the reference DEG set. This strategy resulted in a set of 19 DEG (Fig. 1B). Five of them were located on the Y chromosome, three on the X chromosome and the remainder had known gene-gene interactions with at least one gene located on sex chro-mosomes (based on BioGRID (Stark et al., 2006;Chatr-Aryamontri et al., 2015);Table S2).
Differentially expressed genes are characterized by between-phenotype variation that is significantly larger than within-phenotype variation. However, occasionally some genes may be wrongly declared as differentially expressed because some outliers within a phenotype class were sufficiently extreme to cause relatively large between-phenotype variation. To assess the quality of DEG called using voom, we used the Bland-Altman plot (Bland & Altman, 1986;Fig. S2). Among the 362 DEG called for the Bottomly data set, the majority of DEG showed good agreement of replicate variation between the two phenotype classes—about 88% (318/362) were within 2SD (standard deviation) from perfect agreement, and about 95% (345/362) were within 3SD. Similarly, among the 19 DEG called for the Cheung data set, within-phenotype variation difference was within 2SD from perfect agreement for about 74% (14/19) of DEG, and within 3SD for about 84% (16/19) of DEG. Generally, genes that showed large within-phenotype variation in both phenotypes were not called by voom.
Once the DEG set had been constructed for the Bottomly and Cheung sets, it became possible to operationally define what we meant by mild or strong biological effect size. For theith differentially expressed gene, define
Ti2= (X¯i,1− ¯Xi,2) 2
S2i,1/n1+S2i,2/n2,
whereiindexes the genes, andjthe phenotype classes (j=1,2);X¯i,jandS2i,jare the mean and variance of normalized read counts respectively, andnjare the replicate sizes. Thus,
T2is essentially the square of thet-statistic, which measures the magnitude of squared deviation between mean counts in two different phenotype classes relative to the latters’ variances. By definition, the median values ofT2should be large in a data set that shows strong biological effect size, and vice versa. For the Bottomly data set (strong effect size), medianT2was 27.6; for the Cheung data set (mild effect size), it was 4.6. Both data sets had approximately equal spread ofT2values around the median, the interquartile range being 38.3 and 34.5 for the Bottomly and Cheung data sets, respectively.
Simulation and performance evaluation
Table 3 DEG set size and expected PPV of the DEG call methods in the analysis of Rajkumar data set.Variation in DEG set size and expected PPV were computed using bootstrapping for methods where the DEG set size was not too small or too large.
Method DEG set size±SE PPV∗±SE (%)
voom 287±43 88.9±4.1
edgeR 564±694 72.6±15.0
DESeq 3,384 NR
Z-test 9,417 NR
DESeq2 10 NR
NOISeq 31 NR
GFOLD 38 NR
Notes.
SE, standard error; NR, Not Relevant.
To evaluate method performance, we used sensitivity and positive predictive value (PPV). For each DEG call method, we computed sensitivity as the proportion of reference DEG that were called. PPV was computed as the proportion of DEG called that were members of the reference DEG set. The mean and standard deviation (SD) of these metrics were then reported. Methods that show good PPV are particularly interesting in the context of unreplicated experiments, since DEG obtained from them offer the best potential of being validated. For systems level analysis, DEG should preferably be called using methods with good balance of sensitivity and PPV.
RESULTS & DISCUSSION
Validity of voom for setting the reference DEG set
The DEG set size and expected PPV of each method in the analysis of the Rajkumar data set are given inTable 3. The results indicate that only voom and edgeR produced call sizes that were of reasonable order of magnitude. However, voom had relatively higher expected PPV over edgeR; additionally, the DEG set size called using voom had standard error (SE) that was an order of magnitude smaller compared to edgeR (bootstrap sampling with replacement of biological replicates; 1,000 iterations). Therefore, it seemed reasonable to use voom as the method of choice to construct the reference DEG set for the Bottomly and Cheung data sets.
We note with interest fromTable 3that the number of DEG called by DESeq2 dropped drastically compared to DESeq. Since DESeq2 implements a shrinkage estimation of dispersion parameter and fold change to improve the performance of DESeq, the present suggests that this may occasionally lead to over-correction, resulting in DEG set size that is too small.
Performance of DEG call methods in the Cheung and Bottomly data sets
Positive predictive value and sensitivity
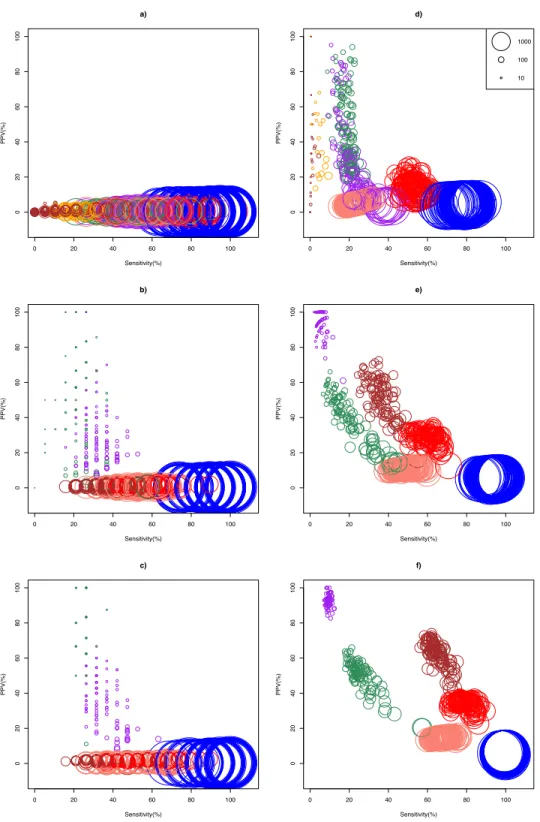
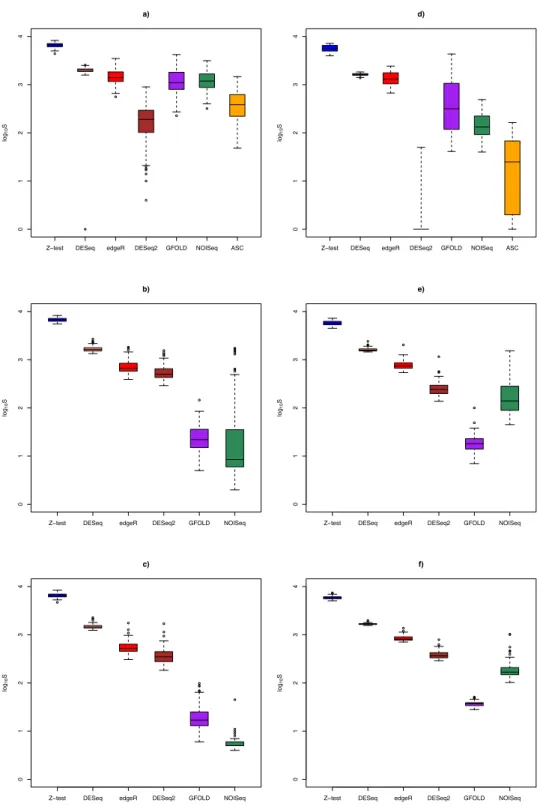
Bottomly and Cheung data set respectively could analyzed using ASC. The simulation results show that optimality of a DEG call method for a given replicate size depended on whether biological effect size was mild or strong (Fig. 2). In the Cheung data set (mild biological effect size), all methods had very low (about 1%) mean positive predictive value (PPV) for unreplicated experiment (Fig. 2AandTable S3), suggesting that no meaningful biological insights were possible. However, mean PPV (±SD) increased substantially for NOISeq to 43.5±31.5%, and for GFOLD to 29.6±15.8%, forn=3 (Fig. 2B). Doubling and approximately tripling replicate size ton=6 (Fig. 2C) andn=10 (Fig. S3) further improved mean PPV for NOISeq to 87.0±16.1% and 92.2±12.9%, and for GFOLD to 36.3±14.9% and 52.6±18.8%, respectively. In all four replicate sizes, mean PPV was low for the other methods. It did not exceed 12% for DESeq2, and was never more than 3% for edgeR, DESeq andZ-test.
A markedly different pattern of method performance was observed in the analysis of the Bottomly data set (strong biological effect size). In unreplicated experiments (Fig. 2D), mean PPV was relatively high for NOISeq (50.6±20.3%), ASC (47.2±25.9%) and GFOLD (31.2±25.6%), compared to just about 15% in edgeR and 5% in DESeq and Z-test. DESeq2 did not perform well, with mean PPV (29.6±28.4%), and an extremely low sensitivity (0.2±0.6%) as a result of making too few calls. Interestingly, GFOLD attained very high mean PPV atn=3 (94.3±6.9%;Fig. 2E), with marginal change to 92.5±3.3% atn=6. However, GFOLD was also the method with the lowest sensitivity (below 10%) for these two replicate sizes, which was caused by its small DEG set size (Fig. 3).
DESeq2 struck the best balance between PPV and sensitivity as replicate size increased, but edgeR showed reasonable performance too. Atn=3 (Fig. 2E) andn=6 (Fig. 2F), DESeq2 had mean PPV of 52.5±10.8% and 62.1±7.7%, with mean sensitivity of 36.0±5.7% and 65.1±4.5%, respectively. For edgeR, its mean PPV was 28.7±4.1% and 33.9±3.0%, with mean sensitivity of 59.8±5.4% and 79.0±4.6%, respectively. At n=6, DESeq2 had similar sensitivity compared to its older version DESeq, and a superior mean PPV that was about four times higher. Unsurprisingly, theZ-test remained the worst performer, with mean PPV just about 6%.
The general increase in mean sensitivity for replicated experiments was consistent with the finding that the increase in statistical power for detecting DEG is primarily determined by biological replicate size, and less by sequencing depth (Liu, Zhou & White, 2014).
DEG set size
0 20 40 60 80 100 0 2 04 06 08 0 1 0 0 a) Sensitivity(%) PPV(%)
0 20 40 60 80 100
0 2 04 06 08 0 1 0 0 d) Sensitivity(%) PPV(%) 1000 100 10
0 20 40 60 80 100
0 2 04 06 08 0 1 0 0 b) Sensitivity(%) PPV(%)
0 20 40 60 80 100
0 2 04 06 08 0 1 0 0 e) Sensitivity(%) PPV(%)
0 20 40 60 80 100
0 2 04 06 08 0 1 0 0 c) Sensitivity(%) PPV(%)
0 20 40 60 80 100
0 2 04 06 08 0 1 0 0 f) Sensitivity(%) PPV(%)
Z−test DESeq edgeR DESeq2 GFOLD NOISeq ASC
01234
a)
log
10
S
Z−test DESeq edgeR DESeq2 GFOLD NOISeq ASC
01234
d)
log
10
S
Z−test DESeq edgeR DESeq2 GFOLD NOISeq
01234
b)
log
10
S
Z−test DESeq edgeR DESeq2 GFOLD NOISeq
01234
e)
log
10
S
Z−test DESeq edgeR DESeq2 GFOLD NOISeq
01234
c)
log
10
S
Z−test DESeq edgeR DESeq2 GFOLD NOISeq
01234
f)
log
10
S
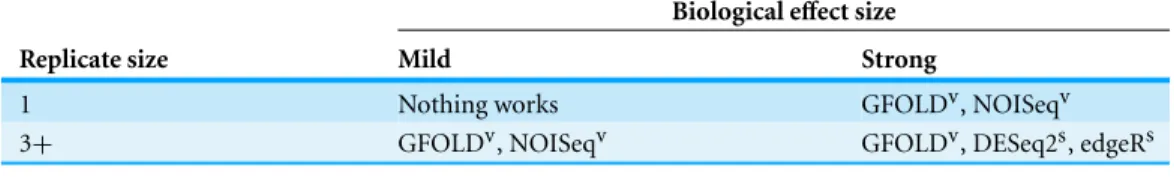
Table 4 Pragmatic DEG call methods for four combinations of biological effect size and replicate size, with suggested applications.
Biological effect size
Replicate size Mild Strong
1 Nothing works GFOLDv, NOISeqv
3+ GFOLDv, NOISeqv GFOLDv, DESeq2s, edgeRs
Notes.
v, for validation work; s, for systems biology work.
Optimality requires a context
The current results suggest that unreplicated RNA-seq experiments, which are still very common among underfunded labs working with non-model organisms, may be a cost-effective way to generate candidate DEG with reasonable likelihood of being validated, provided that the underlying biological effect size is strong. Thus, for unreplicated RNA-seq experiments with phenotype classes such as those associated with pathogenic challenge and physico-chemical stress, we expect DEG called using NOISeq or GFOLD to be good candidates for validation. ASC may also be useful, though it should be noted that it could fail to run for particular combinations of sample pairs, as we found out in the present study. For validation work, GFOLD and NOISeq should be even more efficient once triplicates are available, but further replicate size increase produced only marginal mean PPV gain in the Bottomly data set, suggesting that using more than triplicates is not a cost-effective approach when validation of DEG candidates is the main research goal. When biological effect size is strong, we suggest DESeq2 or edgeR as promising methods to mine DEG for systems biology work, on account of their good PPV and sensitivity balance. However, users should be aware of possibility that shrinkage estimation of dispersion and fold change procedure in DESeq2 may over-correct the initial estimates of these parameters, leading to a DEG set size that is too small, as discovered in the analysis of the Rajkumar data set (Table 3).
Research programs focusing on the investigation of weak or modest biological effect sizes must have replicates, use NOISeq or GFOLD for DEG calling, and then to restrict the research goal to validation of the DEG candidates. Pursuing a systems biology (e.g., gene set analysis, functional enrichment) direction in such programs is not feasible, since in the Bottomly data set, the DEG set size of both GFOLD and NOISeq atn=10 became too small (below 20).
Table 4summarizes the recommended DEG call methods and research goals for the
combinations of biological effect size and replicate size considered in the present study.
Transcriptome coverage effect
that the effect of transcriptome coverage on DEG calling was probably marginal in the present study.
Limitations
In the present study, we justified the use of voom for setting the reference DEG set on the basis of its performance in the Rajkumar data set, which has 115 qPCR-validated genes. Ideally, analyses of additional data sets of this nature would help us better understand the variability of method performance. Unfortunately, RNA-seq data sets that are coupled with extensive qPCR validation results remain uncommon.
The cost of not constructing the reference gene set using a simulation approach was the lost of one degree of freedom in the number of DEG call methods that could be evaluated, since we had to select one of the methods to determine the reference DEG set. Because of this, it may be possible that voom was actually the ideal method for making DEG calls when sufficient replicates are available. Therefore, in practical situations where systems level analysis is desired, one may wish to consider taking the union of DEG set called using voom with that from DESeq2 or edgeR. If the size of the union set is too large, one may consider taking the intersection set instead to obtain a smaller, but higher confidence DEG set (Zhang et al., 2014).
Future prospects
Many biologists have difficulty publishing results of RNA-seq experiments with no or few biological replicates. Despite including qPCR validation results, these studies are often dismissed by reviewers simply on grounds of ‘not having enough sample size.’ This stand is unnecessarily dogmatic, and does not take into account that some particular combinations in the trinity of replicate size-effect size-call method can potentially yield biologically meaningful results, as shown in the present study.
It is gradually being appreciated that RNA-seq analysis is a complex analysis that needs to address the numerous sources of variation from library preparation to bioinformatic processing (Kratz & Carninci, 2014) to yield an interpretable result. As a corollary, we suggest that one-size-fits-all pipelines for RNA-seq analysis commonly adopted by bioinformatics service providers should not be expected to always yield the most optimal set of DEG. There is a certainly a need for greater consultation between scientist and the bioinformatician to fine-tune pipelines by taking into account interactions in the replicate size-effect size-call method trinity.
As more high-quality RNA-seq experimental data continue to accrue in public databases, a better understanding of the anticipated behavior of various DEG calling methods under different biological and replicate size scenarios should gradually emerge from systematic comparison studies such as the current one. A complete dummy’s guide to RNA-seq differential gene expression analysis may not be too far ahead in the future.
CONCLUSIONS
insight. When it is expected to be mild, RNA-seq experiments should primarily aim at mining DEG for validation purpose, using at least triplicates and either NOISeq or GFOLD for DEG calling. Moreover, systems level analysis remains difficult as none of the methods considered presently showed satisfactory sensitivity and positive predictive value performance. When strong biological effect size is expected, analysis of unreplicated experiments using GFOLD or NOISeq can yield DEG candidates with optimistic validation prospects. The use of triplicates or more not only improves the statistical power of DEG call methods (Liu, Zhou & White, 2014), but also unlocks the analytical potential of RNA-seq data sets. Thus, users can apply GFOLD to pinpoint a DEG set for targeted qPCR validation, and simultaneously implement DESeq2 or edgeR to identify a DEG set for systems level analysis. Combining results from voom with those from DESeq2 or edgeR may lead to further improvements.
ACKNOWLEDGEMENTS
We are grateful to Jose M.G. Izarzugaza, Hao Zheng, an anonymous reviewer, and Jaume Bacardit (Academic Editor) for their helpful and constructive comments which resulted in important improvements to the present work.
ADDITIONAL INFORMATION AND DECLARATIONS
Funding
The study was supported by the University of Malaya Research Grant number UMRG RP032D-15AFR to Tsung Fei Khang. The funders had no role in study design, data collection and analysis, decision to publish, or preparation of the manuscript.
Grant Disclosures
The following grant information was disclosed by the authors: University of Malaya Research Grant: UMRG RP032D-15AFR.
Competing Interests
The authors declare there are no competing interests.
Author Contributions
• Tsung Fei Khang conceived and designed the experiments, analyzed the data, wrote the paper, reviewed drafts of the paper.
• Ching Yee Lau performed the experiments, analyzed the data, prepared figures and/or tables, reviewed drafts of the paper.
Data Availability
The following information was supplied regarding data availability:
Supplemental Information
Supplemental information for this article can be found online athttp://dx.doi.org/
10.7717/peerj.1360#supplemental-information.
REFERENCES
Allison DB, Cui X, Page GP, Sabirpour M. 2006.Microarray data analysis: from disarray to
consolidation and consensus.Nature Reviews Genetics7:55–65DOI 10.1038/nrg1749.
Anders S, Huber W. 2010.Differential expression analysis for sequence count data.Genome Biology11:R106DOI 10.1186/gb-2010-11-10-r106.
Auer PL, Doerge RW. 2010.Statistical design and analysis of RNA sequencing data.Genetics
185:405–416DOI 10.1534/genetics.110.114983.
Auer PL, Doerge RW. 2011.A two-stage Poisson model for testing RNA-seq data.Statistical Applications in Genetics and Molecular Biology10:1–26DOI 10.2202/1544-6115.1627.
Auer PL, Srivastava S, Doerge R. 2012.Differential expression—the next generation and beyond.
Briefings in Functional Genomics11:57–62DOI 10.1093/bfgp/elr041.
Bi Y, Davuluri RV. 2013.NPEBseq: nonparameteric empirical Bayesian-based procedure for
differential expression analysis of RNA-seq data.BMC Bioinformatics14:262
DOI 10.1186/1471-2105-14-262.
Bland JM, Altman DG. 1986.Statistical methods for assessing agreement between two methods of
clinical measurement.The Lancet327:307–310DOI 10.1016/S0140-6736(86)90837-8.
Bottomly D, Walter NA, Hunter JE, Darakijan P, Kawane S, Buck KJ, Searles RP, Mooney M, McWeeney SK, Hitzemann R. 2011.Evaluating gene expression in C57BL/6J and DBA/2J
mouse striatum using RNA-Seq and microarrays.PLoS ONE24:e17820
DOI 10.1371/journal.pone.0017820.
Chatr-Aryamontri A, Breitkreutz BJ, Oughtred R, Boucher L, Heinicke S, Chen D, Stark C, Breitkreutz A, Kolas N, O’Donnell L, Reguly T, Nixon J, Ramage L, Winter A, Sellam A, Chang C, Hirschman J, Theesfeld C, Rust J, Livstone M, Dolinski K, Tyers M. 2015.
The BioGRID interaction database: 2015 update.Nucleic Acids Research43:D470–D478
DOI 10.1093/nar/gku1204.
Chen Y, McCarthy D, Robinson M, Smyth G. 2015.edgeR: differential expression analysis of
digital gene expression data.Available athttp://www.bioconductor.org/packages/release/bioc/
vignettes/edgeR/inst/doc/edgeRUsersGuide.pdf(accessed 27 May 2015).
Cheung VG, Nayak RR, Wang IX, Elwyn S, Cousins SM, Morley M, Spielman RS. 2010.
Polymorphic cis- and trans-regulation of human gene expression.PLoS Biology8:e1000480
DOI 10.1371/journal.pbio.1000480.
Di Y, Schafer DW, Cumbie JS, Chang JH. 2011.The NBP negative binomial model for assessing
differential gene expression from RNA-seq.Statistical Applications in Genetics and Molecular
Biology10:1–28DOI 10.2202/1544-6115.1637.
Dillies MA, Rau A, Aubert J, Hennequet-Antier C, Jeanmouqin M, Servant N, Keime C, Marot G, Castel D, Estelle J, Guernec G, Jaqla B, Journeau L, Lalo¨o D, Le Gall C, Scha¨effer B, Le Crom S, Guedj M, Jaffr´ezic F, French StatOmique Consortium. 2013.A comprehensive evaluation of normalization methods for Illumina high-throughput RNA sequencing data
analysis.Briefings in Bioinformatics14:671–683DOI 10.1093/bib/bbs046.
Dudoit S, Shaffer JP, Boldrick L. 2014.Multiple hypothesis testing in microarray experiments.
Feng J, Meyer CA, Wang Q, Liu JS, Liu XS, Zhang Y. 2012.GFOLD: a generalized fold change
for ranking differentially expressed genes from RNA-seq data.Bioinformatics28:2782–2788
DOI 10.1093/bioinformatics/bts515.
Frazee AC, Langmead B, Leek JT. 2011.Recount: a multi-experiment resource of analysis-ready
RNA-seq gene count datasets.BMC Bioinformatics12:449DOI 10.1186/1471-2105-12-449.
Glaus P, Honkela A, Rattray M. 2012.Identifying differentially expressed transcripts from
RNA-seq data with biological variation.Bioinformatics28:1721–1728
DOI 10.1093/bioinformatics/bts260.
Grice DE, Reenil¨a I, M¨annist¨o PT, Brooks AI, Smith GG, Golden GT, Buxbaum JD,
Berrettini WH. 2007.Transcriptional profiling of C57 and DBA strains of mice in the absence
and presence of morphine.BMC Genomics8:76DOI 10.1186/1471-2164-8-76.
Grimaldi CM, Cleary J, Selma Dagtas A, Moussai D, Diamond B. 2002.Estrogen alters thresholds
for B cell apoptosis and activation.The Journal of Clinical Investigation109:1625–1633
DOI 10.1172/JCI0214873.
Gu J, Wang X, Halakivi-Clarke L, Clarke R, Xuan J. 2014.BADGE: a novel Bayesian model
for accurate abundance quantification and differential analysis of RNA-Seq data.BMC
Bioinformatics15(Suppl 9):S6DOI 10.1186/1471-2105-15-S9-S6.
Guo Y, Li CI, Ye F, Shyr Y. 2013.Evaluation of read count based RNAseq analysis methods.BMC Genomics14(Suppl 8):S2DOI 10.1186/1471-2164-14-S8-S2.
Hardcastle TJ, Kelly KA. 2010.baySeq: empirical Bayesian methods for identifying differential
expression in sequence count data.BMC Bioinformatics11:422DOI 10.1186/1471-2105-11-422.
Jeanmougin M, De Reynies A, Marisa L, Paccard C, Nuel G, Guedj M. 2014.Should we abandon
thet-test in the analysis of gene expression microarray data: a comparison of variance modeling
strategies.PLoS ONE5:e12336DOI 10.1371/journal.pone.0012336.
Kanda N, Tsuchida T, Tamaki K. 1996.Testosterone inhibits immunoglobulin production by
human peripheral blood mononuclear cells.Clinical & Experimental Immunology106:410–415
DOI 10.1046/j.1365-2249.1996.d01-842.x.
Klein SL. 2000.The effects of hormones on sex differences in infection: from genes to behavior.
Neuroscience & Biobehavioral Reviews24:627–638DOI 10.1016/S0149-7634(00)00027-0.
Korostynski M, Kaminska-Chowaniec D, Piechota M, Przewlocki R. 2006.Gene expression
profiling in the striatum of inbred mouse strains with distinct opiod-related phenotypes.BMC
Genomics7:146DOI 10.1186/1471-2164-7-146.
Korostynski M, Piechota M, Kaminska D, Solecki W, Przewlocki R. 2007.Morphine effects on
striatal transcriptome in mice.Genome Biology8:R128DOI 10.1186/gb-2007-8-6-r128.
Kratz A, Carninci P. 2014.The devil in the details of RNA-seq.Nature Biotechnology32:882–884
DOI 10.1038/nbt.3015.
Langmead B, Hansen KD, Leek JT. 2010.Cloud-scale RNA-sequencing differential expression
analysis with Myrna.Genome Biology11:R83DOI 10.1186/gb-2010-11-8-r83.
Law CW, Chen Y, Shi W, Smyth GK. 2014.voom: precision weights unlock linear model analysis
tools for RNA-seq read counts.Genome Biology15:R29DOI 10.1186/gb-2014-15-2-r29.
Leng N, Dawson JA, Thomson JA, Ruotti V, Rissman AI, Smits BM, Haag JD, Gould MN, Stewart RM, Kendziorski C. 2013.EBSeq: an empirical Bayes hierarchical model for inference
in RNA-seq experiments.Bioinformatics29:1035–1043DOI 10.1093/bioinformatics/btt087.
Li B, Fillmore N, Bai Y, Collins M, Thomson JA, Stewart R, Dewey CN. 2014.Evaluation
of de novo transcriptome assemblies from RNA-Seq data. Genome Biology
15:553DOI 10.1186/s13059-014-0553-5.
Li J, Tibshirani R. 2013.Finding consistent patterns: a nonparametric approach for identifying
differential expression in RNA-Seq data.Statistical Methods in Medical Research22:519–536
DOI 10.1177/0962280211428386.
Li J, Witten DM, Johnstone IM, Tibshirani R. 2012.Normalization, testing, and false discovery
rate estimation for RNA-sequencing data.Biostatistics13:523–528
DOI 10.1093/biostatistics/kxr031.
Liu Y, Zhou J, White KP. 2014.RNA-seq differential expression studies: more sequence or more
replication?Bioinformatics30:301–304DOI 10.1093/bioinformatics/btt688.
Love MI, Huber W, Anders S. 2014.Moderated estimation of fold change and dispersion for
RNA-seq data with DESeq2.Genome Biology15:550DOI 10.1186/s13059-014-0550-8.
Lund SP, Nettleton D, McCarthy DJ, Smyth GK. 2012.Detecting differential expression in
RNA-sequence data using quasi-likelihood with shrunken dispersion estimates.Statistical
Applications in Genetics and Molecular Biology11:Article 8DOI 10.1515/1544-6115.1826.
Oshlack A, Robinson MD, Young MD. 2010.From RNA-seq reads to differential expression
results.Genome Biology11:220DOI 10.1186/gb-2010-11-12-220.
R Core Team. 2015.R: a language and environment for statistical computing. Vienna: R Foundation for Statistical Computing.
Rajkumar AP, Qvist P, Lazarus R, Lescai F, Ju J, Nyegaard M, Mors O, Børglum AD, Li Q, Chris-tensen J. 2015.Experimental validation of methods for differential gene expression analysis and
sample pooling in RNA-seq.BMC Genomics16:548DOI 10.1186/s12864-015-1767-y.
Rapaport J, Khanin R, Liang Y, Pirun M, Krek A, Zumbo P, Mason CE, Socci ND, Betel D. 2013.
Comprehensive evaluation of differential gene expression analysis methods for RNA-seq data.
Genome Biology14:R95DOI 10.1186/gb-2013-14-9-r95.
Ritchie ME, Phipson B, Wu D, Hu Y, Law CW, Shi W, Smyth GK. 2015.limma powers differential
expression analyses for RNA-sequencing and microarray studies.Nucleic Acids Research
43:e47DOI 10.1093/nar/gkv007.
Robinson MD, McCarthy DJ, Smyth GK. 2010.edgeR: a bioconductor package for differential
expression analysis of digital gene expression data.Bioinformatics26:139–140
DOI 10.1093/bioinformatics/btp616.
Seyednasrollah F, Laiho A, Elo LL. 2015.Comparison of software packages for detecting
differential expression in RNA-seq studies. Briefings in Bioinformatics 16:59–70
DOI 10.1093/bib/bbt086.
Sims D, Sudberry I, Ilott NE, Heger A, Ponting CP. 2014.Sequencing depth and coverage: key
considerations in genomic analyses.Nature Reviews Genetics15:121–132DOI 10.1038/nrg3642.
Smyth GK. 2004.Linear models and empirical Bayes methods for assessing differential expression
in microarray experiments.Statistical Applications in Genetics and Molecular Biology3(1):
Article 1DOI 10.2202/1544-6115.1027.
Smyth G. 2005.limma: Linear models for microarray data. In: Gentleman R, Carey V, Dudoit
S, Irizarry R, Huber W, eds.Bioinformatics and computational biology solutions using R and
Bioconductor. New York: Springer, 397–420.
Soneson C, Delorenzi M. 2013.A comparison of methods for differential expression analysis of
Srivastava S, Chen L. 2010.A two-parameter generalized Poisson model to improve the analysis of
RNA-seq data.Nucleic Acids Research38:e170DOI 10.1093/nar/gkq670.
Stark C, Breitkreutz BJ, Reguly T, Boucher L, Tyers M. 2006.BioGRID: a general repository for
interaction datasets.Nucleic Acids Research34:D535–D539DOI 10.1093/nar/gkj109.
Tarazona S, Fur´ıo-Tar´ı P, Turr´a D, Di Pietro A, Nueda MJ, Ferrer A, Conesa A. 2015.Data
quality aware analysis of differential expression in RNA-seq with NOISeq R/Bioc package.
Nucleic Acids ResearchEpub ahead of print July 16 2015DOI 10.1093/nar/gkv711.
Tarazona S, Garc´ıa-Alcalde F, Dopazo J, Ferrer A, Conesa A. 2011.Differential expression in
RNA-seq: a matter of depth.Genome Research21:2213–2223DOI 10.1101/gr.124321.111.
Tibshirani R. 2006.A simple method for assessing sample sizes in microarray experiments.BMC Bioinformatics7:106DOI 10.1186/1471-2105-7-106.
Trapnell C, Hendrickson DG, Sauvageau M, GoffL, Rinn JL. 2013.Differential analysis of
gene regulation at transcript resolution with RNA-seq.Nature Biotechnology31:46–53
DOI 10.1038/nbt.2450.
Van De Wiel MA, Leday GG, Pardo L, Rue H, Van Der Vaart AW, Van Wieringen WN. 2013.
Bayesian analysis of RNA sequencing data by estimating multiple shrinkage priors.Biostatistics
14:113–128DOI 10.1093/biostatistics/kxs031.
Verthelyi D. 2001.Sex hormones as immunomodulators in health and disease.International Immunopharmacology1:983–993DOI 10.1016/S1567-5769(01)00044-3.
Wang L, Feng Z, Wang X, Wang X, Zhang X. 2010.DEGseq: an R package for identifying
differentially expressed genes from RNA-seq data.Bioinformatics 26:136–138
DOI 10.1093/bioinformatics/btp612.
Wang Z, Gerstein M, Snyder M. 2009.RNA-Seq: a revolutionary tool for transcriptomics.Nature Reviews Genetics10:57–63DOI 10.1038/nrg2484.
Wang C, Gong B, Bushel PR, Thierry-Mieg J, Xu J, Fang H, Hong H, Shen J, Su Z, Meehan J, Li X, Yang L, Li H, Labaj PP, Kreil DP, Megherbi D, Gaj S, Caiment F, Van Delft J, Kleinjans J, Scherer A, Devanarayan V, Wang J, Yang Y, Qian H-R, Lancashire LJ, Bessarabova M, Nikolsky Y, Furlanello C, Chierici M, Albanese D, Jurman G, Riccadonna S, Filosi M, Visintainer R, Zhang KK, Li J, Hsieh J-H, Svoboda DL, Fuscoe JC, Deng Y, Shi L, Paules RS, Auerbach SS, Tong W. 2014.The concordance between RNA-seq and microarray data
depends on chemical treatment and transcript abundance.Nature Biotechnology32:926–932
DOI 10.1038/nbt.3001.
Warnes G, Bolker B, Bonebakker L, Gentleman R, Huber W, Liaw A, Lumley T, Maechler M, Magnusson A, Moeller S, Schwartz M, Venables B. 2014.gplots: Various R programming tools for plotting data. R package version 2.13.0.Available athttp://CRAN.R-project.org/ package=gplots.
Wu Z, Jenkins BD, Rynearson TA, Dyhrman ST, Saito MA, Mercier M, Whitney LP. 2010.
Empirical Bayes analysis of sequencing-based transcriptional profiling without replicates.BMC
Bioinformatics11:564DOI 10.1186/1471-2105-11-564.
Wu H, Wang C, Wu Z. 2013.A new shrinkage estimator for dispersion improves differential
ex-pression detection in RNA-seq data.Biostatistics14:232–243DOI 10.1093/biostatistics/kxs033.
Xiao Y, Hsiao TH, Suresh U, Chen HIH, Wu X, Wolf SE, Chen Y. 2014.A novel significance score
for gene selection and ranking.Bioinformatics30:801–807DOI 10.1093/bioinformatics/btr671.
Zhang ZH, Jhaveri DJ, Marshall VM, Bauer DC, Edson J, Narayanan RK, Robinson GJ, Lundberg AE, Bartlett PF, Wray NR, Zhao QY. 2014. A comparative study of
techniques for differential expression analysis of RNA-seq data.PLoS ONE 9:e103207