Pharmaceutical Sciences http://dx.doi.org/10.1590/s2175-97902018000001006
Review
*Correspondence: F. R. Lourenço. Departamento de Farmácia, Faculdade de Ciências Farmacêuticas, Universidade de São Paulo. E-mail: [email protected]
Design of Experiments (DoE) applied to Pharmaceutical and
Analytical Quality by Design (QbD)
Isa Martins Fukuda
1, Camila Francini Fidelis Pinto
1, Camila dos Santos Moreira
1,
Alessandro Morais Saviano
1, Felipe Rebello Lourenço
1,*
1Department of Pharmacy, Faculty of Pharmaceutical Sciences, University of São Paulo, São Paulo, Brazil
According to Quality by Design (QbD) concept, quality should be built into product/method during pharmaceutical/analytical development. Usually, there are many input factors that may affect quality of product and methods. Recently, Design of Experiments (DoE) have been widely used to understand the effects of multidimensional and interactions of input factors on the output responses of pharmaceutical products and analytical methods. This paper provides theoretical and practical considerations for implementation of Design of Experiments (DoE) in pharmaceutical and/or analytical Quality by Design (QbD). This review illustrates the principles and applications of the most common screening designs, such as two-level full factorial, fractionate factorial, and Plackett-Burman designs; and optimization designs, such as three-level full factorial, central composite designs (CCD), and Box-Behnken designs. In addition, the main aspects related to multiple regression model adjustment were discussed, including the analysis of variance (ANOVA), regression significance, residuals analysis, determination coefficients (R2, R2-adj, and R2-pred), and lack-of-fit of regression model. Therefore, DoE was presented in detail
since it is the main component of pharmaceutical and analytical QbD.
Keywords: Design of Experiments (DoE). Quality by Design (QbD). Factorial Designs. Central Composite Designs (CCD). Box-Behnken Designs. Response Surface Methodology (RSM).
INTRODUCTION
Since the introduction of Quality-by-Design (QbD) concepts, it has been accepted that quality of pharmaceutical products should be designed and built during the manufacturing process. According to Juran (Yu et al., 2014), most of quality problems are related to the way in which a pharmaceutical product was designed. A poor-designed pharmaceutical product will show poor
safety and efficacy, no matter how many tests or analyses have been done to verified its quality. Thus, QbD begins
with the recognition that quality will not be improved by merely increasing analyses of pharmaceutical products. In other words, quality must be built into the product. (Yu
et al., 2014).
QbD is “a systematic approach to pharmaceutical development that begins with predefined objectives and emphasizes product and process understanding and
process control, based on sound science and quality risk management” (Yu et al., 2014). Application of QbD will
provide knowledge and scientific understanding to support
pharmaceutical development (Sangshetti et al., 2017). Pharmaceutical QbD goals may include: a) to achieve
meaningful product quality specifications; b) to increase
process capability and reduce product variability; c) to increase pharmaceutical development and manufacturing
efficiencies; and d) to enhance cause-effect analysis and regulatory flexibility (Yu et al., 2014).
The adoption of risk-based approaches and pharmaceutical QbD have been encouraged by most of regulatory agencies worldwide (Yu et al., 2014; Bhutani
et al., 2014). Pharmaceutical QbD concepts has been used to enhance manufacturing pharmaceutical products in terms of “Six-sigma” approach. “Six-sigma” is a system of practices to achieve process improvement, which leads
to a significantly reduced chance of out-of-specification (OOS) products. The significant number of OOS results
However, many times the problems in achieving the required “six-sigma” performance is not due to manufacturing issues, but due to poor analytical methods robustness and reliability. Several authors described the application of the QbD concepts in the development of analytical methods (Peraman, Bhadraya, Reddy, 2015; Bhutani et al., 2014). Analytical QbD is useful in the
development and optimization of robust and cost-effective
analytical methods. Implementation of analytical QbD provides a better solution to OOS results, as well as it also reduces the risk of method failure.
Traditionally, the development and optimization of pharmaceutical products and analytical methods have been carried-out by analyzing one factor at time (OFAT approach) (Bezerra et al., 2008; Candioti et al., 2014; Politis et al., 2017). One of the factors is changed within an appropriate range (or levels), while the others are kept constants. In addition to demanding a high number of experiments, the OFAT approach does not allow to evaluate the existence of interaction between the factors, which may lead to an inadequate conduction of the development and optimization (Bezerra et al., 2008; Candioti et al., 2014; Politis et al., 2017). To overcome these limitations, design of experiments (DoE) may provide better results with few number of experiments. DoE is a set of statistical tools which include screening designs; and optimization designs (Bezerra et al., 2008; Candioti et al., 2014; Politis et al., 2017).
DoE is the main component of pharmaceutical and analytical QbD. Thus, the present paper provides theoretical and practical considerations for implementation of Design of Experiments (DoE) in pharmaceutical and/or analytical Quality by Design (QbD).
STEPS OF PHARMACEUTICAL QUALITY BY
DESIGN AND ANALYTICAL QUALITY BY
DESIGN
QbD comprises all elements of pharmaceutical development, which will allow to design a quality product and its manufacturing process to consistently deliver the
intended performance concerning its safety and efficacy.
Using QbD approach, pharmaceutical development will provide a complete understanding of the product and its manufacturing process (Sangshetti et al., 2017; Zhao, Mao, 2017; Yu et al., 2014).
Analytical methods are considered an integral part of pharmaceutical development (Bhutani et al., 2014). Thus, the application of QbD approach to analytical method
development is justifiable and a recommended strategy to attain regulatory flexibility, to reduce out-of-specification
results, to achieve a high degree of robustness and a
cost-effective analytical method (Peraman, Bhadraya, Reddy,
2015; Bhutani et al., 2014).
Establishing of Quality Target Product Profile (QTPP) / Analytical Target Profile (ATP)
Quality Target Product Profile (QTPP) is a summary
of quality characteristics of pharmaceutical product that
must be achieved to guarantee safety and efficacy. In other words, QTPP consists in the definition of expectations in final pharmaceutical product (Sangshetti et al., 2017; Yu
et al., 2014). Considerations for QTPP should include the intended use in clinical setting, route of administration, dosage form, delivery system, dosage strength, container closure system, factors affecting pharmacokinetics properties, and product quality criteria (such sterility, purity, stability, among others) (Sangshetti et al., 2017; Zhao, Mao, 2017; Yu et al., 2014).
Analytical Quality by Design (AQbD) starts with the definition of Analytical Target Profile (ATP). ATP
defines the goal of the analytical method, which will drive
the method selection, design, and development activities (Peraman, Bhadraya, Reddy, 2015; Bhutani et al., 2014). In other words, ATP is a statement of what should be measure (for example, active pharmaceutical ingredient – API), in what it should be measured (for example, in pharmaceutical dosage form), and why/when it should be measured (for example, during stability study). A required level of confidence (target measurement uncertainty - usually estimated from accuracy and precision) should be
state into ATP definition, in order to ensure the quality of
analytical results (Bhutani et al., 2014).
It seems to be obvious that the main goals of a new product or method should be defined before its development. However, over the years, this approach has
been seldom adopted. A well-defined QTPP (or ATP) avoid
time- and resource-wasting. (Yu et al., 2014)
Identifying of Critical Quality Attributes (CQA) / Analytical Method Performance Characteristics (AMPC)
Identification of Critical Quality Attributes (CQA)
is the next step in pharmaceutical QbD. CQA is chemical, physical, biological or microbiological properties or characteristics of pharmaceutical product (in-process or
finished) that must be within appropriated specifications to
and physical properties such as color, shape, size, and friability (Sangshetti et al., 2017; Zhang, Mao, 2017). Potential CQA derived from QTPP are used to guide product and process development. Thus, Critical Material Attributes (CMA) and Critical Process Parameters (CPP)
may also be identified in order to achieved CQA and QTPP,
consequently (Yu et al., 2014).
Critical Material Attributes (CMA) consists of physical, chemical, biological or microbiological properties that input material must comply to ensure the desired CQA. On the other hand, Critical Process Parameters (CPP) are process parameters such as mixing
time, stirring speed, temperature, air flow, among others
that must be monitored before or during the process to ensure the desired CQA. (Zhao, Mao, 2017)
Analytical Method Performance Characteristics
(AMPC) are defined to meet the needs of ATP. AMPC may be classified into two categories, according to the
source of error: a) systematic (bias) variability, which includes accuracy, specificity, and linearity; and b) random (aleatory) variability, which includes precision,
limit of detection, and limit of quantification. Moreover,
range and robustness may also be stated into AMPC definition. It is always recommended to incorporate a joint criterion of method characteristics (at least, accuracy and precision) in ATP. Selection of analytical technique (such as chromatographic, spectrophotometric, or microbiological assays) must be driven by ATP and
AMPC definitions. (Peraman, Bhadraya, Reddy, 2015;
Bhutani et al., 2014)
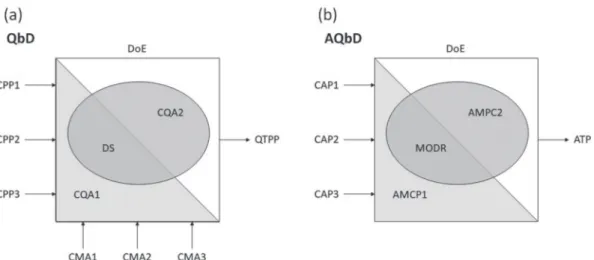
A schematic diagram of the steps for implementation of pharmaceutical QbD is showed in Figure 1a, including
the relationships among CMA, CPA, CQA, Design Space, and QTPP. In addition, the steps for implementation of analytical QbD is showed in Figure 1b, including the relationships among CAP, AMPC, MODR, and ATP.
Risk assessment
Risk assessment is a systematic process of organizing knowledge information to support decision. There are three essential elements in risk assessment: a) risk
identification: systematical use of information to identify
potential sources of hazard from historical data, theoretical analysis, and stakeholders’ concerns; b) risk analysis: the
estimation of risk associated with the identified hazards;
and c) risk evaluation: comparison of the estimated risks using quantitative or qualitative scale to determine their
significance.
Ishikawa (fishbone) diagram and failure mode and effects analysis (FMEA) are widely used risk assessment
tool. Ishikawa diagram is a qualitative risk assessment tool that allows one to identified and classified into broad categories the main sources of hazards. In other words, this helps answering the question “What might be wrong?”. FMEA method is often used to perform a quantitative risk assessment, that provides a risk priority number (RPN = P x S x D) estimated based on the occurrence probability (P), severity (S), and likelihood of detection (D). FMEA allows one the answer the questions “What is the likely (probability) it will be wrong?” and “What are the consequences (severity)?” (Sangshetti et al., 2017; Zhao, Mao, 2017; Peraman, Bhadraya, Reddy, 2015; Bhutani et al., 2014).
DESIGN OF EXPERIMENTS (DoE)
DoE is a structured and organized method for determining the relationships between input factors (xi – independent variables) affecting one or more output responses (y – dependent variables), through the establishment of mathematical models (y = f(xi)).
In DoE approach, the controlled input factors are systematically varied to determine their effects on the output responses, which allows the determination of the
most important input factors, the identification of input
factors setting leading to optimized output responses, and the elucidation of interactions between input factors.
Selection of experimental design
Selections of best experimental design should
consider several aspects, such as defined objectives, number
of input factors and interactions to be studied, and statistical
validity and effectiveness of each design. In order to provide
a better understand of DoE application, experimental designs may be divided into two types: a) screening designs; and b) optimization designs (Bezerra et al., 2008; Candioti
et al., 2014; Politis et al., 2017). Table I provides a summary of screening and optimization designs characteristics, such as number of experiments required, number of levels of input factors, and numbers of factors to be studied.
Screening designs
Two-level full factorial designs, fractionate factorial designs, and Placket -Burman designs are the most used screening designs because of their cost-effective advantages. These experimental designs allow one to study a wide number of input factors with reduced numbers of experiments. However, they also have some limitations that should be considered in order to provide a better understanding of the effects of input factors on output responses (Bezerra et al., 2008; Candioti et al., 2014; Politis et al., 2017).
Two-level full factorial designs are the most powerful screening designs, once they allow to estimate
main effects of input factors and their interactions on
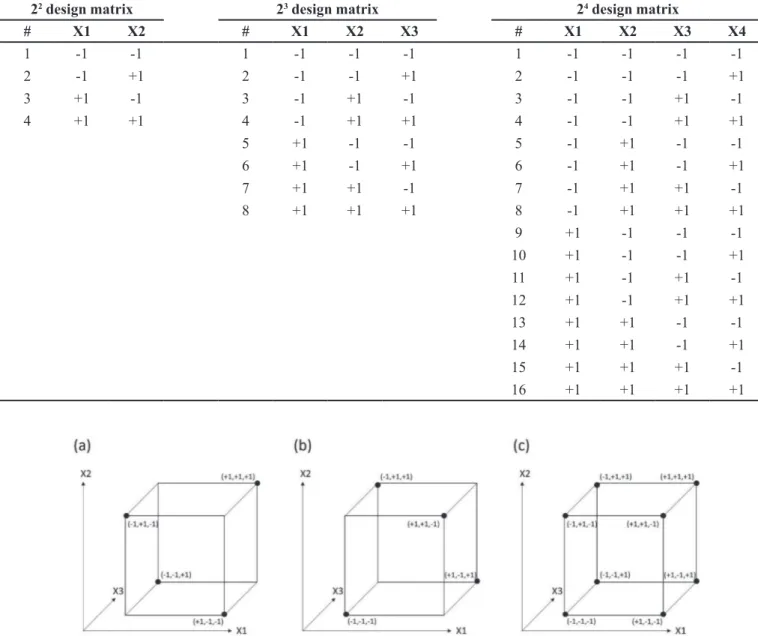
output responses. The main limitations of two-level full factorial designs rely on the large number of experiments required, when compared to fractionate factorial designs and Plackett-Burman designs. The number of experiments required for two-level full factorial designs may be calculated as 2k, where k is the number of input factors to be studied (Bezerra et al., 2008; Candioti et al., 2014; Politis et al., 2017). Two-level full factorial designs matrix for 2, 3, and 4 input factors are presented in Table II.
Fractionate factorial designs are one the most widely used for screening purposes, because these designs enable the evaluation of large number of input factors with a reduced number of experiments required (Bezerra et al.,
2008; Candioti et al., 2014; Politis et al., 2017). This may be achieved by fractionating a full factorial 2k design into a 2k–p design, where p is the number of generators chosen to fractionate the design (Figure 2). For example, when examining four input factors, a half-fraction factorial design (24–1 = 8 experiments) may be adopted. A
quarter-fraction factorial design (25–2 = 8 experiments) may be adopted to study five input factors, with the same number
of experiments.
However, attention should be paid to the estimation
of main effects and interaction effects using fractionate
factorial designs, because some of them are aliased (or confounded). For example, using a 23-1
III fractionate factorial design, the main effect of X3 is aliased with the interaction of X1 and X2 (Figure 3). When adopting
a 24-1
IV fractionate factorial design, the main effect of X4 is aliased with 3rd order interaction of X1, X2, and X3. In fractionate factorial designs with resolution III, main effects are aliased with 2nd order interactions. When
using resolution IV designs, main effects are aliased with 3rd order interactions and 2nd order interactions are
aliased with 2nd order interactions. Adopting resolution
TABLE I – Summary of screening and optimization designs characteristics, number of experiments, levels, and factors
Applications Experimental design Experiments Levels Factors
Screening Plackett-Burman N 2 < N-1
Fractionate factorial 2k-p
Res 2 k > 4
Two-level full factorial 2k 2 2 < k < 5
Optimization Box-Behnken 2k(k-1)+C 3 3 < k < 5
Central composite design 2k+2k+C 5 2 k< 5
V designs, main effects are aliased with 4th order
interactions and 2nd order interactions are aliased with
3rd order interactions. Thus, fractionate factorial designs
may not be suitable for assessing the interactions among factors. The resolution of fractionate factorial designs is defined according to the selecting of generators. A summary of fractionate designs matrix were presented in Table III.
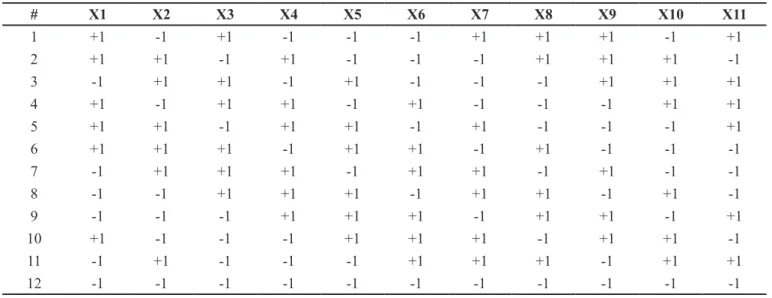
Plackett-Burman designs are special types of two-level fractionate factorial designs (resolution III), which allow one to study up to N-1 input factors with N experiments (N should be multiple of 4) (Bezerra et al., 2008; Candioti et al., 2014; Politis et al., 2017). An
example of a Plackett-Burman design matrix used to study 11 input factors with 12 experiments is provided in Table IV.
Screening designs are often used in the first step to
DoE in order to select the most important input factors and
discard the insignificant ones. Pareto charts are useful tools
to achieve this purpose (Figure 3), because they allow to put the input factors (and their interactions) in order of importance. For example, based on Pareto chart presented
in Figure 2a we conclude that input factor X1 is the most important, followed by factors X3 and X2, respectively.
When a fractionate factorial design was adopted, attention should be paid to analyze Pareto chart. In other words,
TABLE II – Two-level full factorial designs matrix for two (22), three (23), and four (24) input factors (X1 to X4)
22 design matrix 23 design matrix 24 design matrix
# X1 X2 # X1 X2 X3 # X1 X2 X3 X4
1 -1 -1 1 -1 -1 -1 1 -1 -1 -1 -1
2 -1 +1 2 -1 -1 +1 2 -1 -1 -1 +1
3 +1 -1 3 -1 +1 -1 3 -1 -1 +1 -1
4 +1 +1 4 -1 +1 +1 4 -1 -1 +1 +1
5 +1 -1 -1 5 -1 +1 -1 -1
6 +1 -1 +1 6 -1 +1 -1 +1
7 +1 +1 -1 7 -1 +1 +1 -1
8 +1 +1 +1 8 -1 +1 +1 +1
9 +1 -1 -1 -1
10 +1 -1 -1 +1
11 +1 -1 +1 -1
12 +1 -1 +1 +1
13 +1 +1 -1 -1
14 +1 +1 -1 +1
15 +1 +1 +1 -1
16 +1 +1 +1 +1
FIGURE 2 – Illustration of a half-fractionate two-level factorial design (23-1
III) matrix (a), its complementary matrix (b), and
main effect of input factor X3 (Figure3a) was aliased
with the interaction of factors X1 and X2 (Figure 3b).
For instance, consider that during the development of
a chromatographic method, one wants to explain the resolution between two peaks as functions of the pH of
mobile phase (X1), amount of organic solvent in mobile phase (X2), and flow rate (X3). Based on Pareto chart showed in Figure 3a, one may conclude that the flow rate is a critical analytical parameter. However, the flow rate
is aliased (or confounded) with the interaction between
pH and amount of organic solvent in mobile phase (X3 = X1 x X2). This conclusion was wrongly assumed because
Pareto chart showed in Figure 3a was obtained using a fractionate factorial design with resolution III. When using
a full factorial, flow rate will not be aliased (confounded)
with the interaction between pH and amount of organic solvent in mobile phase, which is evidenced in Pareto chart showed in Figure 3b.
H o w e v e r, P a r e t o c h a r t s d o e s n o t p r o v i d e information of how the output responses are affect by varying input factor level. This information may be provided by a main effects and interactions plots (Figure 4). For example, output response increases by
varying the input factor X1 from low (-1) to high (+1)
level, while output response decreases by varying the
input factor X2 from low (-1) to high (+1) level (Figure
4a). An advantage of DoE approach over the OFAT experimentation relies on the elucidation of interactions between input factors. For example, in Figure 4b, the
output response increases significantly by varying the input factor X1 from low (-1) to high (+1) level with X2 fixed at low level (-1 – grey dots and line), while output
response remains almost constant by varying the input
factor X1 from low (-1) to high (+1) level with X2 fixed at high level (+1 – black dots and line). Interaction effects
plots is useful to identified synergism or antagonism between input factors on output responses.
TABLE III – Half- and quarter-fractionate two-level factorial designs matrix for three (23-1
III), four (2 4-1
IV), and five (2 5-2
III) input
factors (X1 to X5)
23-1
III design matrix
*1 24-1
IV design matrix
*2 25-2
III design matrix *3
# X1 X2 X3 # X1 X2 X3 X4 # X1 X2 X3 X4 X5
1 -1 -1 +1 1 -1 -1 -1 -1 1 -1 -1 -1 +1 +1
2 -1 +1 -1 2 +1 -1 -1 +1 2 1 -1 -1 -1 -1
3 +1 -1 -1 3 -1 +1 -1 +1 3 -1 1 -1 -1 +1
4 +1 +1 +1 4 +1 +1 -1 -1 4 1 1 -1 +1 -1
5 -1 -1 +1 +1 5 -1 -1 1 +1 -1
6 +1 -1 +1 -1 6 1 -1 1 -1 +1
7 -1 +1 +1 -1 7 -1 1 1 -1 -1
8 +1 +1 +1 +1 8 1 1 1 +1 +1
*1 X3 = X1 x X2 / *2 X4 = X1 x X2 x X3 / *3 X4 = X1 x X2 and X5 = X1 x X3
FIGURE 3 – Pareto charts representation for main effects (X1,
Optimization designs
Three-level full factorial designs, central composite designs, and Box-Behnken designs are the most used optimization designs because they allow modeling
complex response surface. One of the most important limitations of screening designs rely on the fact that they only allow modeling 1st order (linear) response surface,
because they have only two level for each input factor. Optimization designs uses 3 to 5 levels of each input factors, which allow modeling 2nd order (quadratic)
response surface (Bezerra et al., 2008; Candioti et al., 2014; Politis et al., 2017). However, due to the increased number of experiments required, they are usually used to study a reduced number of input factors (Table I).
Three-level full factorial design are often used only when two or three input factors need to be study, because an increased number of experiments is required. The number of experiments required may be calculated as 3k, where k is the number of input factors to be studied (Bezerra et al., 2008; Candioti et al., 2014; Politis et al., 2017). For example, a three-level full factorial design for three input factors requires 33 = 27 experiments (Table V).
A 3D spatial representation of factorial design is provided in Figure 5a.
Central composite designs (CCD) are one of the most used optimization designs because they use 5 level of each input factor with a reduced number of experiments required, when compared to three-level full factorial design (Bezerra et al., 2008; Candioti et al., 2014; Politis
et al., 2017). A 3D spatial representation of CCD for three input factors is provided in Figure 5b. This design consists of the following parts: a) the factorial design points (black dots); b) the axial points (grey dots); and c) the center point (white dots). CCD matrix is also presented in Table V, with the factorial design points (experiments 1-8), the axial points (experiments 9-14), and the central point (experiments 15-20 - 6 replicas).
TABLE IV – Plackett-Burman design matrix to study 11 input factors (X1 to X11) with 12 experiments
# X1 X2 X3 X4 X5 X6 X7 X8 X9 X10 X11
1 +1 -1 +1 -1 -1 -1 +1 +1 +1 -1 +1
2 +1 +1 -1 +1 -1 -1 -1 +1 +1 +1 -1
3 -1 +1 +1 -1 +1 -1 -1 -1 +1 +1 +1
4 +1 -1 +1 +1 -1 +1 -1 -1 -1 +1 +1
5 +1 +1 -1 +1 +1 -1 +1 -1 -1 -1 +1
6 +1 +1 +1 -1 +1 +1 -1 +1 -1 -1 -1
7 -1 +1 +1 +1 -1 +1 +1 -1 +1 -1 -1
8 -1 -1 +1 +1 +1 -1 +1 +1 -1 +1 -1
9 -1 -1 -1 +1 +1 +1 -1 +1 +1 -1 +1
10 +1 -1 -1 -1 +1 +1 +1 -1 +1 +1 -1
11 -1 +1 -1 -1 -1 +1 +1 +1 -1 +1 +1
12 -1 -1 -1 -1 -1 -1 -1 -1 -1 -1 -1
FIGURE 4 – Main effects (a) and interaction (b) plots of input
TABLE V – Three-level full factorial design (33), central composite design (CCD), and Box-Behnken design matrix for three input
factors (X1, X2, and X3)
33 design matrix Central composite design matrix Box-Behnken matrix
# X1 X2 X3 # X1 X2 X3 # X1 X2 X3
1 -1 -1 -1 1 -1 -1 -1 1 -1 -1 0
2 -1 -1 0 2 +1 -1 -1 2 +1 -1 0
3 -1 -1 +1 3 -1 +1 -1 3 -1 +1 0
4 -1 0 -1 4 +1 +1 -1 4 +1 +1 0
5 -1 0 0 5 -1 -1 +1 5 -1 0 -1
6 -1 0 +1 6 +1 -1 +1 6 +1 0 -1
7 -1 +1 -1 7 -1 +1 +1 7 -1 0 +1
8 -1 +1 0 8 +1 +1 +1 8 +1 0 +1
9 -1 +1 +1 9 -1,68 0 0 9 0 -1 -1
10 0 -1 -1 10 +1,68 0 0 10 0 +1 -1
11 0 -1 0 11 0 -1,68 0 11 0 -1 +1
12 0 -1 +1 12 0 +1,68 0 12 0 +1 +1
13 0 0 -1 13 0 0 -1,68 13 0 0 0
14 0 0 0 14 0 0 +1,68 14 0 0 0
15 0 0 +1 15 0 0 0 15 0 0 0
16 0 +1 -1 16 0 0 0
17 0 +1 0 17 0 0 0
18 0 +1 +1 18 0 0 0
19 +1 -1 -1 19 0 0 0
20 +1 -1 0 20 0 0 0
21 +1 -1 +1
22 +1 0 -1
23 +1 0 0
24 +1 0 +1
25 +1 +1 -1
26 +1 +1 0
27 +1 +1 +1
FIGURE 5 – Illustration of three-level full factorial design (33) matrix (a), central composite design (CCD) matrix (b), and
Box-Behnken design are special types of three-level fractionate factorial designs, which allows modeling 1st
and 2nd order response surfaces. These designs are more
cost-effective than three-level full factorial designs, particularly for large number of input factors (Bezerra
et al., 2008; Candioti et al., 2014; Politis et al., 2017). We can see that all points used in Box-Behnken designs (Figure 5c) were selected from the 33 full factorial design
(Figure 5a). The Box-Behnken matrix was also provided in Table V.
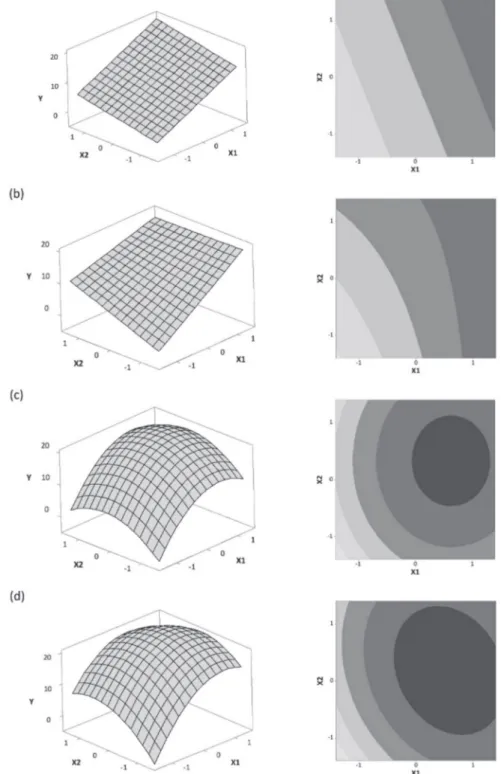
The simplest model which can be adjusted is based on a linear function. This model may be adjusted based on the results obtained from at least a fractionate factorial design (resolution IV or higher), if the output responses
are well fitted to Equation1.
(1)
Thus, the output response should have a linear response surface, as presented in Figure 6a.
To evaluate interactions between input factors, at least a two-level full factorial design should be adopted. The model can be adjusted based on a linear + interaction function, if the output response is well fitted to the Equation 2.
(2)
The response surface obtained using a linear + interaction function is presented in Figure 6b.
The main advantage of optimization designs relies on the possibility of modeling 2nd order response surfaces,
because they have 3 to 5 level for each input factor. In other words, these designs allow one the assess curvature of response surface. The model can be adjusted based on a linear + quadratic function, if the output response is well
fitted to the Equation 3.
(3)
Thus, the output response should have a curvature response surface, due to the presense of quadratic terms in regression model. The response surface obtained using a linear + quadratic function is presented in Figure 6c.
Finally, it may be necessary to adopt a full model, with linear + interaction + quadratic terms. The model can be adjusted based on a full model function, if the output
response is well fitted to the Equation 4.
(4)
The response surface obtained using a linear + interaction + quadratic function is presented in Figure 6d.
Mathematical model should be selected based on the application of Analysis of Variance (ANOVA). The main idea of ANOVA is to compare the variability due to treatment (varying the level of input factors) with the variability due to residual error. From this comparison, it is possible to evaluate the significance of the regression model (Table VI). Regression analysis is valid only if the residues (square of the difference between response predicted by mathematical model and experimental response) present normal distribution and homoscedasticity. When necessary, a Box-Cox
transformation (for example, ln transformation - λ = 0)
of output response may be used to improve normality and homoscedasticity of residues. (Bezerra et al., 2008; Candioti et al., 2014; Politis et al., 2017).
Based on ANOVA, we can decide to include or
to exclude the coefficients of linear terms (for example, X1, X2, and X3), interaction terms (for example, X1X2, X1X3, and X2X3), and quadratic terms (for example X12, X22, and X32). This decision is based on p-values for each coefficient regression term. Usually, a coefficient
regression term should be included in regression model when its p-value is lower than 0.05. In other words, when the coefficient regression term is significantly
different from 0. When the regression coefficient term is not different from 0 (p-value > 0.05), it indicates that the output response is not affect by varying the input factor
levels. Thus, this coefficient regression term may be excluded from the regression model.
Multiple regression model adjustment should be
assess based on determination coefficients (R2, R2-adj, and
R2-pred). Determination coefficient (R2) is the proportion
of the variance in the output response that is predicted from the input factors. In other words, how much of output response (Y) is explained by the input factors
(Xs). However, R2 will always increase by adding new
terms to the regression model. Thus, it is not a good way
to compared regression models with different number of
terms (for example, compare a linear model with a full model). The adjusted R2 (R2-adj) is a modified version of
R2 which is adjusted for the number of terms in regression
model. TheR2-adj increases only if the new term improves
the regression model. On the other hand, it decreases when the term does not improve the regression model. Thus, R2-adj allow one to compare the explanatory power of regression models that contain different number of terms.
Predictive R2 (R2-pred) indicates how well a regression
observation from the data set, estimating the regression equation, and determining how well the model predicts the removed observation. R2-adj and R2-pred are always
lower than R2.
In addition, variability due to lack-of-fit of regression
model should be compared to the variability due to random pure error in order to assess regression model adjustment
(Table VI). Regression model is poorly adjusted when the error provided by regression model lack-of-fit is
significantly higher than random pure error (p-value <
0.05). On the other hand, when the error provided by
regression model lack-of-fit is significantly lower than
random pure error (p-value > 0.05), it indicates that the
regression model is well fitted. It is important to notice
that lack-of-fit error can be estimated only when the experimental design includes replicas, usually for central point.
Defining Design Space (DS) / Method Operable Design Region (MODR)
D e s i g n S p a c e ( D S ) i s a m u l t i d i m e n s i o n a l combination and interaction of input factors (usually CMA and CPP) that have been proofed to provide assurance of
quality, and consequently, safety and efficacy. Moving
the input factors within the design space regions is not
considered a modification subject to notification, which ensure regulatory flexibility (Yu et al., 2014).
In analytical QbD, Method Operable Design Region (MODR) (also called analytical design space)
is the multidimensional combination and interaction of analytical conditions (input factors; for example, chromatographic conditions) that have been demonstrated to provide assurance performance of analytical method (output response; for example, resolution between peaks) (Bhutani et al., 2014).
Design space region may be obtained by graphical optimization from overlaid counter plots of output
responses (Ys) as functions of input factors (Xs) (Figure
7). Alternatively, multiple response optimization may be estimated by numerical technics of desirability functions. Desirability functions are usually design to achieve different criteria, for example to maximize, minimize, and target optimization of the output responses (Figure 8) (Candioti et al., 2014).
TABLE VI – Analysis of variance (ANOVA) used in multiple regression analysis to evaluate regression significance, residual error,
and lack-of-fit adjustment
Source d.f. SS MS F
Regression p – 1
Residuals n – p
Lack-of-fit m – p
Pure error n – m
Total n – 1
Legend: d.f. = degrees of freedom, SS = sum of squares, MS = mean square, F = F-test statistics.
Implementing control strategy and Continuous improvement
Control strategy is required to ensure that critical material attributes (CMA) and critical process parameters (CPP) are within the expected limits. Obviously, control space should be within the design space (Sangshetti et al., 2017). Analytical Process Technology (PAT) is an important tool in control strategy implementation, once it enables real-time release testing and provides an increased level of quality assurance compared to conventional end-product testing. However, PAT is not the only way to implement real-time release. Predictive models may also be used as an alternative to conventional release testing (Yu et al., 2014; Zhang, Mao, 2017).
In analytical QbD, control strategy is derived from the data collected during method development and validation, which enables to predict the ability of
method to meet analytical target profile (ATP) (Peraman,
Bhadraya, Reddy, 2015). Continuous monitoring of method performance allows to detect, identified, and address out-of-trend performance of the analytical method (Peraman, Bhadraya, Reddy, 2015).
T h e Q b D a p p r o a c h a l l o w s t h e c o n t i n u o u s improvement throughout the lifecycle of pharmaceutical
product and analytical method, including to reduce product variability, to improve process performance, to
reduce out-of-specification results, to improve analytical
performance, among others.
APPLICATIONS OF DESIGN OF EXPERIMENTS
IN QbD AND AQbD
Quality by Design approach was accepted by FDA in 2004 and described in ‘pharmaceutical cGMPs for 21st
century – a risk-based approach’. International conference on harmonization (ICH) Q8 pharmaceutical development, Q9 quality risk assessment, and Q10 pharmaceutical quality system provide detailed requirements regarding pharmaceutical product quality. QbD and DoE approaches help to implement ICH/Q8 and ICH/Q9.
Since QbD approach was accepted by FDA, DoE has been widely employed in order to provide a complete understanding of the product and its manufacturing process. Many applications of DoE used for screening and optimization purposes of pharmaceutical products and their manufacturing processes may be found in the literature. Several input factors (independent variables), such as excipient concentrations, stirring time, stirring speed, temperature, pressure, among other may be screened and optimized using DoE. Studied output responses (dependent variables) included particle size,
entrapment efficiency, dissolution rate, among other. Some
examples of DoE applications were showed in Table VII. Application of screening designs in pharmaceutical QbD allow to identify the critical material attributes (CMAs) and critical process parameters (CPPs) (independent variables) affecting the critical quality attributes (CQAs) (dependent variables) and, therefore, the quality target product profile (QTPP). In addition, optimizing design and surface response methodology and
multiple response optimization allow to define a design
space region in which CQAs and QTPP are attended. The adoption of a design space region based on product and
process understanding allow regulatory flexibility, because
changes within the design space region do not require prior regulatory approval.
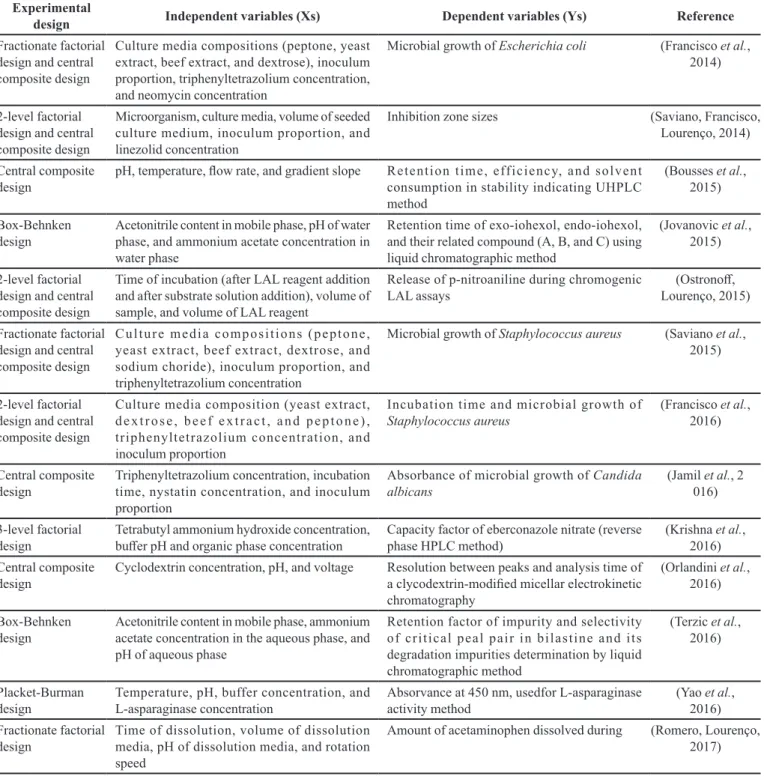
Recently, DoE has been used in the rational development and optimization of analytical methods. Culture media composition, mobile phase composition, flow rate, time of incubation are examples of input factors (independent variables) that may the screened and optimized using DoE. Several output responses (dependent variables), such as retention time, resolution between peaks, microbial growth, among other responses were found in literature. Table VIII shows some applications
TABLE VII – Examples of DoE applications for pharmaceutical development, experimental design adopted, independent variables (input factors – Xs), and dependent variables (output responses – Ys)
Experimental
design Independent variables (Xs) Dependent variables (Ys) Reference
Fractionate factorial design
Indomethacin concentration, stabilizer type, stabilizer concentration, processing temperature, and homogenization pressure
Particle size distribution, zeta potential, and physical form (XRD) of nanosuspensions
(Verma et al., 2009) Fractionate factorial
design and central composite design
Inlet air temperature, air flow rate and binder spray rate during the sprying phase
Moisture of granules and flow through an orifice of the granules obtained by fluid bed granulation
(Lourenço et al., 2012) 3-level factorial
design
Span 60 : Sodium lauryl sulfate ratio, organic : aqueous phase volume ratio, and polymer concentration
Emulsion phase stability, viscosity, and conductivity (Badawi, El-Khordahui, 2014) Box-Behnken design
Sodium alginate percentage, chitosan percentage, and calcium chloride percentage
Maximum drug encapsulation, particle size and drug release of cefpodoxime proxetil chitosan-alginate beads
(Muftaba, Ali, Kohli, 2014) 2-level factorial
design
Amount of oil (capmul MCM), amount of surfactant (tween 80), and amount of cosolvent (Transcutol HP)
Globule size, span, equilibrium solubility of cilostazol, zeta potential, and dissolution e f f i c i e n c y a t 3 0 m i n o f l i p i d b a s e d nanoemulsifying cilostazol
(Pund, Shete, Jagadale, 2014)
Multiple response optimization
C o n c e n t r a t i o n s o f i m i d a z o l i d i n y l u r e a , methyparaben, propylparaben, and EDTA in cosmetic formulations
Slopes from microbial curves of Burkholderia c e p a c i a, P s e u d o m o n a s a e r u g i n o s a, Staphylococcus aureus, Candida albicans, and Aspergillus brasiliensis
(Lourenço et al., 2015)
Central composite design
Percentage of HPMC, percentage of glycerol, and drying temperature
Thickness, weight, tensile strength, elongation at break, young’s modulus, and disintegration time of oroldispersible films
(Visser et al., 2015) 2-level factorial
design
Kneading temperature, impeller speed, liquid addition, extrusion speed, spheronizer speed, and spheronization time
Activity, hardness, and roundness of pellets for oral lysozyme delivery
(Sovàny et al., 2016) Box-Behnken
design
Lipid, lipid oil, and surfactand phase Particle size, entrapment, permeation flux, and percentage release of aceclofenac loaded-nano structured lipid carriers
(Garg et al., 2017) Central composite
design
Combination ratio of Eudragit®FS-30D / Eudragit® RS-PO, PVA concentration in external phase, and NaCl concentration on external phase
Size of microspheres, encapsulation efficiency of enoxaparin sodium, percentages released over 24h in gastric, duodenal and colonic media
(Hales et al., 2017)
2-level factorial design
Surfactant concentration, solid/liquid lipid ration, and ultrasonication time
Particle size and particle size distribution of nanostructured lipid carriers containing salicylic acid for dermal use
(Kovács et al., 2017) Box-Behnken
design
Amount of surfactant/cosurfactant mixture, p r o c e s s i n g p r e s s u r e a n d n u m b e r o f homogenization cycles
Globule size, size distribution (PDI), percentage transmittance, and drug release of silymarin nanoemulsion
(Nagi et al., 2017) 2-level factorial
design
C o n c e n t r a t i o n s o f e t h y l h e x y l t r i a z o n e , bemotrizinol, and ferulic acid in multifunctional sunscreens
Antioxidant activity, and UVA and UVB radiation
(Peres et al., 2017) 3-level factorial
design
Poloxamer 188, and acetone to methanol ratio Particle size, and entrapment efficiency of efavirenz loaded solid lipid nanoparticles
(Raina, Kaur, Jindal, 2017) 3-level factorial
design
Oil to surfactant/cosurfactant ratio and concentration of gellan gum
In vitro drug release and viscosity at physiological pH of a microemulsion of lorazepam via intranasal route
(Shah et al., 2017) 2-level factorial
design
Hydration temperature, stirring speed, and stirring time
Polydispersity index of miltefosine-loaded polymeric micelles
TABLE VIII – Examples of DoE applications for analytical methods development, experimental design adopted, independent variables (input factors – Xs), and dependent variables (output responses – Ys)
Experimental
design Independent variables (Xs) Dependent variables (Ys) Reference
Fractionate factorial design and central composite design
Culture media compositions (peptone, yeast extract, beef extract, and dextrose), inoculum proportion, triphenyltetrazolium concentration, and neomycin concentration
Microbial growth of Escherichia coli (Francisco et al., 2014)
2-level factorial design and central composite design
Microorganism, culture media, volume of seeded culture medium, inoculum proportion, and linezolid concentration
Inhibition zone sizes (Saviano, Francisco, Lourenço, 2014) Central composite
design
pH, temperature, flow rate, and gradient slope R e t e n t i o n t i m e , e ff i c i e n c y, a n d s o l v e n t consumption in stability indicating UHPLC method
(Bousses et al., 2015) Box-Behnken
design
Acetonitrile content in mobile phase, pH of water phase, and ammonium acetate concentration in water phase
Retention time of exo-iohexol, endo-iohexol, and their related compound (A, B, and C) using liquid chromatographic method
(Jovanovic et al., 2015) 2-level factorial
design and central composite design
Time of incubation (after LAL reagent addition and after substrate solution addition), volume of sample, and volume of LAL reagent
Release of p-nitroaniline during chromogenic LAL assays
(Ostronoff, Lourenço, 2015) Fractionate factorial
design and central composite design
C u l t u r e m e d i a c o m p o s i t i o n s ( p e p t o n e , yeast extract, beef extract, dextrose, and sodium choride), inoculum proportion, and triphenyltetrazolium concentration
Microbial growth of Staphylococcus aureus (Saviano et al., 2015)
2-level factorial design and central composite design
Culture media composition (yeast extract, d e x t r o s e , b e e f e x t r a c t , a n d p e p t o n e ) , triphenyltetrazolium concentration, and inoculum proportion
Incubation time and microbial growth of Staphylococcus aureus
(Francisco et al., 2016)
Central composite design
Triphenyltetrazolium concentration, incubation time, nystatin concentration, and inoculum proportion
Absorbance of microbial growth of Candida albicans
(Jamil et al., 2 016) 3-level factorial
design
Tetrabutyl ammonium hydroxide concentration,
buffer pH and organic phase concentration Capacity factor of eberconazole nitrate (reverse phase HPLC method)
(Krishna et al., 2016) Central composite
design
Cyclodextrin concentration, pH, and voltage Resolution between peaks and analysis time of a clycodextrin-modified micellar electrokinetic chromatography
(Orlandini et al., 2016) Box-Behnken
design
Acetonitrile content in mobile phase, ammonium acetate concentration in the aqueous phase, and pH of aqueous phase
Retention factor of impurity and selectivity o f c r i t i c a l p e a l p a i r i n b i l a s t i n e a n d i t s degradation impurities determination by liquid chromatographic method
(Terzic et al., 2016)
Placket-Burman design
Temperature, pH, buffer concentration, and L-asparaginase concentration
Absorvance at 450 nm, usedfor L-asparaginase activity method
(Yao et al., 2016) Fractionate factorial
design
Time of dissolution, volume of dissolution media, pH of dissolution media, and rotation speed
Amount of acetaminophen dissolved during (Romero, Lourenço, 2017)
as recent examples of the utilization of DoE in the development and optimization of analytical methods.
DoE tools help to identify and explain how critical analytical parameters (CAPs) (independent variables)
affects the analytical method performance characteristics
(AMPC) (dependent variables) and, therefore, the
analytical target profile (ATP). MODR may be defined
concerning the AQbD concept. The objective is to define
protocols for method transfer, methodology for validation
of MODR, and define review criteria for evaluation of
QbD based analytical methods. Also, USP Forum has published stimuli articles concerning to application of AQbD concepts.
The challenges for QbD and AQbD implementation include the harmonization of terminologies and concepts, training and education of human resources for industries and regulatory agencies, and the need of guidelines regarding documentation of knowledge generate during pharmaceutical and/or method development.
ACKNOWLEDGEMENTS
This work was supported by FAPESP – Fundação de Amparo à Pesquisa do Estado de São Paulo (São Paulo, Brazil) and CNPq – Conselho Nacional de Desenvolvimento Científico e Tecnológico (Brasília, Brazil).
REFERENCES
Badawi MA, El-Khordagui LK. A quality by design approach to optimization of emulsions for electrospinning using factorial and D-optimal designs. Eur J Pharm Sci. 2014;58:44-54.
Bezerra MA, Santelli RE, Oliveira EP, Villar LS, Escaleira LA. Response surface methodology (RSM) as a tool for optimization in analytical chemistry. Talanta. 2008;76(5):965-977.
Bhutani H, Kurmi M, Singh S, Beg S, Singh B. Quality by design (QbD) in analytical sciences: an overview. Pharma Times. 2014;46(8):71-75.
Bousses C, Ferey L, Vedrines E, Gaudin K. Using an innovative combination of quality-by-design and green analytical chemistry approaches for the development of a stability indicating UHPLC method in pharmaceutical products. J Pharm Biomed Anal.
2015;115:114-112.
Candioti LV, De Zan MM, Cámara MS, Goichoechea HC. Experimental design and multiple response optimization. Using the desirability function in analytical methods development. Talanta. 2014;124:123-138.
Francisco FL, Saviano AM, Pinto TJA, Lourenço FR. Design space of a rapid colorimetric microplate bioassay for bacitracion using response surface methodology (RSM). Curr Anal Chem. 2016;12(6):620-627.
Francisco FL, Saviano AM, Pinto TJA, Lourenço FR. Development, optimization and validation of a rapid colorimetric microplate bioassay for neomycin sulfate in pharmaceutical drug products. J Microbiol Methods. 2014;103:104-111.
Garg NK, Sharma G, Singh B, Nirbhavane P, Tyagi RK, Shukla R, Katare OP. Quality by design (QbD)-enabled development of aceclofenac loaded-nano structured lipid carriers (NLCs): an improved dermatokinetic profile for inflammatory disorder(s). Int J Pharm. 2017;517(1-2):413-431.
Hales D, Vlase L, Porav SA, Bodoki A, Barbu-Tudoran L, Achim M, Tomula I. A quality by design (QbD) study on enoxaparin sodium loaded polymeric microspheres for colon-specific delivery. Eur J Pharm Sci. 2017;100:249-261.
Jamil CRP, Lourenço FR, Ghisleni DDM, Pinto TJA. Development and validation of a microplate bioassay for nystatin using analytical quality by design (QbD) approach. Lat Am J Pharm. 2016;35(8):1871-1876.
Jovanovic M, Rakic T, Tumpa A, Stojanovic BJ. Quality by design approach in the development of htdrophilic interaction liquid chromatographic method for the analysis of iohexol and its impurities. J Pharm Biomed Anal. 2015;110:42-48.
Kovács A, Berkó S, Csányi E, Csóka I. Development of nanostructured lipid carries containing salicylic acid for dermal use based on the quality by design method. Eur J Pharm Sci. 2017;99:246-257.
Krishna MV, Dash RN, Reddy BJ, Venugopal P, Sandeep P, Madhavi G. Quality by design (QbD) approach to develop HPLC method for eberconazole nitrate: application to hydrolytic, thermal, oxidative and photolytic degradation kinetics. J Saudi Chem Soc. 2016;20(Suppl 1):S313-S322.
Lourenço FR, Francisco FL, Ferreira MRS, Pinto TJA, Bou-Chacra NA. Design space approach for preservative system optimization of an anti-aging eye fluid emulsion. J Pharm Pharm Sci. 2015;18(2):551-561.
Lourenço V, Lochmann D, Reich G, Menezes JC, Herdling T, Schewitz J. A quality by design study applied to an industrial pharmaceutical fluid bed granulation. Eur J Pharm Bio. 2012;81(2):438-447.
I. M. Fukuda, C. F. F. Pinto, C. S. Moreira, A. M. Saviano, F. R. Lourenço
Nagi A, Iqbal B, Kumar S, Sharma S, Ali J, Baboota S. Quality by design based silymarin nanoemulsion for enhancement of oral bioavailability. J Drug Del Sci Technol. 2017;40:35-44.
Orlandini S, Paquini B, Caprini C, Del Bubba M, Dousa M, Pinzauti S, Furlanetto S. Enantioseparation and impurity determination of ambrisentan using cyclodextrin-modified micellar electrokinetic chromatography: visualizing the design space within quality by design framework. J Chromatogr A.
2016;1467:363-371.
Ostronoff CS, Lourenço FR. Measurement uncertainty of chromogenic LAL assays: reaction time and proportion of endotoxin and LAL reagent affect release of p-nitroaniline. J AOAC Int. 2015;98(1):51-55.
Peraman R, Bhadraya K, Reddy YP. Analytical quality by design: a tool for regulatory flexibility and robust analytics. Int J Anal Chem. 2015;2015:1-9.
Peres DDA, Ariede MB, Candido TM, Almeida TS, Lourenço FR, Consiglieri VO, Kaneko TM, Velasco MVR, Baby AR. Quality by design (QbD), process analytical technology (PAT), and design of experiment applied to the development of multifunctional sunscreens. Drug Develop Ind Pharm. 2017;43(2):246-256.
Politis SN, Colombo P, Colombo G, Rekkas DM. Design of experiments (DoE) in pharmaceutical development. Drug Develop Ind Pharm. 2017;43(6):889-901.
Pund S, Shete Y, Jagadale S. Multivariate analysis of physicochemical characteristics of lipid based nanoemulsifying cilostazol-Quality by design. Colloids Surf B Biointerfaces. 2014;115:29-36.
Raina H, Kaur S, Jindal AB. Development of efavirenz loaded solid lipid nanoparticles: risk assessment, quality-by design (QbD) based optimization and physicochemical characterization. J Drug Del Sci Technol. 2017;39:180-191.
Romero DC, Lourenço FR. Measurement uncertainty of dissolution test of acetaminophen immediate release tablets using Monte Carlo simulations. Braz J Pharm Sci. 2017;53(3):e00163.
Sangshetti JN, Deshpande M, Zaherr Z, Shinde DB, Arote R. Quality by design approach: regulatory need. Arab J Chem.
2017;10(Suppl 2):S3412-S3425.
Saviano AM, Francisco FL, Lourenço FR. Rational development and validation of a new microbiological assay for linezolid and its measurement uncertainty. Talanta. 2014;127:225-229.
Saviano AM, Francisco FL, Ostronoff CS, Lourenço FR. Development, optimization, and validation of a microplate bioassay for relative potency determination of linezolid using a design space concept, and its measurement uncertainty. J AOAC Int. 2015;98(5):1267-1275.
Shah V, Sharma M, Pandya R, Parikh RK, Bharatiya B, Shukla A, Tsai HC. Quality by design approach for an in situ gelling microemulsion of lorazepam via intranasal route. Mat Sci Enginn C. 2017;75:1231-1241.
Sovàny T, Csordás K, Kelemen A, Regdon Jr G, Pintye-Hódi K. Development of pellets for oral lysozyme delivery by using a quality by design approach. Chem Engin Res Design. 2016;106:92-100.
Terzic J, Popovic I, Stajic A, Tumpa A, Jancic-Stojanovic B. Application of analytical quality by design concept of bilastine and its degradation impurities determination by hydrophilic interaction liquid chromatographic method. J Pharm Biomed Anal. 2016;125:385-393.
Valenzuela-Oses JK, García MC, Feitosa VA, Pachioni-Vasconcelos JA, Gomes-Filho SM, Lourenço FR, Cerize NNP, Bassères DS, Rangel-Yagui CO. Development and characterization of miltefosine-loaed polymeric micelles for cancer treatment. Mater Sci Eng C. 2017;81:327-333.
Verma S, Lan Y, Golhale R, Burgess DJ. Quality by design approach to understand the process of nanosuspension preparation. Int J Pharm. 2009;377(1-2):185-198.
Visser JC, Dohmen WMC, Hinrichs WLJ, Breitkreutz J, Frijlink HW, Woerdenbag HJ. Quality by design approach for optimizing the formulation and physical properties of extemporaneously prepared orodispersible films. Int J Pharm. 2015;485(1-2):70-76.
Yao H, Vancoillie J, D’hondt M, Wynendaele E, Bracke N, De Spiegeller B. An analytical quality by design (aQbD) approach for a L-asparaginase activity method. J Pharm Biomed Anal. 2016;117:232-239.
Yu LX, Amidon G, Khan MA, Hoag SW, Polli J, Raju GK, Woodcock J. Understanding pharmaceutical quality by design. AAPS J. 2014;16(4):771-783.