Platform for Room Acoustics
Research
Marcelo Queiroz
1, Fernando Iazzetta
2, Fabio Kon
1, Márcio Henrique A. Gomes
3,
Fábio L. Figueiredo
2, Bruno Masiero
4, Leo K. Ueda
1,
Luciana Dias
1, Mário Henrique C. Torres
1and Leandro F. Thomaz
11
Department of Computer Science University of São Paulo
{mqz | kon | lku | marioct | lfthomaz}@ime.usp.br
2
Department of Music University of São Paulo [email protected], [email protected]
3
Centro Federal de Educao Tecnolgica de Santa Catarina - CEFETSC/Joinville [email protected].
4
Department of Electrical Engineering University of São Paulo [email protected]
Received 07 January 2008; accepted 04 July 2008
Abstract
This article describes the design, implementation, and experiences with AcMus, an open and integrated software platform for room acoustics research, which comprises tools for measurement, analysis, and simulation of rooms for music listening and production. Through use of afford-able hardware, such as laptops, consumer audio inter-faces and microphones, the software allows evaluation of relevant acoustical parameters with stable and consistent results, thus providing valuable information in the diag-nosis of acoustical problems, as well as the possibility of simulating modifications in the room through analytical models. The system is open-source and based on a flex-ible and extensflex-ible Java plug-in framework, allowing for cross-platform portability, accessibility and experimenta-tion, thus fostering collaboration of users, developers and researchers in the field of room acoustics.
Keywords: room acoustics, musical evaluation, acoustical parameters, impulse response measurement, computer simulation, optimization.
1. I
NTRODUCTIONResearch in computational acoustics encompasses many disciplines, such as design and analysis of musi-cal instruments, physimusi-cal acoustics, room acoustics, and psychoacoustics. Each of these disciplines has its own specific theoretical background, methods, and goals.
In room acoustics, the project of recording studios, home theaters or movie theaters, and especially concert halls has received much attention from research groups and companies. Research focus has usually been placed on engineering and architectural issues rather than on mu-sic listening, and the use of commercial technology and methodology for such projects is still the rule. This is particularly true in developing countries, which depend on imported software, hardware, and qualified human re-sources.
presence, warmth, intimacy, clarity, diffusion, brightness and texture, are fundamental to any room with a musical use.
Several factors influence the quality of what we hear in a room. Controlling these factors is essential to deter-mine what we hear in situations such as concerts, record-ings, electroacoustic music performances and listening to pre-recorded material. D’Antonio [7] indicates as criti-cal factors “the quality of the electronics, the quality and placement of loudspeakers, the hearing ability and place-ment of the listener, the room dimensions (or geometry, if non-cuboid) and the acoustical condition of the room’s boundary surfaces and contents.”
One goal of the AcMus project is to identify and an-alyze acoustical parameters that are relevant to rooms used for music listening and production, such as concert halls, lecture rooms, movie theaters and recording stu-dios. These parameters allow for a quality assessment of such spaces and serve as guidelines in the correction of acoustic problems.
Another goal is to explore simulation techniques which allow the study of acoustic behavior of rooms dur-ing the design phase. This allows experimentation and evaluation of room designs, by modifying design parame-ters in simulation. When the design goals and constraints involve mathematically precise definitions, optimization techniques are available for the automatic search of opti-mal (or near-optiopti-mal) room designs.
The main goal of this article is to present new compu-tational tools to evaluate and manipulate these acoustical parameters, through modern methodologies for software development, such as component-based design, used to build a flexible, extensible and adaptable system. It pro-vides tools for measuring relevant acoustical parameters for rooms used for music listening and recording, and for simulating the acoustic behavior of such rooms, allowing experimentation with specific features such as geometry, acoustic absorption of walls and surfaces, and position-ing of sound sources. It has an open-source implementa-tion and is multi-platform, being freely available for use by architects, musicians and sound engineers, as well as for programmers interested in creating new components to extend its capabilities and customize it to different sit-uations.
The article is organized as follows. Section 2 presents other works and software related to AcMus, and makes explicit the differences and contributions of the latter. Section 3 discusses the main modules of the AcMus in-tegrated platform, namely the Measurement Module, the Simulation Module and the Utilities Module. Section 4 describes the AcMus interface, which is based on Eclipse, a flexible and extensible Java plug-in framework. Practi-cal experience with the AcMus platform on concert halls in the state of So Paulo is reported on Section 5, and
fur-ther works and conclusions are presented on Section 6.
2. O
VERVIEW OFR
ELATEDW
ORKThere are many software packages for measuring im-pulse responses of rooms, calculating acoustical param-eters, simulating the acoustics of room models and per-forming other tasks related to acoustical design and eval-uation of rooms. Most of them are commercial packages designed for a single specific task and run on a single spe-cific computer platform.
WinMLS (www.winmls.com) is a commercial pack-age that runs on MS Windows. It implements techniques for measuring impulse responses (using as input signal swept sines, Maximum-Length Sequences or standard waveforms such as sinusoids, white noise or pink noise), from which it generates information such as Schroeder curve, Frequency Response and several acoustic parame-ters1(RT60, EDT, D50, C80, ST1, IACC, LF, G, among others).
ETF5 (www.etfacoustic.com) and Sample Champion (purebits.com) are other products for impulse response measurements and acoustical parameters evaluation that run on MS Windows and are similar to WinMLS.
Aurora [9] is a suite of freely available plug-ins for the Adobe Audition commercial package, that also runs on MS Windows. It is used for auralization of anechoic musical data using measured impulse responses, through headphones or on a dipole stereo setting (using cross-cancellation techniques). It has a measurement module that uses a swept-sine technique for obtaining the binau-ral impulse response, and also post-processing tools for obtaining acoustical parameters such as RT, Tc, C80, STI, LE and LF, and also performing convolutions and inverse filtering.
Roomsim [5] is an implementation of the Image Source method for simulating impulse responses on cuboid rooms. This is a free, open-source implementa-tion in MATLAB, which is a commercial package that runs on MS Windows, MacOS, Linux and Solaris. It uses frequency-dependent absorption coefficients in its simu-lation, tabulated for 24 building materials, and allows the simulation of mono and binaural impulse responses, as well as head-related effects on the impulse responses.
Several commercial packages for room simulations exist, and most use hybrid methods that combine Image Source with Ray-Tracing techniques. There are interna-tional competitions that explore how well these methods are able to simulate real rooms by comparing acousti-cal parameters obtained by measurements with ones ob-tained by simulations. Competitors of the 3rd Interna-tional Round Robin on Room Acoustical Computer
Simu-1These parameters are defined by the ISO 3382 (1997) standard and will
lations were commercial packages such as CATT, dBRay, EPIDAURE, ODEON, RAMSETE, RAY, RAYNOISE and RAYPID, and other research software with no trade names and no available implementation [30, 4].
RoomOptimizer [7] is a commercial package for the optimal placement of sound sources and listeners in a cuboid room. The problem is defined by trying to obtain the flattest frequency response possible, by trying many positions of sources and listeners and recalculating the impulse response. It uses the Image Source method for simulating the impulse response, and Nelder & Mead’s Simplex heuristic for the optimization problem. It has presets for mono, stereo and 5.1 sound source configu-rations, but uses a single predefined average absorption coefficient for all surfaces.
The AcMus integrated platform has many common features with the above packages, and many differences as well.
AcMus provides both MLS and swept sine techniques for computing impulse responses of rooms, and allows computation of most relevant acoustical parameters, be-ing similar to WinMLS, Aurora and ETF5 in this respect. But it includes another method for obtaining impulse re-sponses based on a logarithmic sine sweep (Log-Sweep FFT).
Additionaly, AcMus is an open-source, fully inte-grated platform for room acoustic research. It runs on many platforms, including Linux, MacOS and MS Win-dows, being written in Java. It also has a graphical IDE that offers flexibility and extensibility through the Eclipse plug-in framework.
Furthermore, the AcMus research project has several independent applications that are scheduled for inclusion in the Eclipse interface environment.
It has simulation methods that employ not only the Im-age Source method (as Roomsim), but also a ray-tracing method that allows simulation of more complex rooms of polyhedral geometry.
It also has global optimization methods that allow optimal placement of sound sources and listeners (as RoomOptimizer), but also allows the search for optimal room designs, by varying room dimensions and acoustic materials of the surfaces.
Ultimately, the AcMus integrated platform will com-bine acoustic measuring tools with acoustic simulation and optimization tools in a single package for room acoustic research and design, allowing free flow of infor-mation between these modules.
3. T
HEA
CM
USP
LATFORMThe AcMus Integrated Platform is composed of sev-eral modules and utilities designed for specific purposes. The main modules are the Measurement module, respon-sible for organizing measuring sessions and extracting
rel-evant acoustical information from actual rooms, and the Simulation module, which aids in the acoustical design of new rooms or modification of existing ones. Other com-putational tools are grouped together in the Utilities mod-ule, which provides several independent tools related to room acoustics.
3.1. MEASUREMENTMODULE
Acoustical Parameters: All relevant physical acous-tic parameters can be determined by the impulse response of the room. This response can be measured by several methods, the simplest of which is to generate a very short burst of sound energy, such as a gun shot or the explosion of a balloon, and recording the output. This is done in order to emulate a perfect impulse (or Dirac’s Delta func-tion). In the sequel the acoustical parameters computed by the AcMus platform are defined.
The most important acoustical measurement is Re-verberation TimeorRT60[23, 1], which is related to the subjective impression ofLiveness. This is a determining factor of the room quality and indicates how long it takes for a sound to decay 60dB after the emission of the sound is interrupted. RT60 values are usually obtained for sev-eral frequency bands, defined by international standards (the AcMus software computes RT60 values for 63Hz, 125Hz, 250Hz, 500Hz, 1kHz, 2kHz, 4kHz and 8kHz). Other measures, such as RT30 or RT20 are used when the signal-to-noise ratio is poor and does not allow for di-rect measurement of RT60. It is also possible to calculate an expected, theoretical value of RT60, given by Sabine’s equation [1], based on the room volume, area and absorp-tion properties of the surfaces and area of the windows.
The Early Decay Time (EDT) represents the decay time for the first 10dB of the initial reverberation curve. It is measured in octave frequency bands.
Definition (D50 or D80)is the ratio of the initial sound energy (corresponding to the first 50 or 80 miliseconds) to the total sound energy, which can be expressed as a function of the sound pressure (p(t)) as
R80ms
0 p
2
(t)dt R∞
0 p
2
(t)dt .
Clarity (C50 or C80) is the logarithmic ratio of the energy within the first 50 miliseconds (for speech) or 80 miliseconds (for music) to the rest of the impulse re-sponse, or
10 log
à R80ms
0 p
2
(t)dt R∞
80msp 2(
t)dt !
.
Clarity and Definition can be defined in terms of each other by the expression
Cτ = 10 log
µ Dτ
1−Dτ
Sound Strength (G)is related to the acoustic impres-sion of sound level, and is defined by the logarithmic ra-tio of the sound pressure of the impulse response to the response of the same source placed 10 meters away in a free field (and, thus, no reverberation), given by
R∞
0 p
2
(t)dt R∞
0 p
2 free(t)dt
.
Support Factor (ST1)is related to the subjective im-pression ofEnsemble and is computed from a measure-ment taken 1m away from a omnidirectional sound source on stage, by the expression
10 log
R100ms
20ms p 2
(t)dt R10ms
0 p
2(
t)dt.
Central Time (Ts)is given by the expression
T s=
R∞
0 t·p 2
(t)dt R∞
0 p
2(
t)dt
and corresponds to the gravity center of the whole im-pulse response, measured in miliseconds. A small value of Ts means that energy is concentrated at the beginning of the impulse response (which helps clarity), while a large value of Ts means that energy is distributed over time, giving the impression of a more reverberant space.
Also important are theBass Ratio (BR)andTreble Ra-tio (TR), which are related to the subjective impressions ofWarmthandBrilliance, and are defined as the relative contribution of respectively low and high frequencies to the overall spectral energy, and are computed from rever-beration times in specific frequencies (denoted byRTfreq).
The bass ratio is defined as
BR= RT125+RT250
RT500+RT1000
,
while the treble ratio is defined by
T R=RT2000+RT4000
RT500+RT1000
.
TheRatio of Direct and Reverberant sound(RDR) is the logarithmic ratio of the energy of the direct sound to the energy of the rest of the impulse response, given by the expression 10 log µ Ed Er ¶ .
The Inter-Aural Crosscorrelation Coefficient (IACC) is the maximum value for the correlation between signals arriving at the left and right ears, and is expressed in val-ues ranging from -1 (left and right signals perfectly out-of-phase) to +1 (identical signals).
Another parameter related to binaural listening is Lat-eral Fraction (LF), given by the ratio between the energy
coming from a lateral plane and the omnidirectional en-ergy received by the same point, expressed as
R80ms
5ms p
2 lat(t)dt
R80ms
0 p
2 omni(t)dt
.
Both IACC and LF together are related to the subjective notion ofSpatial Impression.
The Initial Time Delay Gap (ITDG)is related to the subjective impression ofIntimacyand corresponds to the time interval between the arrival of the direct sound and the first reflection, and is a decisive factor for the acous-tic quality of an environment. It relates to the subjective feeling of intimacy. This is of particular importance for small rooms in which reflective surfaces are too close to the listener, thus making the reflected sound reach the lis-tener immediately after the direct sound. To avoid ex-tremely small values of the ITDG, recording studios use design concepts such as LEDE (Live End Dead End) [8] or RFZ (Reflection-Free Zone) [16]. In the LEDE concept half the room is designed to avoid primary reflections and the other half is designed to enhance diffusion. Rooms based on the Reflection-Free Zone create a spatial zone surrounding the listener which is free of early reflections.
Computing the Impulse Response: Accurate meth-ods for measuring the impulse response consist in gen-erating a reference signal in the room, such as a noise or a sine sweep, measuring the effect of the room on the original signal, and applying spectral methods to recover the impulse response. These methods offer a much better signal-to-noise ratio and allow for repeatability of tests, since they use predefined excitation signals. Two of these methods have been implemented in AcMus: the MLS (Maximum Length Sequency) and a newer method called LSF (Log Sweep FFT), that is based on TDS (Time Delay Spectrometry) [12].
The effect of a room on sound can usually be seen as a linear time-invariant system, characterized by its impulse responseh(t). The Fourier Transform of the impulse re-sponse is called the Transfer Function, or Frequency Re-sponse of the room, and is a functionH(ω)of frequency. The action of the room on a input signalx(t)is expressed in the time-domain as a convolution
y(t) = (x∗h)(t) =
Z ∞
−∞
x(s)h(s−t)ds,
which corresponds, in the frequency-domain, to a multi-plication of the corresponding spectra:
Y(ω) =X(ω)H(ω).
white noise, and shares with it the property of having a flat energy distribution in the frequency domain. The compu-tation of the impulse response by the MLS method takes advantage of this fact and the following properties:
• The cross-correlation of input and output of a linear
system is equivalent to the convolution of the im-pulse response with the auto-correlation of the input. In symbols:
Rxy(t) = (h∗Rxx)(t).
• The auto-correlation function of a single MLS
se-quence of length N approaches a Dirac’s Delta func-tion as N increases: if x(t) is a MLS sequence of length large enough, thenRxx(t)≈δ(t).
• Dirac’s Delta is neutral with respect to convolutions,
i.e.,(x∗δ)(t) =x(t)for any signalx(t).
From these properties it is immediate that the im-pulse response h(t) can be approximated by the cross-correlation of a MLS signalx(t)with the recorded output of the roomy(t):
h(t)≈Rxy(t) =
Z ∞
0
x(s)y(t+s)ds.
A similar argument applies to periodic MLS se-quences, as usually done in practice. The computa-tion of the impulse response by this process uses a Fast Hadamard Transform, which optimizes the processing of matrices generated by cross-correlation.
Another approach to measure an impulse response is the Time Delay Spectrometry (TDS), which consists in aplying a sinusoidal signal with linearly varying fre-quency, and recording the output [12]. The Log Sweep FFT Method (LSF) [9, 18] is an evolution of the TDS that uses a logarithmic sine sweep as excitation signal. It in-creases the signal-to-noise ratio for lower frequencies be-cause its spectrum is analogous to pink noise, as opposed to the almost white noise spectrum of the linear sweep (TDS), and thus gives more time for lower frequencies to build up and for the room to respond to them.
IfX(ω)is the pink spectrum of the LSF signal and Y(ω)is the spectrum of the recorded signal, the transfer function of the room can be obtained by
H(ω) = Y(ω)
X(ω),
and the impulse response by the inverse FFT ofH(ω). This method has the advantage of allowing the elimi-nation of the influence of the loudspeaker: ifL(ω)is the spectrum of the loudspeaker, obtained by measurements in free field (or in an anechoic chamber), the composite
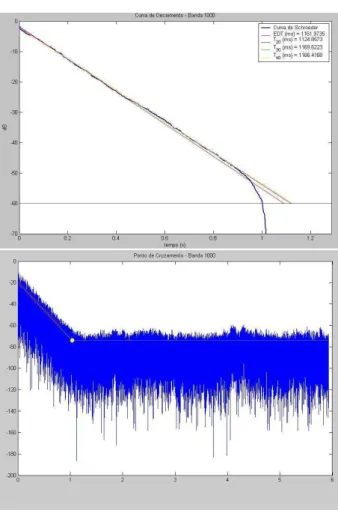
Figure 1. Schrder integration and respective dB decay curve.
system loudspeaker+room acts according to the follow-ing equation:
Y(ω) =X(ω) [L(ω)H(ω)],
and so the transfer function can be easily obtained by
H(ω) = Y(ω)
X(ω)L(ω).
Tests performed with the AcMus platform indicate that LSF has a better signal-to-noise ratio, being more recommended than MLS for low cost systems subject to non-linear responses and critical signal-to-noise ratio.
After the impulse response is computed, the energy decay curve is obtained by the Schrder Integration method (see Figure 1)
E(t) =
Z ∞
t
h2
(s)ds=
Z ∞
0
h2
(s)ds−
Z t
0
h2
(s)ds
3.2. SIMULATIONMODULE
A traditional way of obtaining acoustical parameters of a room is making measurements on-site. When this is not possible, one may build a miniature replica (scale model) and make measurements in the model to obtain approximate values for the real parameters (in the real room). Nowadays, computer models are very popular, and many acoustic consultants use them together with scale models during the design of a new room.
One major concern in the AcMus project is to pro-vide robust models and prediction tools that may be used in simulation without need of directly measuring acous-tic data in a real room or a scale model. This is clearly a necessary condition for the automatic search for an op-timal room design, since a huge number of different de-sign parameters need to be tested, including the position of sound sources and listeners, specific materials for the acoustic treatment of the surfaces, and ultimately even the dimensions or the geometry of the room.
Although the reliability of computer simulations is not completely demonstrated, there are precise conditions un-der which several algorithms are reported to give reliable results for the computation of acoustic parameters, such as reverberation time, early decay time, clarity, defini-tion, lateral fraction and interaural cross correlation co-efficient [10].
The simulation model implements geometrical acous-tics and optimization techniques that allow the assessment of acoustical parameters of room designs and the solu-tion of design problems, such as the optimal placement of sound sources and listeners, and optimal choices of ge-ometry and surface materials to achieve desired acous-tic properties, such as prescribed reverberation times for specific frequency ranges, or minimal harmonic distortion (used in the sense of timbral coloring, as in [7]). For spec-tral properties such as the latter it is desirable to obtain approximations of the frequency response of the room.
Acoustic phenomena such as modal coupling, comb filtering or speaker-boundary interference influence the frequency response of a room, determining amplification or damping of specific frequencies or frequency bands. First, the presented geometrical techniques are discussed for the special case of specular reflection; later, the effect of diffusion is considered (see also [1, 2]).
Modal coupling is a result of the interaction of the sound source and the reflective surfaces of a room. It is as-sociated with the constructive or destructive interferences in sound waves traveling in different directions. Closed specular-reflection paths (loops) have a direct impact on wavelengths that are submultiples of the path length. This interference affects mainly those listening positions lying within the closed paths, though diffusion may blur this effect to adjacent positions. According to how many sur-faces the corresponding closed path hits, room modes are
Figure 2. Modal response of a cuboid room.
called axial, tangential and oblique, and these can be com-puted through the formula
f(nx, ny, nz) =
c
2
s µ
nx
Lx
¶2
+
µ ny
Ly
¶2
+
µ nz
Lz
¶2 ,
where f is the frequency, c is the speed of sound,
(Lx, Ly, Lz) are the room dimensions and (nx, ny, nz)
are integers related to the closed path (see Figure 2). One way to approximate the effect of room modes for particu-lar source and listener positions is to generate paths leav-ing the source in the directions(nxLx, nyLy, nzLz), and
for each path that comes sufficiently close to the listener, calculate the corresponding frequencies and amplification or damping factors.
The term comb filtering is applied to a particular type of interference corresponding to the superposition of the direct sound and the first reflection on a nearby wall, e.g. a wall right behind a loudspeaker, determining a spatial pattern of amplification or damping for each particular frequency and listener position. The distance from the listener to a nearby wall also determines a comb filtering effect due to the interference of the direct sound and the sound reflected on the wall behind his/her head.
More generally speaking, it is relatively easy to con-sider all early reflections that reach the listener from a particular sound source. This done by geometrical acous-tic methods that identify sound paths in a room. These paths may include those interference paths responsible for modal coupling and comb filtering effects, but also more general sound paths.
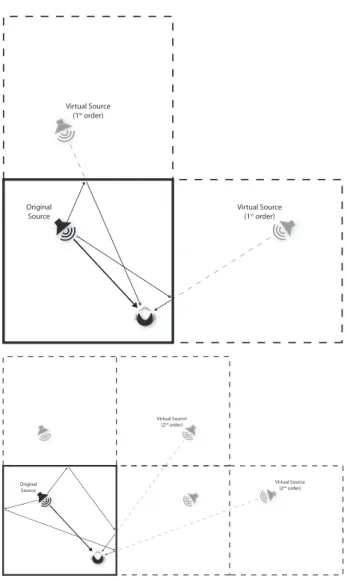
Geometrical Acoustics: Two popular methods for the acoustical simulation of sound reflections based on geometrical models are ray-tracing and virtual image source [29, 7, 22].
Virtual Source (1st order)
Original Sourcee
Virtual Source (1st order)
Original Source
Virtual Source (2nd order)
urce er))
ce
Virtual Source (2nd order)
Figure 3. First and second order virtual image sources and corresponding paths inside the real room.
path, suffering a specular reflection at each wall it tra-verses. By applying damping factors to the energy of the ray at each reflection (given by the absorption co-efficient of the wall), and also considering the absorp-tion of the air (related to the square of the distance), one can build an echogram, which is a map of all reflections, along with corresponding delays and energy values. This echogram is related to the impulse response of the room, and can be used to obtain the acoustical parameters or a proper impulse response and its corresponding frequency response [17].
According to the image source model, a sound ray that is reflected by a wall is identical to a direct ray coming from a virtual source, located on the other side of the wall, at the same position as the specular image of the original source, as in Figure 3.
One can think of a free field with many virtual image sources (specular reflections of the original source), that
irradiate the same signal in a synchronized fashion. The simulation can be performed by tracing direct paths from the virtual sound sources to the listener, and multiplying the response factor by the reflection coefficient of each wall that the path traverses.
This approach is closely related to the ray-tracing method, with the difference that by using image sources fewer rays are actually generated that never reach the lis-tener. Both techniques can also be combined in a hybrid ray-tracing/virtual image method, by using image sources for early reflections (with increased accuracy) and ray-tracing for later reflections (with improved computational performance) [29].
Calculating the position of the images is trivial in the case of cuboid rooms, but is computationally expensive for complex geometries, especially if the walls are highly reflective. In this case, the number of images increases exponentially with the number of reflections. This re-stricts the application of the virtual image method to home theaters, small recording studios and concert rooms with very simple geometries.
Note that both virtual image source and ray-tracing techniques do not deal directly with modal effects, which may limit their application to higher frequencies or large rooms. On the other hand, responses obtained with the image sources method may help identify comb filtering problems [29, 7].
The techniques above provide a simulated impulse re-sponse that allows computation of the acoustic parameters with the same methods mentioned in the previous section. It also allows the experimentation of alternative room de-signs, by changing the description of the room, including its geometry, acoustic properties of the surfaces, position of sound sources and listeners, etc.
Optimization: By establishing specific design goals it is possible to automatically search for optimal de-sign parameters, for instance using optimization tech-niques [31, 7, 20]. At each step in the search algorithm, a new impulse response is obtained by geometrical acous-tic techniques and then the acousacous-tic parameters and the frequency response can be computed.
The main goal in the optimization module is to min-imize the harmonic distortion of the room, which implies timbral coloring and might be undesirable under critical listening conditions. The main design variables consid-ered here are the room dimensions and reflection coeffi-cients of the surfaces (walls, floor, ceiling), where ranges for possible room dimensions, reflection coefficients and positions of sound sources and listeners are given.
flat-ness, such as the standard deviation or least-squares errors of the frequency response [7]. An alternative is asking for a frequency response that resembles as close as possible a given ideal frequency response, not necessarily flat. An-other alternative is trying to match as close as possible the reverberation times for specific frequency ranges to a pre-established reverberation curve.
All these criteria correspond to minimizing the devi-ation of a function obtained by simuldevi-ation from a given ideal function, thus defining analogous optimization prob-lems that can be solved with the same techniques.
The overall optimization goal may also be stated in various forms. One of them is the problem of optimally placing sound sources and listeners in specific positions in such a way that harmonic distortion is minimized. An-other possibility is to determine room attributes, such as geometry or acoustical properties of the surfaces, so that harmonic distortion is improved in several listening posi-tions.
Suppose that the range of possible source positions is described by a set S (stage) and the range of possible lis-tener positions is described by a set A (audience). Let D describe the set of feasible room attributes (including geometry and surface absorption coefficients).
To optimize the harmonic distortion in the average case (i.e. in an average source-listener pair) the harmonic distortion must be integrated over all possibles∈S and
l∈A.
Another possibility is to optimize the worst-case sce-nario, i.e., trying to guarantee that the worst possible com-bination of source and listener positions will have a mini-mal harmonic distortion. This is achieved by minimizing the supremum of the harmonic distortion over all possible s∈Sandl∈A.
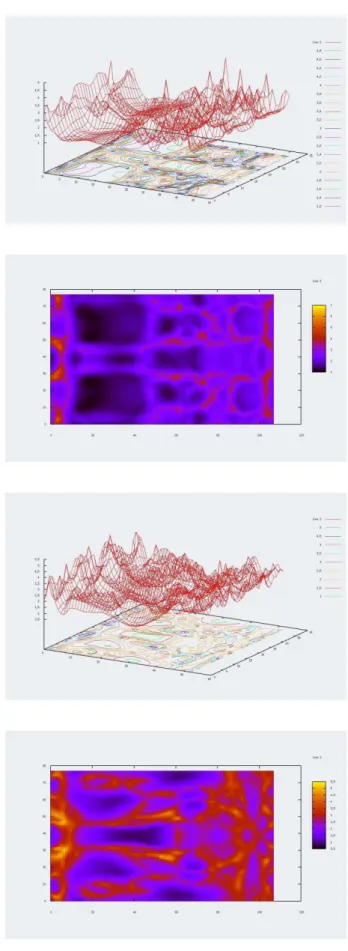
Figure 4 shows typical graphs of the harmonic distor-tion as a funcdistor-tion of listening posidistor-tions. Values of devi-ation from flatness are shown on a horizontal plane situ-ated at the ear level of a sesitu-ated listener. It is easy to see that function values have few regions of relative flatness (sweet spots), displaying wide variations on most of the room.
In any case all problems have the following ties: lack of closed formulas and convexity-like proper-ties for the objective functions and mixing of continu-ous and discrete decision variables that lead to a combi-natorial behavior or the problem. The algorithms used are global optimization heuristics that combine stochas-tic methods with local optimization procedures. This ap-proach has great relevance since the objective functions involved have too many local minima with values that are very far from the true optimal value.
Two optimization algorithms have been implemented: the Density Clustering method [26] and a Grid-based lo-cal search [19].
Density Clustering is a stochastic optimization heuris-tic that has two phases: the global phase generates random feasible points using a uniform distribution on the feasible set, and evaluates the objective function on these points; the local phase applies a local optimization procedure on a subset of the feasible points, corresponding to those with better objective function values. This generates a set of lo-cal minima, around which clusters are defined, according to critical distance criteria. These clusters save computa-tion on future rounds of the global phase, by discarding points that lie in the neighborhood of a previously known local minimum.
The local optimization procedure used in the local phase in the current implementation is the Grid-Based search. This is a deterministic method that looks for lo-cal minimizers on a discrete grid of feasible points, by moving through adjacent points with decreasing function values until a minimum (on the grid) is found. The outer iteration is responsible for subdividing the grid, thus al-lowing refinement of the solution and guaranteeing con-vergence of the method.
Computational tests have been conducted for the opti-mal placement of sources and listener in idealized rooms, and compared to similar tests made with the Room Opti-mizer [7]. Although the results are preliminary [20], it has been verified that the Grid method obtains consistently better points than the Simplex method used in Room Op-timizer. The Density Clustering heuristic tends to refine the solution of the Grid search by finding many local min-ima and selecting the best of them. Although it takes more time, it increases the probability of finding better local minima, or eventually the true global optimum.
The bottleneck of the optimization procedure still is the acoustic simulation, since every evaluation of the ob-jective function requires its own simulated impulse re-sponse. To avoid repeating costly simulations and save computation, the Grid method collects all known points where previous simulations have been performed, to-gether with their objective function values. The practi-cal impact of this strategy is nevertheless very limited, specially for the Density Clustering method, which usu-ally has to evaluate hundreds of different designs for each problem.
3.3. UTILITIESMODULE
This module offers functions for specific tasks relat-ing to acoustic measurement and simulation or the acous-tical design of rooms, as well as functions for generating many types of audio signals, filtering and spectral analy-sis. Many tools have been implemented as independent Java applications and are gradually being included in the AcMus integrated platform.
For instance, Figure 5 shows a module for obtaining reverberation times of a room, given the room dimensions and a description of the materials of the surfaces. Another
module computes the modal response of a cuboid room based on the same data, and was shown on Figure 2.
Figure 5. Reverberation times of a room.
There is also a graphical tool that allows comparison of two waveforms, and a convolution tool that may be used for auralization. Other specific modules follow:
Calculation of Sound Propagation Speed: the speed of sound is affected by several environmental factors, such as relative humidity and temperature. This module imple-ments a simple formula for obtaining the speed of sound as a function of these values.
Design of Schröder diffusers: The resonance modes for lower frequencies (up to 300Hz) are important for the acoustical characterization of a room. On the other hand, the diffusion and reflection patterns are of greater importance for medium and high frequencies [21]. Ide-ally, the overall acoustic quality of a room increases with the homogeneity of diffusion factors. In order to solve the problem of lack of reflection from side walls in con-cert rooms, Manfred Schröder designed a highly diffusing surface [24] that can be used in critical hearing conditions, such as concert rooms and recording studios. It consists of evenly spaced wells of different depths, that depend on the frequency range that the diffuser is supposed to affect. Helmholtz absorbers: the control of low frequencies within a room based solely on the treatment of surfaces or the geometry is particularly difficult. For specific low frequencies it is recommended to use tuned absorbers to avoid prominent resonances below 200Hz. Helmholtz ab-sorbers are well-suited to this task, and can be designed with this tool.
4. I
MPLEMENTATIONis intended to promote exchange of results with other research groups, the software is based on open source codes, and in the same spirit, whenever possible open source codes and algorithms from other research groups are also used. This relates to the requirement that the sys-tem be platform independent, and for this reason it has been mostly developed in Java, running easily on Linux, MacOS and MS Windows.
The system is organized in modules, that are inte-grated in a way that allows seamless flow of data, regard-less of the variety of data types and structures involved in the system.
The implementation is based on the sophisticated Eclipse platform (www.eclipse.org), which is a powerful, generic, extensible, open set of computer tools for devel-oping programs. It has the same basic purpose of any other IDE (Integrated Development Environment), such as Visual Studio, Delphi or NetBeans, but goes beyond by providing a foundation for constructing and running con-tributed plug-ins written in Java, allowing it to be largely extended. Plug-ins are pieces of programs with a defined structure that add functionality to the platform, and may define extension points to let other plug-ins extend it. Al-most the entire platform is built upon this model, even its main subsystems, resulting in a highly extensible system. The AcMus software is implemented as a set of Java plug-ins integrated into the Eclipse platform, which facil-itates the system’s extensibility and flexibility, enabling the construction of an open platform for acoustics exper-imentation that is freely available to researchers in the field.
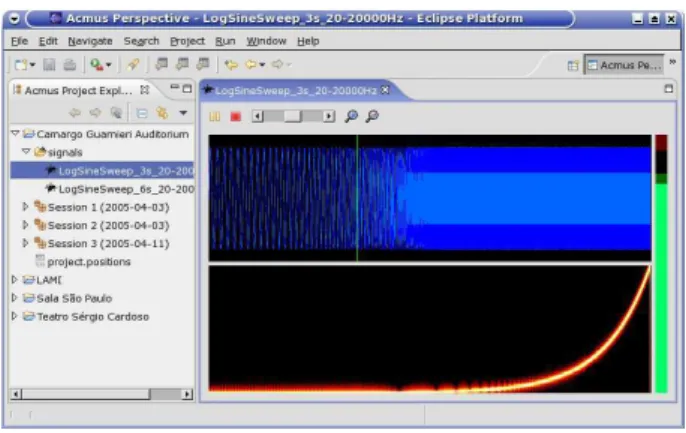
Figure 6 displays the audio player, which shows a log-arithmic sine sweep signal used for measurements. The upper part shows the audio signal, and the lower part shows the time-varying spectrum of this signal.
Figure 6. Audio player showing a logarithmic sine sweep.
In a measurement, a microphone and a loudspeaker, representing a listener and a sound source, are placed at chosen positions inside a room. The software then feeds
the loudspeaker with a signal and at the same time the microphone captures the room’s response to this sound. After that, the software processes this recording to cal-culate parameters that describe acoustic characteristics of the room for that particular position of listener and source. Usually these measurements are taken in a large number of positions and repeated several times. A major concern of the implementation effort has been the quality of the user interface, trying to lessen the burden of taking count-less measurements in a room.
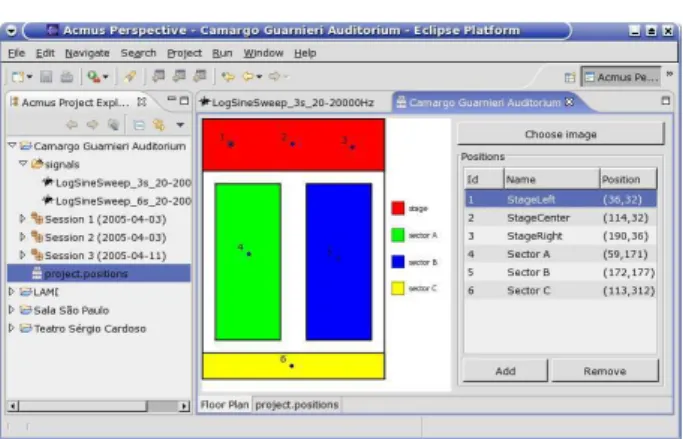
The Measurement module takes advantage of the Eclipse Resources Plug-in to let the user store measure-ments taken from different rooms in hierarchical folders (Figure 7). The Projectfolder represents a room (the
Figure 7. Hierarchical organization of folders in Measurements module.
Carmargo Guarnieri Auditorium in the example). The
Session folder groups measurements taken in the
same period (in the example there are two sessions on april 3rd and another session on april 11th 2005). The
Setfolder stores repeated measurements on the same spot (e.g. SectorA x StageCenter in the Figure), which improves reliability of the results. The Measurement
folder stores the audio file of the room’s impulse response for each individual take and the output of the response analysis.
The Measurement Module provides wizards for the creation of each kind of folders. The user may input ad-ditional information about the new folder such as date, time, equipment, comments, and so on. Figure 8 depicts the wizard for the creation of a Session folder.
Inside each project folder there is a file called
project.positions, that keeps a list of microphone and loudspeaker positions in a graphical representation of the floor plan of the room (Figure 9), which provides docu-mentation and helps manage the measurements.
re-Figure 8. TheSessioncreation wizard.
Figure 9. Graphical representation of theproject.positionsfile.
sponse, in the signalsfolder. The software provides a wizard (Figure 10) that creates logarithmic sine sweeps from parameters given by the user, such as initial and end-ing frequencies and total duration of the signal. A user may also use any other audio file as input signal, keeping in mind that it directly affects the quality of the impulse response obtained.
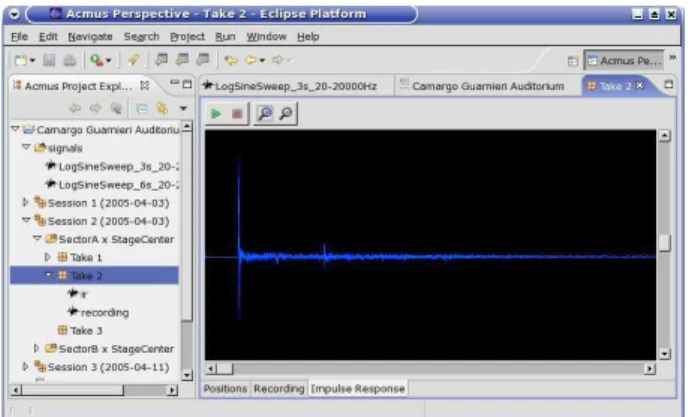
The Measurement interface (Figure 11) displays the chosen input signal and allows the recording of the room response to that signal. The software also records the sig-nal sent to the loudspeakers, which is taken as a reference to sync the signal that is captured by the microphones. The “Calculate IR” button performs a spectral processing of both recorded signals, producing the impulse response of the room (Figure 12), for that measurement.
Before calculating the acoustic parameters from the impulse response, the software offers the possibility of
Figure 10. TheSignalwizard.
Figure 11. Measurement interface displaying the original signal on the upper part and both recorded signals on the lower part.
applying some treatment to the signal, such as the meth-ods of Lundeby [28], Chu [6] and Hirata [13]. After this treatment, the software calculates the following acous-tic parameters: reverberation time (RT), early decay time (EDT), sound strength (G), clarity (C), definition (D), center time (Ts), bass ratio (BR) and treble ratio (TR), as shown in Figure 13.
5. P
RACTICALS
TUDIESAmong the goals of the practical studies is the inves-tigation of the relation between objective acoustic param-eters that can be determined by measurements and spe-cific calculations, and subjective acoustic parameters, as determined by individuals’ sensitivity and perception in specific listening and performing environments [14].
Terms that are commonly used in the evaluation of concert halls include liveness, warmth, brilliance, inti-macy, clarity, definition and spatial impression, and have been studied in comparison with the objective, measur-able parameters by Beranek [1].
Figure 12. Impulse response obtained by spectral processing of the recorded signal.
Figure 13. Acoustic parameters obtained from an impulse response.
halls in the state of São Paulo that carry regular perfor-mances of chamber and symphonic ensembles, and relat-ing the measurements to subjective evaluations made by professional musicians according to their psychoacoustic sensitivity.
The following system was used for the tests: a lap-top PC computer (Pentium 4, 1.6GHz, 120MB RAM), M-Audio Duo and Edirol FA-101 digital audio inter-faces, Berhinger ECM 8000 and Neumann U-87 omni-directional microphones and self-powered Electro-Voice Sx200a loudspeakers.
Measurements were carried out in several concert halls in the city of So Paulo (Anfiteatro Camargo Guarnieri, Teatro de Diadema, Teatro do Memorial da Amrica Latina, Theatro Municipal de So Paulo, Teatro So Pedro and Teatro Srgio Cardoso). Three of them will be discussed in the sequel: Theatro Municipal de So Paulo, which hosts the Orquestra Sinfnica Municipal, Teatro So Pedro, former headquarter of OSESP and Anfiteatro Ca-margo Guarnieri, which hosts the University’s Symphony Orquestra (OSUSP).
These halls have different architectural and acoustical
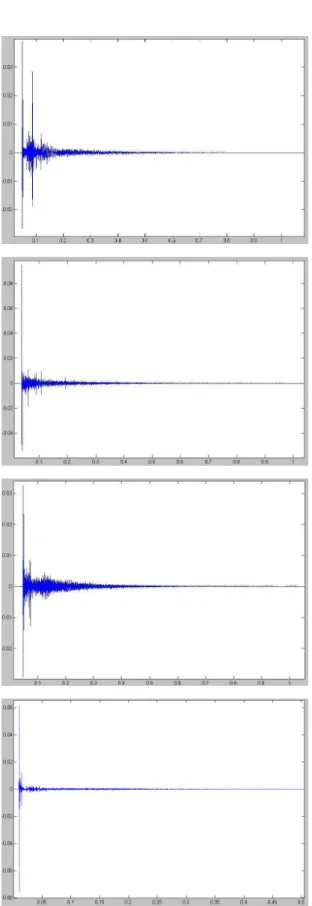
characteristics. The Theatro Municipal holds 1500 peo-ple in a Italian-style shaped audience, has a significant part of the floors covered by carpets, offers 4 floors for the audience and has therefore a very high ceiling. Teatro So Pedro holds about 700 people in a shell-shaped audi-ence, and its surfaces are mainly of masonry. Anfiteatro Camargo Guarnieri also holds about 700 people, but its shape is rectangular and its walls are covered with wood. Figure 14 shows impulse responses taken in different positions in these three theaters. Patterns change consid-erably for different positions in the same theater. As a rule, stage measurements produce short and dry impulse responses as opposed to measurements made in the cen-ter of the audience. This is explained respectively by the directivity of the source and the higher amount of reflec-tion.
Many measures were taken for each position, and pa-rameters were calculated in two ways: taking the average of each parameter for every impulse response, and cal-culating the parameters of an averaged impulse response. Figure 15 shows a comparison of values for Clarity (C80) on the main floor of Anfiteatro Camargo Guarnieri com-puted with both methods. The maximum standard devia-tion was 4.2% for frequencies above 125Hz.
The MLS and LSF methods have presented very simi-lar impulse responses and gave practically the same pa-rameter values. A typical comparison for these differ-ences can be observed in Figure 16, comparing RT60 val-ues obtained with the two methods in a stage position in Anfiteatro Camargo Guarnieri.
Since this analysis aims at investigating rooms de-signed for musical performance, it was taken into con-sideration the directionality of sound emission observed in musical instruments. Measurements were carried out using a directional source to stimulate the room, and re-sults were compared to measurements done with omnidi-rectional sources to investigate the impact of this factor.
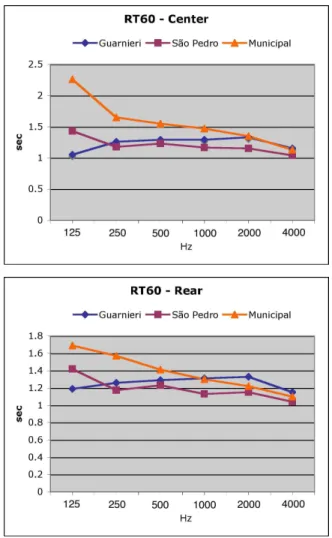
Reverberation times for all theaters can be seen in Figure 17. It can be seen that Theatro Municipal and Teatro So Pedro presented high reverberation times in the low frequency range, which is due to the high ceil-ing in the first case and the masonry walls in the second, as opposed to the Anfiteatro Camargo Guarnieri with its wooden walls that help diffusion. For higher frequencies these values tend to converge to a single value.
Figure 14. Some measured impulse responses: (a) lateral main floor and (b) central main floor in Theatro Municipal, (c) stage in Anfiteatro
Camargo Guarnieri and (d) balcony of Teatro So Pedro
Figure 15. Averages of IRs versus averages of parameters.
Figure 16. RT60 values obtained with MLS and LSF signals.
opposed to the two other halls. In Theatro Municipal and Teatro So Pedro the balconies act as barriers for reflec-tions coming from above [3], which explains their higher values of Clarity.
With respect to frequency ratios (Figure 19), the An-fiteatro Camargo Guarnieri proved to be more balanced, whereas the large carpet surfaces in Theatro Municipal collaborate in the reduction of brightness.
Figure 17. Reverberation times on the center and back of the audience.
Clarity and Definition on the stage tend to have larger values than on the audience. This is a desirable charac-teristic both for the conductor as well as for musicians playing in chamber ensembles. ITDG values are lower in the stage (average of 4ms) than in the audience (aver-age of 13ms). In the back of the audience the impulse responses indicate a higher diffusion and lower values for the direct/reverberant energy ratio.
The Ratio of Direct to Reverberant sound energy (RDR) was computed using musical samples instead of reference signals. This allowed psychoacoustical compar-isons of the same musical piece heard on different parts of a theater. RDR values are regarded as correlated to the subjective impression of intimacy [14]. It can be seen from the measurements (Figure 20) of several theaters that average RDR values become smaller as a function of distance from the source, ranging between 80% and 90% on the stage, 60% and 70% at the front seats, and floating around 30% at the back seats, with few exceptions. It is noticeable that RT60 values do not follow the same
pat-Figure 18. Clarity (C80) values on the center and back of the audience.
tern, suggesting that RDR values also play a role in the subjective perception of reverberation.
Table 1 summarizes the data collected on these the-aters, and allow cross-comparisons of previous figures. Each column describes a different theater, showing their values for the C80, RT60, BR/TR and RDR parameters. The first section of the table gives general information about each theater. The next section corresponds to pa-rameters obtained at a central seat, and the last section to a back seat at the audience of the theaters. The table shows frequency-dependent values for three representa-tive frequencies (250Hz, 1000Hz and 4000Hz).
6. C
ONCLUSIONS ANDF
URTHERW
ORKTheatro Municipal Teatro So Pedro Anfiteatro Camargo Guarnieri
Characteristics
seats 1500 636 360
dimensions (m) 23.00 x 24.00 9.60 x 15.50 21.41 x 28.30
surfaces carpet masonry wood
Parameters (center)
C80 (dB) 250Hz 0.290 2.570 4.000
1000Hz 6.950 5.430 7.140
4000Hz 10.670 8.250 11.240
RT60 (s) 250Hz 1.646 1.183 1.256
1000Hz 1.463 1.171 1.293
4000Hz 1.122 1.037 1.159
BR 1.341 1.060 0.890
TR 0.793 0.862 0.931
RDR (front) 81.087% 55.217% 61.087%
Parameters (rear)
C80 (dB) 250Hz 2.538 6.118 -2.115
1000Hz 7.451 8.423 5.725
4000Hz 9.769 11.615 7.577
RT60 (s) 250Hz 1.565 1.174 1.261
1000Hz 1.291 1.132 1.313
4000Hz 1.094 1.038 1.153
BR 1.119 1.175 0.924
TR 0.862 0.952 0.972
RDR 29.565% 25.870% 16.596%
Table 1. Summary of measurements for Theatro Municipal de So Paulo, Teatro So Pedro, and Anfiteatro Camargo Guarnieri
research and brought together researchers with comple-mentary backgrounds from several research institutes.
The AcMus project is work-in-progress, and hope-fully for a long time: though much has been achieved during its first 5 years, many ideas and sub-projects are being developed at the time of writing or planned for fu-ture implementation.
The measurement module is by far the most advanced one, having been tested and used by other researchers not involved with the AcMus project.
The simulation module is still somewhat scattered in many independent applications, with no integrated inter-face built into the Eclipse plug-in environment. The code of these applications is being translated at the time of writ-ing and will be available soon.
Many improvements are under study for this module. For instance, absorption coefficients for different acoustic materials are available as functions of frequency, but as a rule geometrical models use mean values of these pa-rameters. The consideration of a more realistic model of absorption makes the implementation considerably more complex, but the advantages for enhancing the simulation
for frequency-dependent processing (such as estimating the harmonic distortion) are clear. The absorption coeffi-cient also varies with the incidence angle of a sound ray, and that could be taken into account.
Other factors that might improve the quality of sim-ulated impulse responses is the treatment of sound diffu-sion and diffraction. Each natural property of sound prop-agation increases realism of the simulation at the expense of ever-increasing computational complexity. Part of the job of designing any simulator is to analyze the trade-off between quality and time, which for acoustic purposes al-ways involves the question of what exists in theory versus what is really felt subjectively (psychoacoustically).
An implementation of a ray-tracing technique for polyhedral geometries is under current development. It will allow a more thorough comparison of simulated im-pulse responses with measured ones for concert rooms, such as the ones here presented, which do not have cuboid geometries.
pre-Figure 19. Bass and Treble Ratios.
processing of the impulse responses obtained by geomet-rical methods is necessary to guarantee that auralized sig-nals will not sound sterile, artificial or have artifacts (i.e. that they will be psychoacoustically credible).
ACKNOWLEDGMENTS
This work has been supported by CNPq and FAPESP grant 02/02678-0.
R
EFERENCES[1] L. L. Beranek. Music, Acoustics and Architecture. John Wiley and Sons, 1962.
[2] L. L. Beranek. Concert hall acoustics - 1992. Jour-nal of the Acoustical Society of America, 92(1):1– 39, 1992.
[3] L. L. Beranek. Concert Halls and Opera Houses: Music, Acoustics and Architecture. Springer Verlag, 2004.
[4] I. Bork. Report on the 3rd round robin on room acoustical computer simulation - part i: Measure-ments. Acta Acustica united with Acustica, 91:740– 752, 2005.
[5] D. Campbell; K. Palomäki; G. Brown. A matlab simulation of ’shoebox’ room acoustics for use in research and teaching. Computing and Information Systems Journal, 9(3):48–51, 2005.
[6] W. T. Chu. Comparison of reverberation measure-ments using schröder’s impulse method and decay-curve averaging method. Journal of the Acoustical Society of America, 63(5):1444–1450, 1978.
Figure 20. RDR values for stage, center and rear audience in several theaters.
[7] P. D’Antonio; T. J. Cox. Room optimizer: A com-puter program to optimize the placement of listener, loudspeakers, acoustical surface treatment and room dimensions in critical listening rooms. In Proceed-ings of the 103rd Convention of the Audio Engineer-ing Society, Preprint 4555, Paper H-6, 1997.
[8] D. Davis; C. Davis. The LEDE concept for the con-trol of acoustic and psychoacoustic parameters in control rooms. Journal of the Audio Engineering Society, 28(9):585–595, 1980.
[9] A. Farina. Simultaneous measurements of impulse response and distortion with a swept sine tech-nique. InProceedings of the 108th AES Conference, France, 2000.
[10] M. H. A. Gomes; M. Vorländer; S. N. Y. Gerges. Measurement and use of scattering coefficients in room acoustic computer simulations. In Proceed-ings of the Acustica 2004, 2004.
[11] F. Arruda; R. Guedes. A influência da direcionali-dade de fontes sonoras na avaliação experimental da qualidade acústica de salas. InProceedings of the XIX Meeting of the Brazilian Society of Acoustics, 2000.
[12] R. C. Heyser. Acoustical measurements by time de-lay spectrometry. Journal of the Audio Engineering Society, 1967.
[14] F. Figueiredo; F. Iazzetta. Parâmetros acústicos em salas de música: análise de resultados e novas inter-pretações. InAnais do 4.o Congresso de Engenharia de Áudio. São Paulo: Audio Engineering Society -Seção Brasil, pages 66–71, 2006.
[15] L. K. Ueda; F. L. Figueiredo; F. Iazzetta; F. Kon. A user-friendly graphical system for room acoustics measurement and analysis. InAnais do 10.o Simpó-sio Brasileiro de Computação Musical. Belo Hori-zonte: Sociedade Brasileira de Computação, pages 118–129, 2005.
[16] P. D’Antonio; J. H. Konnert. The RZF/RPG ap-proach to control room monitoring. InProceedings of the 76th Convention of the Audio Engineering So-ciety, Preprint 2157, Paper I-6, 1984.
[17] H. Kuttruff.Room Acoustics. Elsevier Applied Sci-ence, 1991.
[18] S. Müller; P. Massarani. Transfer function measure-ments with sweeps. Journal of the Audio Engineer-ing Society, 49:443, 2001.
[19] I. D. Coope; C. J. Price. On the convergence of grid-based methods for unconstrained optimiza-tion. SIAM Journal on Optimization, 11(4):859– 869, 2001.
[20] L. Dias; M. Queiroz. Localização de fontes e ou-vintes em salas de escuta. InAnais do 10.o Simpó-sio Brasileiro de Computação Musical. Belo Hori-zonte: Sociedade Brasileira de Computação, pages 130–141, 2005.
[21] J. H. Rindel. Diffusion of sound in rooms - an overview. InProceedings of the 15th International Congress on Acoustics, Trondheim, Norway, pages 633–636, 1995.
[22] J. H. Rindel. The use of computer modelling in room acoustics.Journal of Vibroengineering, 3(4):41–72, 2000.
[23] M. R. Schröder. New method for measuring rever-beration time. Journal of the Acoustical Society of America, 37:409–412, 1965.
[24] M. R. Schröder. Diffuse sound reflection by max-imum length sequences. Journal of the Acoustical Society of America, 57:149–151, 1975.
[25] M. H. A. Gomes; S. N. Y. Gerges; R. A. Tenen-baum. On the accuracy of the assessment of room acoustics parameters using mls technique and nu-merical simulation.Acustica united with Acta Acus-tica, 86(5):891, 2000.
[26] A. H. G. Rinnoykan; G. T. Timmer. Stochas-tic global optimization methods. Part I: Clustering methods. Mathematical Programming, 39:27–56, 1987.
[27] J. Vanderkooy. Aspects of MLS measuring sys-tems. Journal of the Audio Engineering Society, 42(4):219–223, 1994.
[28] A. Lundeby; T. E. Vigran; H. Bietz; M. Vorländer. Uncertainties of measurements in room acoustics. Acustica, 81:344–355, 1995.
[29] M. Vorländer. Simulation of the transient and steadystate sound propagation in rooms using a new combined ray-tracing/image-source algorithm. Journal of the Acoustical Society of America, 86(1):172–178, 1989.
[30] M. Vorländer. International round robin on room acoustical computer simulations. In Proceedings of the International Conference on Acoustics 1995, Norway, 1995.