Ciência Rural, v.48, n.3, 2018.
Rust effect estimation in soybean crosses for tolerance to Asian rust
Estimativa do efeito ferrugem em cruzamentos de soja para tolerância à ferrugem asiática Fernanda Aparecida Castro Pereira1* Natal Antonio Vello2
Gabriela Antônia de Freitas Rocha2 Claudinei Antonio Didoné2
ISSNe 1678-4596
Received 06.19.17 Approved 01.11.18 Returned by the author 02.15.18
INTRODUCTION
Genetic resistance of soybean cultivars to Asian rust is a key component of integrated management for disease control (HARTMAN et al., 2005; YORINORI et al., 2009). Genetic resistance is a defense response mechanism that counters the
aggressiveness of the causal agent. Exploration of
vertical resistance has led to the identification of
some of the major genes that control resistance to Asian rust (CALVO et al., 2008; MONTEROS et al., 2007, LI et al., 2012). However, these genes are no longer effective against the fungus strains present in Brazilian crops, since the fungus expresses high 1Departamento de Biologia, Universidade Federal de Lavras (UFLA), Campus Universitário, 37200-000, Lavras, MG, Brasil. E-mail:
[email protected].*Corresponding author.
2 Departamento de Genética, Escola Superior de Agricultura Luiz de Queiroz (ESALQ), Universidade de São Paulo (USP), Piracicaba, SP, Brasil.
ABSTRACT: Asian soybean rust is an important disease that has deeply troubled farmers and researchers since it was first reported. The
causal agent, biotrophic fungus Phakopsora pachyrhizi Sydow & P. Sydow, has found extremely favorable conditions for its dissemination in Brazil. The most characteristic symptom of infection appears in the leaves, initially on the adaxial leaf surface, as small angular points less than 1mm in diameter, together with gray-colored uredospores (spores). Management involves a set of practices that guarantee coexistence between the plant and the pathogen without significant damage to the crop. The objective of this research was to evaluate tolerance to Asian rust by estimating losses caused by natural infection in the field. Experiments with generation F4 (2014/15) plants were established in a
randomized blocks design with four replicates, with two types of genotypes (crosses and parents) and two schemes for disease management
using fungicides. For analysis of the data, a test was applied on two dependent samples to verify the significance of the estimate of the rust effect. With regard to grain yield and tolerance, the most outstanding crosses were 104 (USP14-01-20 × EMGOPA313) and 149 (USP93-05.552 × EMGOPA313). Crosses 147 (USP93-05552 × PI153.282) and 137 (USP70.108 × PI153.282) were graded as tolerant in the evaluation of both yield reduction and seed size. We found evidence of tolerance to Asian rust in both crosses and parents. The statistical test revealed the significance of the rust effect estimates in soybean.
Key words: Glycine max, Phakopsora pachyrhizi, partial diallel, paired t-test, rust managements with fungicides.
RESUMO: A ferrugem asiática da soja é a doença que mais tem preocupado os produtores e pesquisadores desde sua primeira evidência.
Ela é causada pelo fungo biotrófico Phakopsora pachyrhiziSydow & P. Sydow que encontrou condições extremamente favoráveis para a sua disseminação no Brasil. O sintoma mais característico apresenta-se nas folhas, inicialmente na face adaxial, como pequenos pontos angulares com menos de um milímetro de diâmetro, juntamente com os uredósporos (esporos) de coloração acinzentada. O manejo se dá por meio de um conjunto de práticas que garanta a boa convivência entre a planta e o patógeno e sem que ocorra danos significativos à lavoura. O trabalho objetivou avaliar a tolerância à ferrugem asiática estimando as perdas causadas pela infestação natural a campo. Os experimentos com a geraçãoF4 (2014/15) foram delineados em blocos ao acaso com quatro repetições. Foram realizadas categorias de experimentos,
envolvendo dois tipos de genótipos (cruzamentos e genitores) e dois tipos de manejos de doenças com fungicidas. Para a análise dos dados foi aplicado um teste, para duas amostras dependentes, a fim de verificar a significância da estimativa do efeito ferrugem. Considerando a produtividade e a tolerância, os cruzamentos mais importantes foram 104 (USP 14-01-20 x EMGOPA 313) e 149 (USP 93-05.552 x EMGOPA 313). Os cruzamentos 147 (USP 93-05.552 x PI 153.282) e 137 (USP 70.108 x PI 153.282) foram tolerantes tanto na avaliação de redução da produtividade e do tamanho de semente. Houveram evidências de tolerância à ferrugem asiática nos cruzamentos e nos genitores. O teste estatístico revelou a significância das estimativas de efeito ferrugem em soja.
Palavras-chave: Glycine max, Phakopsora pachyrhizi, dialelo parcial, teste t pareado, manejo da ferrugem com fungicidas.
variability and climatic conditions in the country are highly favorable for its development.
An alternative way to minimize the impact of soybean rust on crop productivity is to develop tolerant lines. Tolerance is the ability of the plant to outlive the attack of the pathogen without
significant damage to economic yield despite visible
symptoms of the disease. Thus, breeding programs aimed to obtain tolerant genotypes have sought to
develop effective strategies to assess field tolerance
(HARTMAN et al., 2005). One of these involves management schemes based on the application of different types of fungicides to compare genotypes in both the presence and absence of rust; thus, allowing estimation of losses caused by the disease (SCHAFER, 1971; LEVY, 2004).
This work aimed to evaluate the tolerance of soybean genotypes to Asian rust through the estimation of yield losses and reduction of seed size
(SS) caused by natural field infection.
MATERIALS AND METHODS
The genetic material was derived from a partial diallel, with 50 crosses between two sets of genotypes: group I (10 parents represented by experimental lines with high grain yield and resistance to the most important diseases) and group II (5 parents including lines, cultivars, and a Plant Introduction), details are given in table 1. All parent materials were seeded in a greenhouse to conduct the crosses during the months of January and February
Table 1 - Partial diallel crossings (10 × 5) between two sets of parental genotypes with 10 and 5 members in parental Groups I, and II, respectively. Each parent with its corresponding genealogy and the 50 crosses with identification numbers ranging from 101 to 150 are listed.
Grup I x Grup IIID* (G11)
MSOY6101
(G12) PI153.282
(G13) A4725RG
(G14) EMGOPA313
(G15) Caiapônia [IAC 7 x
(Santa Rosa x GO79-3068)]**
[Primavera (OCEPAR 3) x BR 85-6356]**
(G1) USP 14-01-20 G1xG11101 G1xG12102 G1xG13103 G1xG14104 G1xG15105
[Cristalina x IAC-4]**
(G2) USP 70.004 G2xG11106 G2xG12107 G2xG13108 G2xG14109 G2xG15110
[(Soc 81-76 x Foster) x (IAC Foscarin 31 x Forrest)]**
(G3) USP 70.006 G3xG11111 G3xG12112 G3xG13113 G3xG14114 G3xG15115
[Foster x FT 79- 3408]**
(G4) USP 70.010 G4xG11116 G4xG12117 G4xG13118 G4xG14119 G4xG15120
[(IAC Foscarin 31 x Forrest) x (Foster x FT 79- 3408)]**
(G5) USP 70.042 G5xG11121 G5xG12122 G5xG13123 G5xG14124 G5xG15125
[(Soc.81-76 x Foster) x Hartwig]**
(G6) USP 70.057 G6xG11126 G6xG12127 G6xG13128 G6xG14129 G6xG15130
[Kirby x FT-2]**
(G7) USP 70.080 G7xG11131 G7xG12132 G7xG13133 G7xG14134 G7xG15135
[(Coker x Primavera) x (Viçosa x IAC-10)]**
(G8) USP 70.108 G8xG11136 G8xG12137 G8xG13138 G8xG14139 G8xG15140
[Hartwig x PI 371.611]**
(G9) USP 70.109 G9xG11141 G9xG12142 G9xG13143 G9xG14144 G9xG15145
[(IAC-6 x UFV-4) x Hartwig]**
(G10) USP 93-05.552 G10xG11146 G10xG12147 G10xG13148 G10xG14149 G10xG15150
2011. Generations F1 and F2 were cultivated in order to multiply the seeds obtained from each crossing.
Experimental design
Experiments were carried out involving two types of genotypes (crosses and parents); and two types of disease management schemes based on use of fungicides:
- O & P management, consisting of two successive applications of fungicides that control rust and other fungal diseases, especially
end-of-cycle diseases (ECD); Piraclostrobin 133g l-1 and
Epoxiconazole 50g l-1, (BASF) and a third application
using fungicide Priori Xtra® (Azoxystrobin 200g l-1
and Ciproconazole 80g l-1, Syngenta).
- D management: consisting of applications of a fungicide that controls ECD, except for rust; three
applications of fungicide Derosal® 500SC (Carbendazim,
500g l-1, Bayer) were used to control ECD.
In summary, in each fungicide management scheme, 65 genotypes (15 parents and 50 crosses) were distributed in four randomized blocks. Each block consisted of one plot. Seeds were sown in rows 3.0m long (1.0m intended for path and 2.0m for sowing) with spacing of 0.5m between rows, for a
useful total area of 1.5m2 per plot.
Evaluated characters
The following characters were evaluated: - Grain yield (GY). Plants in each plot were harvested together. The seeds obtained were pre-dried in a laboratory environment until moisture stabilized at 13%; next, seeds were weighed, data were recorded
in g.plot-1 and later transformed into kg ha-1.
- Seed Size (SS). As 100-seed weight is highly and positively correlated with SS and much easier to measure, 100-seed weight was obtained by random sampling of 100 seeds from the material harvested in each plot.
Significance of rust effect
Rust effect (RE) for each genotype (parents and crosses) was estimated as the difference between adjusted means of each genotype, between the two experiments involving the two disease management schemes evaluated. RE was estimated for grain yield (REGY) and for 100-seed weight (RESS), using the following formulae: REGY = GY (D) - GY (O & P) and RESS = SS (D) – SS (O & P).
Rust reaction rate RRR (%) was estimated for GY and for SS by the following formula:
In order to evaluate the significance of
RE, the dependent (paired) samples test was used (STEEL & TORRIE, 1980). This test is commonly used when the same group of elements is subjected to some treatment under two different situations; i.e., two different disease management schemes, in our case. The hypotheses tested were: H0 : μ1 - μ2 = 0; H1
: μ1 - μ2 ≠ 0;where, μ1 is the average character in O
& P management; and is the mean of the character in the D management. The test statistic is given by:
where, is the mean of the differences between the two managements, given by:
where: Sd is the standard deviation of the differences
between the two managements, given by:
It is worth noting that the test statistic for the test for equality of two independent means is variance, which is calculated considering all the differences between the dependent observations.
Value of the minimum significant difference for GY
and SS was consistently estimated at 5%, considering the Bonferroni adjustment, in order to obtain the
significance of the RE for each cross.
Analysis of variance involving the source of variation (fungicide) was performed for the randomized blocks design according to the model below:
Where, Yijl is the observed value of each
genotype in the block and in the fungicide. μ is the
fixed effect of the general mean of the experiment.
gi is the fixed effect of the genotype, being (i = 1, ..., g). bj (f)l is the random effect of the block within
the fungicide. fl is the fixed effect of the fungicide,
where (= 1, ..., f). (gf)il is the fixed effect of the
interaction between genotype and fungicide and eijl is
the random effect of the experimental residue of the plot that received the genotype within the block in the fungicide, assuming that residues are independent and normally distributed with mean zero and variance
σ2. Finally, we used the method by Scott & Knott
(1974) in the analysis for grouping of means.
RESULTS AND DISCUSSION
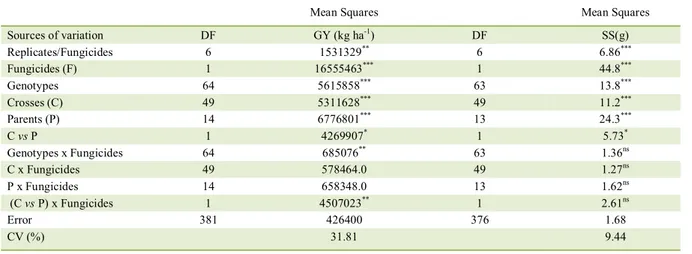
late in the growing season. Before the analysis of variance for grain yield (GY) and 100-seed weight (SS) (Table 2), means among disease management were different from each other. However, considering the interactions Genotype × Fungicide (G × F), these were important only for GY, since
there was a strong influence of the fungicide on the
mean values of GY. The average loss of GY in the
presence of rust was 358kg ha-1.
In principle, tolerance entails null or negligible GY loss in the presence of the rust and in the absence of any fungicide application (KAWUKI et al., 2004). Therefore, null or negative rust reaction rate (RRR) values indicate sensitivity to the fungus, while any variation in the negative RRR values, indicated the level of tolerance of each genotype. Conversely, positive and significant values of RRR indicate sensitivity to fungicide (phytotoxicity reaction), while intermediate values of RRR indicate moderate tolerance (ARAÚJO & VELLO, 2009).
Table 3 shows mean GY and rust effect
on GY for the 50 crosses under scrutiny. The five
crosses with the highest mean grain yield were 146 (USP93-05.552 × MSOY6101), 150 (USP93-05.552 × Caiapônia), 130 (USP70.057 × Caiapônia), 105 (USP14-01-20 × Caiapônia) and 102 (USP14-01-20 × PI153.282), whose means were above the overall mean. Among these crosses, only 146, 105, and 102 showed reduction of mean GY attributable to rust incidence. The outstanding performance by cross
146, which in average lost only 267kg ha-1 in the
presence of Asian rust; thus, maintaining a high mean yield despite the presence of the fungus.
The rust effect on GY ranged from 3.02kg
ha-1 (0.14%) to 1533kg ha-1 (85.03%), while the
mean loss was 426kg ha-1. Among the 50 crosses
tested, 38 showed significant GY losses. In relation to
tolerance, outstanding crosses were: 140 (USP70.108 × Caiapônia), 138 (USP70.108 × A4725RG), 133 (USP70.080 × A4725RG), 147 (USP93-05552 × PI 153.282), 137 (USP70.108 × PI153.282), 117 (USP70.010 × PI153.282), 107 (USP70.004 × PI153.282), 104 (USP14-01-20 × EMGOPA313), 149 (USP93-05.552 × EMGOPA 313), 145 (USP70.109 × Caiapônia), 129 (USP70.057 × EMGOPA313) and 141 (USP70.109 × MSOY6101).
Table 4 shows mean GY and rust effect on GY of the 15 parental genotypes. Parents with characteristics of tall plants showed high productivity, these included: USP14-01-20 (3210kg
ha-1) and USP93-05.552 (3440kg ha-1) from group I;
MSOY6101 (2471kg ha-1) and Caiapônia (2386kg
ha-1) from group II.
Genotypes that stood out the most with respect to rust tolerance were parents PI153.282 and A4725RG. However, it is not possible to say that these parents actually expressed tolerance-related genes, since these materials were harvested early and might simply have escaped the period of higher rust incidence. This is why early cultivars have been preferred in the past (HARTMAN et al., 2005). Indeed, KAWUKI et al. (2004) and MELO et al. (2015) evaluated the tolerance of soybean genotypes
Table 2 - Analysis of variance of parents and crosses in the F4 generation in both fungicide management schemes for grain yield (GY) and
seed size (SS). The experiment was laid out in a randomized blocks design with four replicates.
Mean Squares Mean Squares
Sources of variation DF GY (kg ha-1) DF SS(g)
Replicates/Fungicides 6 1531329** 6 6.86***
Fungicides (F) 1 16555463*** 1 44.8***
Genotypes 64 5615858*** 63 13.8***
Crosses (C) 49 5311628*** 49 11.2***
Parents (P) 14 6776801*** 13 24.3***
C vs P 1 4269907* 1 5.73*
Genotypes x Fungicides 64 685076** 63 1.36ns
C x Fungicides 49 578464.0 49 1.27ns
P x Fungicides 14 658348.0 13 1.62ns
(C vs P) x Fungicides 1 4507023** 1 2.61ns
Error 381 426400 376 1.68
CV (%) 31.81 9.44
Table 3 - Grain yield (GY, kg ha-1) in the O & P and D disease management schemes, rust effect (RE), rust reaction rate (RRR) and mean
GY of 50 crosses from F4 generation.
Genotypes IDa GY (O&P) GY (D) RE RRR (%) Mean GY**
USP 70.108 x Caiapônia 140 2356.67 2360.00 3 ns 0.14 2358.34 b
USP 70.108 x A4725RG 138 2003.33 2010.00 7 ns 0.33 2006.67 b
USP 70.080 x A4725RG 133 2053.33 2040.00 -13 ns -0.65 2046.67 b
USP 93-05.552 x PI 153.282 147 683.33 663.33 -20 ns -3.02 673.33 d
USP 70.108 x PI 153.282 137 840.00 863.33 23 ns 2.70 851.67 d
USP 70.010 x PI 153.282 117 576.67 540.00 -37 ns -6.79 558.34 d
USP 70.004 x PI 153.282 107 373.33 430.00 57 ns 13.18 401.67 d USP 14-01-20 x EMGOPA 313 104 2786.67 2723.33 -63 ns -2.33 2755.00 a
USP 93-05.552 x EMGOPA 313 149 2686.67 2753.33 67 ns 2.42 2720.00 a
USP 70.109 x Caiapônia 145 1856.67 1926.67 70 ns 3.63 1891.67 b
USP 70.057 x EMGOPA 313 129 2120.00 2030.00 -90 ns -4.43 2075.00 b
USP 70.109 x MSOY 6101 141 2350.00 2233.33 -117 ns -5.22 2291.67 b
USP 70.080 x Caiapônia 135 2840.00 2700.00 -140 * -5.19 2770.00 a
USP 70.006 x A4725RG 113 1666.67 1810.00 143 * 7.92 1738.34 b
USP 70.006 x PI 153.282 112 603.33 433.33 -170 * -39.23 518.33 d
USP 70.109 x PI 153.282 142 546.67 716.67 170 * 23.72 631.67 d
USP 70.042 x PI 153.282 122 460.00 283.33 -177 * -62.35 371.67 d
USP 70.108 x EMGOPA 313 139 2143.33 2320.00 177 * 7.61 2231.67 b
USP 70.010 x A4725RG 118 1393.33 1193.33 200 * 8.30 1293.33 c
USP 70.057 x PI 153.282 127 766.67 566.67 -200 * -16.76 666.67 d
USP 70.006 x MSOY 6101 111 2210.00 2410.00 -200 * -35.29 2310.00 b
USP 93-05.552 x A4725RG 148 2316.67 2080.00 -237 * -11.38 2198.34 b USP 70.109 x EMGOPA 313 144 1146.67 1400.00 253 * 18.10 1273.34 c
USP 93-05.552 x MSOY 6101 146 3520.00 3253.33 -267 * -8.20 3386.67 a
USP 70.004 x A4725RG 108 983.33 1263.33 280 * 22.16 1123.33 c
USP 70.057 x MSOY 6101 126 1733.33 2030.00 297 * 14.61 1881.67 b
USP 70.042 x A4725RG 123 1083.33 1393.33 310 * 22.25 1238.33 c
USP 70.080 x MSOY 6101 131 2990.00 2653.33 -337 * -12.69 2821.67 a
USP 70.004 x Caiapônia 110 2893.33 2536.67 -357 * -14.06 2715.00 a
USP 70.042 x Caiapônia 125 2210.00 1853.33 -357 * -19.24 2031.67 b
USP 70.109 x A4725RG 143 1566.67 1183.33 -383 * -32.39 1375.00 c
USP 70.006 x Caiapônia 115 2496.67 2100.00 -397 * -18.89 2298.34 b USP 70.057 x Caiapônia 130 2843.33 3283.33 440 * 13.40 3063.33 a
USP 70.042 x MSOY 6101 121 1556.67 1073.33 -483 * -45.03 1315.00 c
USP 70.080 x PI 153.282 132 3116.67 2590.00 -527 * -20.33 2853.34 a
USP 70.080 x EMGOPA 313 134 2753.33 2216.67 -537 * -24.21 2485.00 b
USP 70.057 x A4725RG 128 1880.00 2456.67 577 * 23.47 2168.34 b USP 93-05.552 x Caiapônia 150 2776.67 3353.33 577 * 17.20 3065.00 a
USP 70.108 x MSOY 6101 136 1956.67 2570.00 -613 * -55.76 2263.34 b
USP 14-01-20 x A4725RG 103 3240.00 2533.33 -707 * -27.89 2886.67 a
USP 70.042 x EMGOPA 313 124 2560.00 1776.67 -783 * -44.09 2168.34 b
USP 70.010 x MSOY 6101 116 3293.33 2496.67 -797 * -31.91 2895.00 a
USP 70.004 x MSOY 6101 106 2643.33 1840.00 -803 * -43.66 2241.67 b
USP 14-01-20 x Caiapônia 105 3416.67 2576.67 -840 * -32.60 2996.67 a
USP 70.006 x EMGOPA 313 114 2430.00 1386.67 -1043 * -75.24 1908.34 b
USP 70.004 x EMGOPA 313 109 2510.00 1230.00 -1280 * -104.07 1870.00 b
USP 70.010 x EMGOPA 313 119 2993.33 1643.33 -1350 * -82.15 2318.33 b USP 14-01-20 x PI 153.282 102 3660.00 2298.33 -1362 * -59.25 2979.17 a
USP 14-01-20 x MSOY 6101 101 3273.33 1820.00 -1453 * -79.85 2546.67 a
USP 70.010 x Caiapônia 120 3336.67 1803.33 -1533 * -85.03 2570.00 a *Least significant difference within the same genotype in the two fungicides: 139kg ha-1 (5%). ID: Identification numbers (To identify
to rust and found that early genotypes were more tolerant than intermediate and late genotypes.
Other studies have reported (TICHAGWA, 2004; YANG et al., 1992) that, besides reduced GY, rust attack causes reduced SS. Therefore, as it
reflects SS, the mean 100-seed weight and the rust
effect on mean 100-seed weight were calculated for all crosses (Table 5). Five crosses showed the highest SS: 130 (USP70.057 × Caiapônia), 128 (USP70.057 × A4725RG), 110 (USP70.004 × Caiapônia), 122 (USP70.042 × PI153.282) and 140 (USP70.108 ×
Caiapônia). Crossing 130 (15.95g) reflected SS of
USP70.057 (16.87g) and Caiapônia (14.61g) parents and had excellent productivity. However, SS was reduced by almost 1.0g in the presence of rust, unlike that of the cross 110, whose SS was hardly affected, maintaining a mean SS of 15.3g for 100-seed weight.
Nevertheless, large seeds are not necessarily any guarantee of an increase in grain yield, nor are they preferred by most farmers (GIRARD, 2002). Preference for small SS continues among producers, due to the economy with regard to inoculation, treatment, transport, and seed acquisition (THOMAS & COSTA, 2010).
The rust effect on SS ranged from 0.06g (0.48%) to 2.74g (20.4%), while the mean loss was 0.78g. In our experiments, the most tolerant crosses were 142 (USP70.109 × PI153.282), 143 (USP70.109 × A4725RG), 127 (USP70.057 × PI153.282), 136
(USP70.108 × MSOY6101), 132 (USP70.080 × PI153.282), 111 (USP70.006 × MSOY6101), 135 (USP70.080 × Caiapônia), 134 (USP70.080 × EMGOPA313), 147 (USP93-05.552 × PI153.282), 137 (USP70.108 × PI153.282), 110 (USP70.004 × Caiapônia) and 131 (USP70.080 × MSOY6101).
Among parental materials included in the
present study, none showed non-significant reduction
in SS (Table 6). However, among parents with larger SS, Caiapônia also showed the lowest reduction in SS when compared to the rest of parents.
CONCLUSION
The statistical test allowed us to establish
on a sound basis the significance of the estimates of
rust effect in soybean; thus, providing guarantee of the reliability of the information related to the tolerance of the genotypes under study. The most tolerant crosses were: 133 (USP70.080 × A4725RG), 138 (USP70.108 × A4725RG), 140 (USP70.108 × Caiapônia) and 147 (USP93-05.552 × PI153.282). Cross 140 deserve special mention, since its yield surpassed overall mean yield of all crosses. The USP93-05.552 was the most outstanding parental material among the most
productive parents identified by the clustering test for
high grain yield and low yield loss.
As for SS, crosses with large seed and rust tolerance were 136 (USP70.108 × MSOY6101),
Table 4 - Grain yield (GY, kg ha-1) in the O & P and D disease management schemes, rust effect (RE), rust reaction rate (RRR) and mean
GY of the 15 parental genotypes.
Genotypes IDa GY (O&P) GY (D) RE RRR (%) Mean GY**
PI 153.282 G12 55.13 12.13 -43 ns -354.40 33.63 d
A4725RG G13 553.33 476.67 -77 ns -16.08 515.0 d
USP 70.042 G5 1660.00 1823.33 163 * 8.96 1741.6 b
USP 93-05.552 G10 3640.00 3240.00 -400 * -12.35 3440.0 a
USP 70.010 G4 2768.33 2220.00 -548 * -24.70 2494.1 b
USP 70.004 G2 1713.33 1100.00 613 * 23.87 1406.6 c
USP 14-01-20 G1 3550.00 2870.00 -680 * -23.69 3210.0 a
MSOY 6101 G11 2846.67 2096.67 -750 * -35.77 2471.6 b
USP 70.109 G9 2576.67 1706.67 -870 * -50.98 2141.6 b
EMGOPA 313 G14 2950.00 2063.33 -887 * -42.97 2506.6 b
CAIAPÔNIA G15 2833.33 1940.00 -893 * -46.05 2386.6 b
USP 70.006 G3 2263.33 1273.33 -990 * -77.75 1768.3 b
USP 70.057 G6 3540.00 2283.33 -1257 * -55.04 2911.6 a
USP 70.080 G7 3483.33 2046.67 -1437 * -70.20 2765.0 a
USP 70.108 G8 4053.33 1886.67 -2167 * -114.84 2970.0 a
*
Table 5 - Seed size (SS, g of 100-seed weight) in the O & P and D disease management schemes, rust effect (RE), rust reaction rate (RRR) and mean of SS of the 50 crosses from F4 generation.
Genotypes IDa SS (O&P) SS (D) RE RRR(%) Mean SS**
USP 70.109 x PI 153.282 142 13.74 13.67 -0.06 ns -0.48 13.71 b
USP 70.109 x A4725RG 143 12.86 12.79 -0.07 ns -0.57 12.83 c
USP 70.057 x PI 153.282 127 13.78 13.86 0.07 ns 0.54 13.82 b
USP 70.108 x MSOY 6101 136 14.68 14.78 0.11 ns 0.71 14.73 a
USP 70.080 x PI 153.282 132 13.29 13.17 -0.13 ns -0.95 13.23 c
USP 70.006 x MSOY 6101 111 14.89 14.76 -0.13 ns -0.86 14.83 a
USP 70.080 x Caiapônia 135 13.37 13.24 -0.13 ns -1.00 13.31 c
USP 70.080 x EMGOPA 313 134 10.93 10.80 -0.14 ns -1.27 10.87 d
USP 93-05.552 x PI 153.282 147 13.37 13.54 0.17 ns 1.26 13.46 b
USP 70.108 x PI 153.282 137 14.60 14.77 0.17 ns 1.17 14.69 a
USP 70.004 x Caiapônia 110 15.39 15.22 -0.18 ns -1.17 15.31 a
USP 70.080 x MSOY 6101 131 11.38 11.56 0.18 ns 1.54 11.47 d
USP 70.006 x EMGOPA 313 114 12.04 11.82 -0.22 * -1.88 11.93 d
USP 70.109 x MSOY 6101 141 15.02 15.25 0.23 * 1.49 15.14 a
USP 93-05.552 x Caiapônia 150 14.55 14.29 -0.26 * -1.84 14.42 b
USP 70.109 x Caiapônia 145 14.12 13.85 -0.26 * -1.89 13.99 b
USP 70.042 x EMGOPA 313 124 13.75 13.48 -0.26 * -1.97 13.62 b
USP 70.006 x Caiapônia 115 14.91 14.61 -0.30 * -2.07 14.76 a
USP 70.006 x PI 153.282 112 14.42 14.10 -0.32 * -2.29 14.26 b
USP 70.109 x EMGOPA 313 144 12.18 12.63 0.45 * 3.56 12.41 c
USP 70.004 x PI 153.282 107 14.83 14.37 -0.46 * -3.20 14.60 a
USP 70.108 x Caiapônia 140 15.40 14.93 -0.47 * -3.11 15.17 a
USP 70.042 x Caiapônia 125 14.48 14.00 -0.48 * -3.41 14.24 b
USP 70.108 x A4725RG 138 14.66 15.17 0.50 * 3.31 14.92 a
USP 14-01-20 x Caiapônia 105 14.67 14.15 -0.52 * -3.68 14.41 b
USP 70.004 x EMGOPA 313 109 13.88 13.36 -0.52 * -3.89 13.62 b
USP 70.057 x A4725RG 128 15.76 15.23 -0.52 * -3.45 15.49 a
USP 93-05.552 x EMGOPA 313 149 11.38 11.90 0.53 * 4.41 11.64 d
USP 70.004 x MSOY 6101 106 15.15 14.62 -0.53 * -3.63 14.89 a
USP 14-01-20 x EMGOPA 313 104 13.38 12.83 -0.54 * -4.25 13.11 c
USP 70.004 x A4725RG 108 15.06 14.50 -0.56 * -3.90 14.78 a
USP 70.057 x MSOY 6101 126 12.92 13.53 0.61 * 4.51 13.23 c
USP 70.108 x EMGOPA 313 139 11.05 11.80 0.75 * 6.33 11.43 d
USP 70.010 x EMGOPA 313 119 12.09 11.29 -0.80 * -7.09 11.69 d
USP 70.042 x A4725RG 123 14.22 13.40 -0.82 * -6.14 13.81 b
USP 70.057 x EMGOPA 313 129 11.46 12.30 0.83 * 6.79 11.88 d
USP 70.057 x Caiapônia 130 16.42 15.50 -0.92 * -5.95 15.96 a
USP 70.080 x A4725RG 133 13.46 12.46 -1.00 * -7.99 12.96 c
USP 14-01-20 x MSOY 6101 101 13.89 12.84 -1.05 * -8.18 13.37 c
USP 70.010 x Caiapônia 120 14.87 13.77 -1.10 * -7.99 14.32 b
USP 14-01-20 x PI 153.282 102 14.62 13.48 -1.14 * -8.42 14.05 b
USP 93-05.552 x MSOY 6101 146 13.85 12.63 -1.22 * -9.62 13.24 c
USP 70.010 x MSOY 6101 116 15.48 14.20 -1.28 * -9.00 14.84 a
USP 70.006 x A4725RG 113 14.92 13.56 -1.36 * -10.05 14.24 b
USP 93-05.552 x A4725RG 148 14.65 13.26 -1.39 * -10.47 13.96 b
USP 70.042 x PI 153.282 122 15.90 14.43 -1.47 * -10.15 15.17 a
USP 70.010 x A4725RG 118 15.09 13.16 -1.92 * -14.61 14.13 b
USP 70.010 x PI 153.282 117 14.98 12.60 -2.38 * -18.87 13.79 b
USP 70.042 x MSOY 6101 121 14.39 11.83 -2.56 * -21.64 13.11 c
USP 14-01-20 x A4725RG 103 16.17 13.43 -2.74 * -20.41 14.80 a
*
Least significant difference within the same genotype in the two fungicides: 0.19kg ha-1 (5%). ID: Identification numbers (To identify genotypes, see Table 1). **Averages followed by the same letter are joined in the same group by Scott & Knott test at 5% significance.
111 (USP70.006 × MSOY6101), 137 (USP70.108 × PI153.282) and 110 (USP70.004 × Caiapônia). Crosses with smaller seed and rust tolerance were 134 (USP70.080 × EMGOPA313) and 131 (USP70.080 × MSOY6101).
Table 6 - Seed size (SS, g of 100-seed weight) in the O & P and D disease management schemes, rust (EF), rust reaction rate (RRR) and mean of SS of the 15 parents.
Genotypes IDa SS (O&P) SS (D) RE RRR(%) Mean SS **
CAIAPÔNIA G15 14.82 14.40 -0.42 * -2.92 14.61 a
USP 70.042 G5 13.53 13.10 -0.43 * -3.26 13.32 c
USP 14-01-20 G1 13.93 13.43 -0.51 * -3.76 13.68 b
EMGOPA 313 G14 9.81 9.25 -0.56 * -6.00 9.53 e
USP 70.057 G6 16.55 17.20 0.65 * 3.79 16.88 a
USP 70.004 G2 14.56 13.84 -0.71 * -5.17 14.2 b
USP 93-05.552 G10 12.53 13.47 0.94 * 7.00 13 c
A4725RG G13 15.21 13.86 -1.34 * -9.68 14.535 a
USP 70.080 G7 12.42 11.06 -1.37 * -12.34 11.74 d
MSOY 6101 G11 15.43 14.06 -1.37 * -9.77 14.75 a
USP 70.010 G4 12.56 11.17 -1.40 * -12.49 11.87 d
USP 70.109 G9 14.72 13.07 -1.65 * -12.61 13.89 b
USP 70.006 G3 13.66 11.85 -1.82 * -15.34 12.76 c
USP 70.108 G8 15.74 13.50 -2.23 * -16.53 14.62 a
PI 153.282 G12
*Least significant difference within the same genotype in the two fungicides: 0.19kg ha-1 (5%). ID: Identification numbers (To identify
genotypes, see Table 1). **Averages followed by the same letter are joined in the same group by Scott & Knott test at 5% significance.
ACKNOWLEDGEMENTS
The authors are grateful to Conselho Nacional de Desenvolvimento Científico e Tecnológico (CNPq) and Coordenação de Aperfeiçoamento de Pessoal de Nível Superior (CAPES) for their financial support and to the Universidade de São Paulo (USP), Escola Superior de Agricultura Luiz de Queiroz (ESALQ), for providing the facilities used in this research. REFERENCES
ARAÚJO, M.M. de; VELLO, N.A. Characterization of soybean genotypes for Asian soybean rust reaction. Crop Breeding and Applied Biotechnology, Londrina, v. 10, n. 3, p. 197–203, 2010. Available from: <http://www.scielo.br/scielo.php?script=sci_artt ext&pid=S1984-70332010000300003>. Accessed: Jul. 20, 2017. doi: 10.1590/S1984-70332010000300003.
CALVO, E.S. et al. Two major recessive soybean genes conferring soybean rust resistance. Crop Science, Madison, v. 48, n. 4, p. 1350-1354, 2008. Available from: <http://dx.doi.org/10.2135/ cropsci2007.10.0589>. Accessed: Jul. 20, 2017. doi: 10.2135/ cropsci2007.10.0589.
GIRARD, R.E. Estratégias de marketing no agronegócio de semente de soja. 2002. 124f. Dissertação (Mestrado em Engenharia de Produção) - Universidade Federal de Santa Catarina, Florianópolis. 2002. Available from: <https://repositorio.ufsc.br/ bitstream/handle/123456789/82343/188424.pdf?sequence=1>. Accessed: Mar. 13, 2017.
HARTMAN, G.L. et al. Breeding for resistance to soybean rust. Plant Disease, St. Paul, v. 89, p. 664–666, 2005. Available from: <https://apsjournals.apsnet.org/doi/pdf/10.1094/PD-89-0664>. Accessed: Mar. 13, 2017. doi: 10.1094/PD-89-0664
KAWUKI, R.S. et al. Soybean rust severity, rate of rust development and tolerance as influenced by maturity period and season. Crop Protection, v.23, p.447-455, 2004. Available from: < h t t p s : / / w w w. s c i e n c e d i r e c t . c o m / s c i e n c e / a r t i c l e / p i i / S0261219403002412?via%3Dihub>. Accessed: Apr. 4, 2017. doi: 10.1016/j.cropro.2003.09.016.
LEVY, C. Zimbabwe – a country report on soybean rust control. In: VII WORLD SOYBEAN RESEARCH CONFERENCE e III CONGRESSO BRASILEIRO DE SOJA, 3, 2004, Foz do Iguaçu, PR. Proceedings… Londrina: Embrapa, 2004. p.340-348. LI, S. et al. Identification of a new soybean rust resistance gene in PI567102B. Theoretical and Applied Genetics, v. 125, p. 133-142, 2012. Available from: <https://link.springer.com/ article/10.1007%2Fs00122-012-1821-y>. Accessed: Apr. 4, 2017. doi: 10.1007/s00122-012-1821-y.
MELO, C.L.P. de et al. Tolerance of soybean genotypes to Asian rust. Ciência Rural [online], vol.45, n.8, p.1353-1360, 2015. Available from: <http://dx.doi.org/8478cr20141309>. Accessed: Apr. 12, 2017. doi: 10.1590/0103-8478cr20141309.
MONTEROS, M.J. et al. Mapping and confirmation of the ‘Hyuuga’ red-brown lesion resistance gene for Asian soybean rust. Crop Science, Madison, v. 47, n. 2, p. 829-836, 2007. Available from: <https://www. scopus.com/record/display.uri?eid=2-s2.0-34247184723&origin=inw ard&txGid=b2f190feade736da0fbe4e8f35767976>. Accessed: Mar. 12, 2017. doi: 10.2135/cropsci06.07.0462.
SCOTT, A.J.; KNOTT, M. Cluster analysis method for grouping means in the analysis of variance. Biometrics, Arlington, v. 30, n. 3, p. 507–512, 1974. Available from: < h t t p : / / w w w. j s t o r. o rg / s t a b l e / p d f / 2 5 2 9 2 0 4 . p d f ? r e f r e q i d = e x c e l s i o r % 3 A 0 c e 8 a 2 b d c 9 0 d b 7 5 f 1 a a a a a 8 1 2 9 4 8 8 1 6 6 > . Accessed: Jan. 29, 2018.
STEEL, R.G.D.; TORRIE, J.H. Principles and Procedures of Statistics, 2nd ed, New York: McGraw-Hill. 1980. 633p.
TICHAGWA, J.S. Breeding for resistance to soybean rust in Zimbabwe. In: WORLD SOYBEAN RESEARCH CONFERENCE, 7., INTERNATIONAL SOYBEAN PROCESSING AND UTILIZATION CONFERENCE, 6.,