Potential of soybean crosses in early inbreeding
generations for grain yield
Gabriela Antônia de Freitas Rocha
1*, Fernanda Aparecida de
Castro Pereira
1and Natal Antonio Vello
1Abstract: The present study aimed to evaluate the combining ability of 16
soybean genotypes using a partial diallel. Two experiments were carried out to estimate the general (GCA) and specific (SCA) combining ability, one with 64 crosses and the other with 16 parents. At the R8 stage, F2 plants and the
parents were evaluated for the following traits: number of days to flowering (NDF), number of days to maturity (NDM), plant height at maturity (PHM), and grain yield (GY). Results indicated genetic variability between the parents and between the crosses. For GY, six (37.5%) parents stood out with high yield. The GCA and SCA estimates were significant for all traits, revealing additive and non-additive effects. The parent USP 04-17.027 (4) was superior for presenting the highest means, heritability, and GCA. The cross (4x13 = USP 04-17.027 x USP 231-2224-12) stood out owing to the highest SCA for GY.
Key words:Glycine max, diallel analysis, combining ability, partial diallel, ge
-netics parameters.
Crop Breeding and Applied Biotechnology 18: 267-275, 2018 Brazilian Society of Plant Breeding. Printed in Brazil
http://dx.doi.org/10.1590/1984-70332018v18n3a40
ARTICLE
*Corresponding author: E-mail: [email protected]
Received: 23 August 2017 Accepted: 25 November 2017
1 Universidade de São Paulo, Escola Superior
de Agricultura Luiz de Queiroz, Avenida Padua Dias, 11, 13.400-970, Piracicaba, SP, Brazil INTRODUCTION
Soybean [Glycine max (L.) Merrill] is the most important oilseed crop in the world. Currently, the species is cultivated in several tropical and subtropical regions, being the United States and Brazil the largest producers and exporters worldwide (USDA 2017). In Brazil, soybean is one of the most significant agricultural products for agribusiness, with a prominent spot in the export agenda of the country.
Soybean has a high oil content (about 20%) and protein content (about 40%), accounting for approximately 60% of the total dry weight of the seeds. Therefore, soybean is primarily used in the industry as a source of edible oil for human food and protein for animal feed (Yadav 1996, Burton 1997). Due to the importance of soybean in the global scenario, its grain yield must be improved since it is the most important trait for the commercial production of this plant.
quantitative traits. These traits usually have reduced heritability when compared with the qualitative ones, which, in turn, are expected to be more efficiently altered by selection at the initial segregant generations (Fehr 1987). Rosal et al. (2000) evaluated the efficiency of early selection for grain yield in a bean crop (Phaseolus vulgaris L.) and concluded that early selection was effective mainly in eliminating families with the worst performance, which consequently reduced the labor of breeders in advanced generations. Likewise, Carvalho et al. (2009) investigated the early selection in progenies derived from F2 plants and progenies derived from F4 plants in soybean and concluded that early selection could be used to discard non-promising progenies in soybean breeding programs.
The experimental assessment of the segregant families will allow identifying those with a superior genotypic value for one or more polygenic traits, such as grain yield. This helps assure the selection in the following generations of most promising genotypes with performance superior to that of the initial parents.
In this context, this research aimed to estimate genetic parameters and evaluate the agronomic performance, in order to identify possible promising genotypes to be used in future programs focused on high grain yield.
MATERIAL AND METHODS
Biparental crosses were made in 2010/2011 to obtain the 8 x 8 partial diallel using 16 inbred lines, which were divided into two groups of eight lines each (Table 1). Group 1 presented lines with tolerance to a disease complex (emphasis on resistance to stem and cyst nematodes) and high oil content. Group 2 presented lines with tolerance to the same disease complex and Asian soybean rust. Hybridizations were performed in a greenhouse at the Sector of Applied Genetics to Self-Pollinated Species, Department of Genetics, ESALQ/USP, in Piracicaba, SP.
The advance of the F1 generation was performed in 2011/2012, in the field, to obtain F2 seeds intended for planting
in the next crop season. Each seed of the F1 pods was sown in trays to obtain seedlings. Seedlings were transplanted
in the field, spacedat 0.80 m x 0.80 m apart. F1 plants were harvested individually. Subsequently, F2 seeds were sown
in the field in 2012/2013.
Table 1. Parents used in the 8 x 8 partial diallel between eight parents with high oil content and resistantto diseases, such as stem and cyst nematodes, and eight parents tolerant to Asian soybean rust
Parents Genotypesa Pedigrees
01 USP 04-18.092 MT 123800 x USP 11-14 = MT 123800 x (Foster x FT 79-3408) 02 USP 02-16.122 USP 02 FR x USP 06 FB PC = (Primavera x Forrest) x (SOC 81-76 x Foster) 03 USP 02-16.045 USP 04 x USP 05 PC = (Primavera x Forrest) x (Kirby x FT-2)
04 USP 04-17.027 USP-2-1 x USP 93-5280 = (Primavera x Forrest) x (Paranagoiana x Sel. Jackson-4028) 05 USP 04-17.039 USP-1-19 x USP 93-5280 = (IAC-Foscarin-31 x Forrest) x (Paranagoiana x Sel. Jackson-4028)
06 USP 231-4124-04 BUSP 16-015 x USP 97-10.046 = [(IAC-Foscarin-31 x Forrest) x (Foster x FT 79-3.408)] x [(Primavera x SOC 81-79) x (IAC-10 x GO 81-11.046)] 07 USP 231-3225-11 USP 02-16.045 x USP 97-10.046 = (USP 04 x USP 05 PC) x [(Primavera x SOC 81-79) x (IAC-10 x GO 81-11.046)] 08 USP 231-4112-01 USP 97-08.135 x USP 97-10.046 = (IAS-5 x IAC-100) x [(Primavera x SOC 81-79) x (IAC-10 x GO 81-11.046)] 09 TMG INOX CB-07-958-B
10 USP 04-17.011 USP-1-19 x PI 181.544 = (IAC-Foscarin-31 x Forrest) x PI 181.544
11 USP 231-2228-01 USP 97-08.135 x 191-102-03 = (IAS -5 x IAC-100) x {[(TN#4 x PI 230.970 F7-4) x Doko] x Ocepar} 12 USP 231-2132-04 USP 11-38 x 191-103-12 = (Foster x FT 79-3.408) x {[(TN#4 x PI 230.970 F7-4) x Doko] x Hakucho} 13 USP 231-2224-12 USP 97-10.046 x 191-102-03 = [(Primavera x SOC 81-79) x (IAC-10 x GO 81-11.046)] x {[(TN#4 x PI 230.970 F7-4) x Doko] x Ocepar}
14 USP 231-6101-10 USP 97-10.046 x 191-103-12 = [(Primavera x SOC 81-79) x (IAC-10 xGO 81-11.046)] x {[(TN#4 x PI 230.970 F7-4) x Doko] x Hakucho} 15 USP 231-1228-09 USP 14-06-20 x 191-103-12 = (IAC-4 x Conquista) x {[(TN#4 x PI 230.970 F7-4) x Doko] x Hakucho} 16 USP 231-2222-12 USP 191-102-03 x 191-103-12 = {[(TN#4 x PI 230.970 F7-4) x Doko] x Ocepar} x {[(TN#4 x PI 230.970 F7-4) x Doko] x Hakucho}
a The 16 parents are experimental lines, with 15 parents developed by the Sector of Applied Genetics to Self-Pollinated Species, Department of Genetics, ESALQ/USP; the
In 2012/2013, the experiment was conducted in randomized blocks, with ten replications subdivided into two experimental sets, with three common checks (CB 07-958-B, BRS 133, IAC-100). Each set involved 32 crosses and the three common checks. Treatments were randomized within each set, and the order of sets was randomized within each replication. Twenty seeds were sown in the experimental plot, which consisted of a 3.0 m (2.0 m sown + 1.0 m path) x 0.5 m row, i.e., 1.5 m2. Each cross was represented by approximately 200 F
2 plants. The 16 parents and the same three common checks were planted in an additional randomized block design experiment with four replications. In total, 640 plots of crosses and 64 plots of parents were sown, in addition to three common checks. The F2 plants were harvested and threshed individually.
The following traits were evaluated: number of days to flowering (NDF), which refers to the interval between the dates of sowing and the emergence of the first flower; number of days to maturity (NDM), which comprised the period between sowing and the phenological stage R8 (maturation); plant height at maturity (PHM), which corresponded to
the distance in centimeters from the soil surface to the end of the main stem; and grain yield (GY), which was calculated by harvesting all the plants of the area of each plot and threshing individually, followed by drying at 13% of moisture (data obtained in g plot-1 transformed to kg ha-1).
The analysis of variance was performed according to the experimental design of randomized blocks using the R software. For the significant sources of variation by the ANOVA F test, the Scott and Knott (1974)`s test at 5% probability was used for multiple comparisons and means grouping.
The broad-sense heritability coefficient, in percentage, was estimated from the phenotypic, genotypic, and environmental variances, based on Bernardo (2010). Heterosis and inbreeding depression were calculated as percentages for GY and estimated according to Vencosvsky and Barriga (1992), with the necessary adjustments to the F2 data so that the results were expressed at the F1 level.
The diallel analysis was performed after obtaining the mean of the crosses in each plot. To estimate the effects of general (GCA) and specific (SCA) combining ability, data were analyzed based on the method 4 of Griffing (1956)’s Model I, i.e., only the hybrids were included in the diallel analysis. These estimations were performed using Genes Statistical Software (Cruz 2013) for a partial diallel.
RESULTS ANDDISCUSSION
The analysis of variance of the checks revealed environmental homogeneity between the experiments; consequently, data adjustment was not necessary (Federer 1956). The analysis of variance showed genetic variability between parents and between crosses. Both experiments, parents and crosses, had satisfactory experimental precision, with coefficients of variation (CVs) ranging from 1.43% (NDF) to 24.0% (GY) and from 2.74% (NDF) to 22.0% (GY), for the experiment with the parents (EP) and with the crosses (EC), respectively. These values are in accordance with those found in the literature for plant breeding experiments (Ramalho et al. 2012), especially for soybean breeding (Oliveira et al. 2014).
The means of parents for GY did not differ by the Scott and Knott test. The Scott and Knott test allowed separating the crosses into two groups (a and b). Group “a” contained 28 crosses with means varying from 3063 to 4040 kg ha-1, whereas group “b” consisted of 36 crosses with means ranging from 1995 to 3030 kg ha-1. The crosses (4x13 = USP 04-17.027 x USP 231-2224-12), (8x11 = USP 231-4112-01 x USP 231-2228-01), (5x10 = USP 04-17.039 x USP 04-17.011), (2x16 = USP 02-16,122 X USP 231-2222-12), and (6x10 = USP 231-4124-04 x USP 04-17.011) had values higher than 3600 kg ha-1, indicating good specific combination ability (SCA).
For NDF, the means of the parents varied from 48 to 53 days, and the means of the crosses ranged from 44 to 49 days. The crosses (4x14 = USP 04-17.027 x USP 231-2224-12), (4x11 = USP 04-17.027 x USP 231-2228-01), and (4x13 = USP 04-17.027 x USP 231-2224-12) presented the longest vegetative period (49, 49, and 48 days, respectively) in the group “a” by the Skott and Knott test. These NDF values corresponded to the high means of their parents USP 04-17.027 (4) (53 days), USP 231-2224-12 (14) (50 days), USP 231-2228-01 (11) (50 days), and USP 231-2224-12 (13) (49 days).
TMG INOX (9) as a parent were the earliest (118 days), while those whose parents were USP 04-17.027 (4), USP 231-3225-11 (7), USP 231-2132-04 (12), USP 231-2224-12 (13), USP 231-6101-10 (14), and USP 231-1228-09 (16) showed late maturation with overall mean higher than the diallel mean (124 days).
Regarding PHM, the parents had means ranging from 55 cm USP 231-1228-09 (15) to 145 cm USP 04-17 027 (4). The mean of the crosses ranged from 63.6 cm (8x9 = USP 231-4112-01 x TMG INOX) to 132.5 cm (5x14 = USP 04-17.039 x USP 231-6101-10). Crosses that had USP 04-17.027 (4) or USP 04-17.039 (5) as parents presented the highest overall means, which is way higher than the diallel mean (91.8 cm). Therefore, these parents have indeterminate growth habit, besides having a long vegetative period.
The effect of GCA is related to genes of additive effects, whereas the effect of SCA is related to genes of non-additive effects, especially to the different types of genic dominance. In addition, the GCA estimate is an important indicator for determining whether the frequency of favorable genes in the parent is high (Cruz and Vencovsky 1989). The SCA
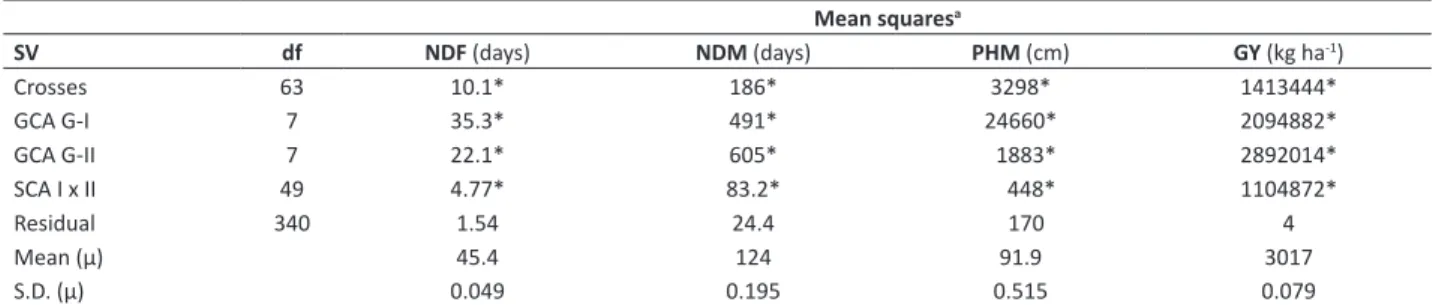
Table 2. Analysis of variance of the 8 x 8 partial diallel, in the F
2 generation
Mean squaresa
SV df NDF (days) NDM (days) PHM (cm) GY (kg ha-1)
Crosses 63 10.1* 186* 3298* 1413444*
GCA G-I 7 35.3* 491* 24660* 2094882*
GCA G-II 7 22.1* 605* 1883* 2892014*
SCA I x II 49 4.77* 83.2* 448* 1104872*
Residual 340 1.54 24.4 170 4
Mean (µ) 45.4 124 91.9 3017
S.D. (µ) 0.049 0.195 0.515 0.079
a NDF = number of days to flowering, NDM = number of days to maturity, PHM = plant height at maturity, and GY = grain yield. * Significant at 0.1% probability by the F test
Table 3. General (GCA) and specific (SCA) combining ability of the 8 x 8 partial diallel for grain yield (GY) by the method 4 of Griffing (1956), in the F2 generation
Parents1 (09) (10) (11) (12) (13) (14) (15) (16) GCA
(01) 19401 0260.8 03228 04120 05-306 -27606 38707 -40808 -181 S.D. (Gi)S.D. (Gi-Gi’) 0.3160.209
(02) 09 10 11 12 13 14 15 16 12.2
-21.2 -166 20.5 -246 -256 -121 271 517
(03) 17 18 19 20 21 22 23 24 -139
280 -349 -218 6.77 150 382 -178 -74.1
(04) 25 26 27 28 29 30 31 32 197
-226 -157 -335 330 758 -199 -135 -36.9
(05) 33 34 35 36 37 38 39 40 190
98.4 330 -313 -388 -586 423 269 167
(06) 41 42 43 44 45 46 47 48 162
35.9 260 -4.36 32.3 90.5 -160 3,14 -258
(07) 49 50 51 52 53 54 55 56 -101
209 203 -58.1 -5.48 -292 278 -551 217
(08) 57 58 59 60 61 62 63 64 -140
-570 -182 680 150 441 -329 -66.1 -124
GCA -312 167 238 -33.9 67.9 -73.3 -199 145
S.D. (Gj) 0.209 S.D. (Gj-Gj’) 0.316
S.D. (Sij) 0.553 S.D. (Sij-Sik) 0.837 S.D. (Sij-Skj) 0.837 S.D. (Sij-Skl) 0.775
provides information about genetically superior crosses, which is a consequence of the gene complementation between the parents.
The significance of the mean squares of GCA and SCA for the four traits in the diallel analysis (Table 2) suggested that the variability exists due to additive effects of genes (GCA) and the non-additive effects of the genes, i.e., the effects of dominance and or epistatic effects of genes (SCA) (Griffing 1956). Oliveira et al. (2014) concluded that the additive variance, expressed by the mean square of GCA, was comparatively higher than the non-additive variance for all the traits tested in the diallel analysis.
For GY, the parents USP 04-17.027 (4) and USP 04-17.039 (5) stood out in group 1; whereas the parents USP 231-2228-01 (11) stood out in group 2, which suggesteda higher concentration of alleles favorable for grain yield in these parents (Table 3). The parents USP 231-4124-04 (6), USP 04-17.011 (10), and USP 231-1228-09 (16) are also promising since they presented high and positive GCA estimates. The parent with the lowest concentration of favorable alleles for GY was TMG INOX (9), which was also the earliest, indicating the negative association between GY and cycle. Based on Cho and Scott (2000), the parents with the highest GCA values are related to the most productive combinations.
The effect of SCA (sij) suggests the deviation of a hybrid performance when compared with that expected based on
the GCA of its parents. If the absolute value of SCA is high, the signal will indicate if the cross presented a better (positive signal) or worse (negative signal) result than that expected by the GCA (Cruz and Carneiro 2003). The cross (4x13 = USP 04-17.027 x USP 231-2224-12) presented the highest sij value; whereas the GCA of the parents USP 231-2224-12 (13,
GCA = 67.9) and USP 04-17.027 (4, GCA = 197) were not the maximum values, the complementarity of the loci must generate a combination better than that expected between both parents, resulting in a very high SCA for the cross (4x13).
The crosses (2x16 = USP 02-16.122 x USP 231-2222-12), (5x14 = USP 04-17.039 x USP 231-6101-10), (1x15 = USP 04-18.092 x USP 231-1228-09), and (3x14 = USP 02-16.045 x USP 231-6101-10) also presented high SCA values, with high mean values that did not differ significantly from the mean of the crosses with higher sij values.
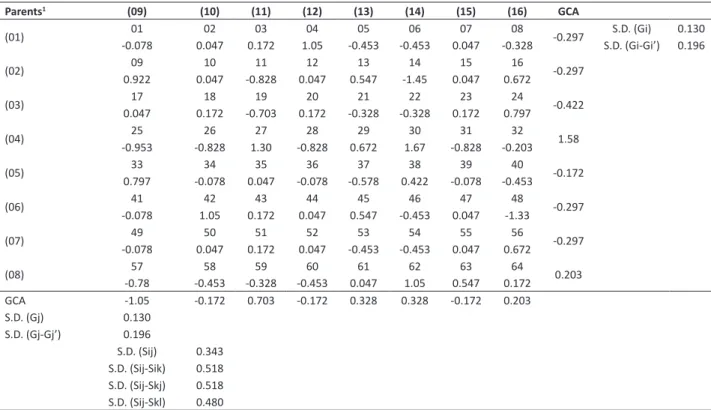
Table 4. General (GCA) and specific (SCA) combining ability of the 8 x 8 partial diallel for number of days to flowering (NDF) by the method 4 of Griffing (1956), in the F2 generation
Parents1 (09) (10) (11) (12) (13) (14) (15) (16) GCA
(01) -0.07801 0.04702 0.17203 1.0504 -0.45305 -0.45306 0.04707 -0.32808 -0.297 S.D. (Gi-Gi’)S.D. (Gi) 0.1300.196
(02) 09 10 11 12 13 14 15 16 -0.297
0.922 0.047 -0.828 0.047 0.547 -1.45 0.047 0.672
(03) 17 18 19 20 21 22 23 24 -0.422
0.047 0.172 -0.703 0.172 -0.328 -0.328 0.172 0.797
(04) 25 26 27 28 29 30 31 32 1.58
-0.953 -0.828 1.30 -0.828 0.672 1.67 -0.828 -0.203
(05) 33 34 35 36 37 38 39 40 -0.172
0.797 -0.078 0.047 -0.078 -0.578 0.422 -0.078 -0.453
(06) 41 42 43 44 45 46 47 48 -0.297
-0.078 1.05 0.172 0.047 0.547 -0.453 0.047 -1.33
(07) -0.07849 0.04750 0.17251 0.04752 -0.45353 -0.45354 0.04755 0.67256 -0.297
(08) 57 58 59 60 61 62 63 64 0.203
-0.78 -0.453 -0.328 -0.453 0.047 1.05 0.547 0.172 GCA -1.05 -0.172 0.703 -0.172 0.328 0.328 -0.172 0.203 S.D. (Gj) 0.130
S.D. (Gj-Gj’) 0.196
S.D. (Sij) 0.343 S.D. (Sij-Sik) 0.518 S.D. (Sij-Skj) 0.518 S.D. (Sij-Skl) 0.480
The parent USP 04-17.027 (4) (group 1) presented the highest GCA value for NDF. The crosses that used this parent had a longer vegetative stage, and for this reason, this parent can be considered as a source of alleles favorable to the long juvenile stage (Table 4). Conversely, the parent TMG INOX (9) (group 2) presented the lowest GCA value for NDF. The crosses that used this parent had a shorter vegetative stage. The cross (4x14 = USP 04-17.027 x USP 231-6101-10) presented the highest sij value, whereas the cross (2x14 = USP 02-16.122 x USP 231-6101-10) had the lowest sij value.
The fact that parent USP 231-6101-10 (14) is present in crosses with higher and lower sij values is explained by the
different possible combinations of alleles for NDF with the other parents of these crosses.
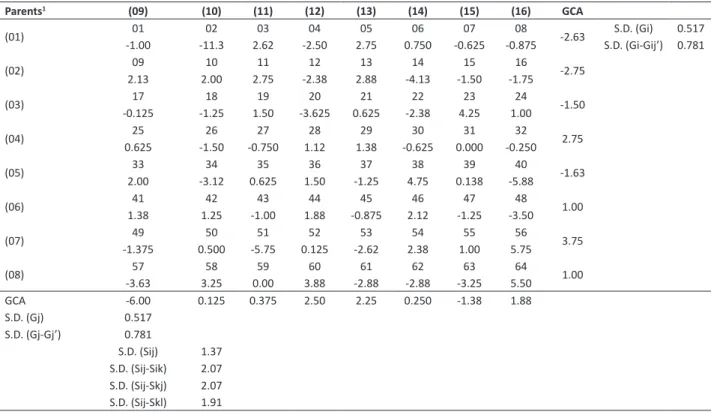
For NDM, the parent USP 231-3225-11 (7) (group 1) showed the highest GCA value. Therefore, crosses with this parent presented late maturation (mean of 127 days). Conversely, the parent TMG INOX (9) (group 2) revealed the lowest GCA value. Thus, crosses with this parent had early maturation (mean of 118 days). The highest sij value occurred in
the cross (3x15 = USP 02-16.045 x USP 231-1228-09), which also presented high mean (125 days) between the crosses. The lowest sij value occurred for the cross (5x16 = USP 04-17.039 X USP 231-2222-12) (Table 5).
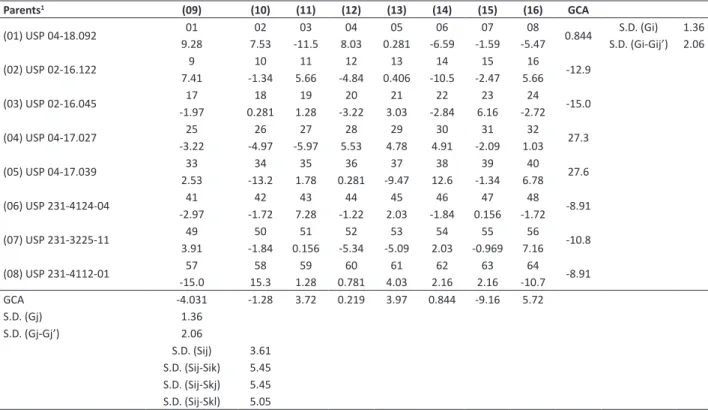
The GCA effects of the parents and SCA effects of the crosses for PHM (Table 6) indicated that USP 04-17.027 (4) and USP 04-17.039 (5) had the highest GCA values, suggesting an increase in plant height when using these parents in the crosses. USP 02-16.045 (3) had the lowest GCA value, conferring a short stand to the plants of the crosses where it participated as a parent.
Heterosis estimate indicate show much more the crosses yielded when compared with the mean of the parents. In this research, the estimates ranged from -52.9% (8x9 = USP 01 x TMG INOX) to 66.5% (8x11= USP 231-4112-01x USP 231-2228-01) (Table 7). The overall mean was 4.55%, i.e., the population meantended to be higher than that of the parents, as previously confirmed by Pandini et al. (2001). The parent USP 231-1228-09 (15) provided the highest mean contribution (178%), whereas the parent USP 231-2224-12 (13) resulted in the lowest mean contribution (80.5%). Despitethe variations observed in the ranking, the crosses with the highest values of heterosis and GY were the same,
Table 5. General (GCA) and specific (SCA) combining ability of the 8 x 8 partial diallelfor number of days to maturity (NDM) by the method 4 of Griffing (1956), in the F2 generation
Parents1 (09) (10) (11) (12) (13) (14) (15) (16) GCA
(01) -1.0001 -11.302 2.6203 -2.5004 2.7505 0.75006 -0.62507 -0.87508 -2.63 S.D. (Gi-Gij’) 0.781S.D. (Gi) 0.517
(02) 09 10 11 12 13 14 15 16 -2.75
2.13 2.00 2.75 -2.38 2.88 -4.13 -1.50 -1.75
(03) 17 18 19 20 21 22 23 24 -1.50
-0.125 -1.25 1.50 -3.625 0.625 -2.38 4.25 1.00
(04) 25 26 27 28 29 30 31 32 2.75
0.625 -1.50 -0.750 1.12 1.38 -0.625 0.000 -0.250
(05) 33 34 35 36 37 38 39 40 -1.63
2.00 -3.12 0.625 1.50 -1.25 4.75 0.138 -5.88
(06) 41 42 43 44 45 46 47 48 1.00
1.38 1.25 -1.00 1.88 -0.875 2.12 -1.25 -3.50
(07) 49 50 51 52 53 54 55 56 3.75
-1.375 0.500 -5.75 0.125 -2.62 2.38 1.00 5.75
(08) 57 58 59 60 61 62 63 64 1.00
-3.63 3.25 0.00 3.88 -2.88 -2.88 -3.25 5.50 GCA -6.00 0.125 0.375 2.50 2.25 0.250 -1.38 1.88 S.D. (Gj) 0.517
S.D. (Gj-Gj’) 0.781
S.D. (Sij) 1.37 S.D. (Sij-Sik) 2.07 S.D. (Sij-Skj) 2.07 S.D. (Sij-Skl) 1.91
except for (2x16 = USP 02-16.122 x USP 231-2222-12), which presented intermediate values of heterosis.
Based on Colombari et al. (2010), heterosis has a limited value for soybean breeding due to difficulties in performing a sufficient number of crosses and the small number of seeds produced in each cross. Nevertheless, the use of hybrid vigor has the potential to promote a considerable yield increase (Sinha and Khanna 1975, Freire Filho and Vello 1989). Additionally, heterosis has been cited as a good indicator of genetic diversity and may be useful in the choice of parents in breeding programs (Pandini et al. 2001).
When endogamy is in its maximum expression (F = 1), it confers the capacity of genetic fixation to the genotype. In other words, the progeny is identical to the parental plant. The variation of inbreeding depression ranged from -18.0% (8x9 = USP 231-4112-01 x TMG INOX) to 12.5% (8x11 = USP 231-4112-01 x USP 231-2228-01) (Table 7). The crosses that presented the highest values of inbreeding depression for GY were: (8x11 = USP 231-4112-01 x USP 231-2228-01), with 12.5%; (5x15 = USP 04-17.039 x USP 231-1228-09), with 9.88%; (4x12 = USP 04-17.027 x USP 231-2132-04), with 9.84%; and (4x13 = USP 04-17.027 x USP 231-2224-12), with 9.73%. This result suggests that these crosses had a yield decrease when selfed, which corresponded to a reduction in 473, 324, 345, and 393 kg ha-1, respectively, in the 2013/2014 crop season.
According to the results obtained for heterosis and inbreeding depression, there is evidence of additive and dominance inheritance for GY. The effects of dominance are closely related to inbreeding. Therefore, the endogamy present in these crosses may increase the additive genetic variance and heritability and may be used in future breeding programs (Vencovsky and Barriga 1992).
The crosses with the highest heritability values were: (4x13=USP 04-17.027 x USP 231-2224-12), with 66.6%; (1x15=USP 04-18.092 x USP 231-1228-09), with 65.9%; and (4x9=USP 04-17.027 x TMG INOX), with 60.0% (Table 7). These high values are expected for they are the initial inbreeding generations (Dudley and Moll 1969). These crosses could respond better to selection since the best plants are more likely to generate superior individuals within each cross. In 15.6% of
Table 6. General (GCA) and specific (SCA) combining ability of the 8 x 8 partial diallel for plant height at maturity (PHM) by the method 4 of Griffing (1956), in the F2 generation
Parents1 (09) (10) (11) (12) (13) (14) (15) (16) GCA
(01) USP 04-18.092 9.2801 7.5302 -11.503 8.0304 0.28105 -6.5906 -1.5907 -5.4708 0.844 S.D. (Gi-Gij’) 2.06S.D. (Gi) 1.36
(02) USP 02-16.122 7.419 -1.3410 5.6611 -4.8412 0.40613 -10.514 -2.4715 5.6616 -12.9
(03) USP 02-16.045 -1.9717 0.28118 1.2819 -3.2220 3.0321 -2.8422 6.1623 -2.7224 -15.0
(04) USP 04-17.027 -3.2225 -4.9726 -5.9727 5.5328 4.7829 4.9130 -2.0931 1.0332 27.3
(05) USP 04-17.039 2.5333 -13.234 1.7835 0.28136 -9.4737 12.638 -1.3439 6.7840 27.6
(06) USP 231-4124-04 -2.9741 -1.7242 7.2843 -1.2244 2.0345 -1.8446 0.15647 -1.7248 -8.91
(07) USP 231-3225-11 3.9149 -1.8450 0.15651 -5.3452 -5.0953 2.0354 -0.96955 7.1656 -10.8
(08) USP 231-4112-01 -15.057 15.358 1.2859 0.78160 4.0361 2.1662 2.1663 -10.764 -8.91 GCA -4.031 -1.28 3.72 0.219 3.97 0.844 -9.16 5.72
S.D. (Gj) 1.36
S.D. (Gj-Gj’) 2.06
S.D. (Sij) 3.61 S.D. (Sij-Sik) 5.45 S.D. (Sij-Skj) 5.45 S.D. (Sij-Skl) 5.05
the crosses, environmental variation was higher than the genetic variation since the crosses had negative heritability values. The parent USP 04-17.027 (4) presented the highest overall mean in the diallel (54.2%), whereas the parent USP 02-16.045 (3) presented the lowest overall mean (8.79%).
The parents USP 04-17.027 (4), USP 04-17.039 (5), USP 231-4124-04 (6), USP 04-17.011 (10), USP 231-2228-01 (11), and USP 231 -2222-12 (16) had a superior performance, with higher GCA for GY. The parent USP 04-17.027 (4) stood out for the greatest potential to generate crosses with high agronomic performance. The most promising crosses with high SCA were (4x13 = USP 17.027 x USP 231-2224-12), (2x16 = USP 02-16.122 x USP 231-2222-12), (5x14=USP 04-17.039 x USP 231-6101-10), (1x15=USP 04-18.092 x USP 231-1228-09), and (3x14 = USP 02-16.045 x USP 231-6101-10). The cross with the highest heterosis was (8x11 = USP 231-4112-01 x USP 231-2228-01). The crosses with the highest heritability values were: (4x13 = USP 04-17.027 x USP 231-2224-12), (1x15 = USP 04-18.092 x USP 231-1228-09), and (4x9 = USP 04-17.027 x TMG INOX).
Thus, these six superior parents and promising crosses stand out to be used in different soybean breeding programs aiming to obtain cultivars with high grain yield.
Table 7. Heterosis (h%), inbreeding depression (ID), and heritability (h2) of grain yield (g planta-1) of the 64 crosses (enumerated from 01 to 64) in the F2 generation
Parents1 (9) (10) (11) (12) (13) (14) (15) (16)
(1) N° Cross 01 02 03 04 05 06 07 08
h% -1.80 -10.8 24.4 11.3 -37.7 -24.3 43.9 -34.9
ID -0.454 -2.86 6.80 2.66 -11.6 -6.91 9.01 -10.6
h2 46.3 33.2 -24.7 46.8 17.2 16.7 65.9 6.79
(2) N° Cross 9 10 11 12 13 14 15 16
h% -19.8 -26.3 10.2 -17.7 -35.3 -15.9 27.2 19.3
ID -5.50 -7.57 2.42 -4.85 -10.7 -4.31 5.98 4.41
h2 8.31 -16.3 13.0 25.3 34.4 X 31.7 47.6
(3) N° Cross 17 18 19 20 21 22 23 24
h% 19.4 -25.6 12.2 17.7 2.79 37.7 14.5 -1.29
ID 4.42 -7.34 2.88 4.06 0.687 7.93 3.38 -0.324
h2 12.5 -3.22 -18.8 17.9 33.1 -18.9 16.7 31.0
(4) N° Cross 25 26 27 28 29 30 31 32
h% -8.57 -4.14 12.6 49.0 48.3 4.17 27.4 9.67
ID -2.24 -1.06 2.97 9.84 9.73 1.02 6.03 2.30
h2 60.0 50.6 52.7 53.4 66.6 40.0 58.4 51.9
(5) N° Cross 33 34 35 36 37 38 39 40
h% 7.04 18.7 6.93 -8.96 -39.5 38.8 49.2 15.6
ID 1.70 4.27 1.68 -2.35 -12.3 8.13 9.88 3.61
h2 43.8 24.1 36.1 21.6 18.1 32.3 49.3 23.3
(6) N° Cross 41 42 43 44 45 46 47 48
h% 4.53 16.21 29.50 22.0 2.49 1.48 31.7 -9.08
ID 1.11 3.75 6.43 4.96 0.616 0.366 6.84 -2.38
h2 39.3 26.5 4.46 41.8 33.9 45.9 -6.61 1.90
(7) N° Cross 49 50 51 52 53 54 55 56
h% 0.332 -1.15 10.3 3.14 -35.2 15.6 -29.8 6.02
ID 0.083 -0.290 2.45 0.774 -10.7 3.62 -8.75 1.46
h2 10.0 37.7 29.5 16.1 -4.02 18.0 18.6 4.55
(8) N° Cross 57 58 59 60 61 62 63 64
h% -52.9 -21.6 66.5 18.8 13.6 -23.1 13.3 -12.1
ID -18.0 -6.04 12.5 4.30 3.20 -6.54 3.13 -3.22
h2 24.1 -6.19 7.48 43.4 28.3 -9.35 -6.39 23.3
ACKNOWLEDGEMENTS
The authors are grateful to Capes and CNPq, for the financial support, and the University of São Paulo, College of Agriculture “Luiz of Queiroz”, Department of Genetics, for providing the facilities used in this research.
REFERENCES
Bernardo R (2010) Breeding for quantitative traits in plants.2nd edn, Woodbury Stemma Press, Minnesota, 369p.
Burton JW (1997) Soybean [Glycine max (L.) Merr.] Field Crops Research 53: 171-186.
Carvalho ADF, Geraldi IO and Santos VS (2009) Evaluation of F2:4 and F4:6 progenies of soybeans and perspectives of using early generation testing for grain yield. Bragantia 68: 857-861.
Cho Y and Scott RA (2000) Combining ability of seed vigor and seed yield in soybean. Euphytica 112:145-150.
Colombari Filho JM, Geraldi IO and Barona MAA (2010) Heterose e distâncias genéticas moleculares para a produção de grãos em soja. Ciência e Agrotecnologia34:940-945.
Cruz CD (2013) GENES- a software package for analysis in experimental statistics and quantitative genetics. Acta Scientiarum. Agronomy 35: 271-276.
Cruz CD, Carneiro PCS (2003) Modelos biométricos aplicados ao melhoramento genético.Editora UFV, Viçosa, 585p.
Cruz CD and Vencovsky R (1989) Comparação de alguns métodos de análise dialélica. Revista Brasileira de Genética 12: 425-438. Dudley JW and Moll RH (1969) Interpretation and use of estimatesof
heritability and genetic variances in plant breeding. Crop Science 9:257-262.
Federer WT (1956) Augmented (or hoonuiaku) designs. Hawaiian
Planters’ Record 55: 191-208.
Fehr WR (1987) Principles of cultivar development: theory and
technique.v. 1, Macmillan, Publishing, New York, 536p.
Freire Filho FR and Vello NA (1989) Combining ability, heterosis, heterobeltiosis in early soybean genotypes. In IV Anals of world
soybean research conference IV.Buenos Aires, p. 953-957.
Griffing B (1956) Concept of general and specific combining ability in relation to diallel crossing systems. Australian Journal Biology
Science 9: 463-493.
Oliveira IJ, Vello NA, Vieira PMJ and Wysmiersky PT (2014) Diallel among soybean genotypes with high oil content and resistance to sudden death syndrome. Brazilian Archives of Biology and Technology 57:
178-186.
Pandini F, Vello NA and Lopes ACDA (2001) Performance of agronomic traits in a soybean F1 diallel system. Crop Breeding and Applied
Biotechnology 1: 229-243.
Ramalho MAP, Ferreira DF and Oliveira AC (2012) Experimentação em genética e melhoramento de plantas. Editora UFLA, Lavras, 305p. Ramalho MAP, Santos JB and Zimmermann MJO (1993) Genética
quantitativa em plantas autógamas: aplicaçõesno melhoramento
do feijoeiro. UFG, Goiânia, 271p.
Rosal CJS, Ramalho MAP, Gonçalves FMA and Abreu AFB (2000) Early selection for common bean grain yield. Bragantia 59:189-195.
Scott AJ and Knott MA (1974) A cluster analysis method for grouping means in the analysis of variance. Biometrics 30: 507-512. Sinha SK and Khanna R (1975) Physiological, biochemical, and genetic
basis of heterosis. In Brady NC (ed) Advances in Agronomy. Academic Press, Cambridge, p.123-174
USDA - United States Department of Agriculture(2017) Available at: <http://www.nass.usda.gov/Statistics_by_Subject/?sector=CROPS>. Acessed on July 2, 2017
Vencovsky R and Barriga P (1992) Genética biométrica no fitomelhoramento.Revista Brasileira de Genética, Ribeirão Preto, 486p.
Yadav NS (1996) Genetic modification of soybean oil quality. In Verma DPS and Shoemaker RC (eds) Soybean genetics, molecular biology
and biotechnology.CAB, Wallingford, p.127-188.