Bolm Inst. oceanogr., S Paulo, 29(1) :41-55, 1980
A STUDY OF THE CIRCULATION IN BAY OF ILHA GRANDE AND BAY OF SEPETIBA*
PART Ii A SURVEY OF THE CIRCULATION BASED ON EXPERIMENTAL FIELD DATA
SfRGIO ROMANO SIGNORINI
Instituto Oceanográfico da Universidade de são Paulo
Synopsis
A discussion of the tidal~ wind-driven~ and density-driven aspects of the circu-lation in Bay of Ilha Grande and Bay of Sepetiba (BrazilJ ~ based on historical data and hydrographic and current mete'!> data coUected ·in Septerriber of 19??~ is present ed in this paper. The data analysis has shown a remarkable contrast between the
circu-lations of these two adjacent Bays. The circulation in Bay of Sepetiba is strongly
tidal~ whereas Bay of Ilha Grande has a weak tidal circulation superimposed by a quasi-steady flow induced by density gradients. The stratification is maintained because Bay of Ilha Grande~ beeing deeper~ allows colder and saltier shelf water
to flow eastward towards the fresher and warmer water flowing out of Bay of
Sepetiba~ highly influenced by river runoff. The velocity and density fields have
shown seiche osciUations that agree very weU with theoreticaUy derivedmodes inherent to the local geometry and density stratification.
Introduction
Bay of Ilha Gra~de consists of two bodies
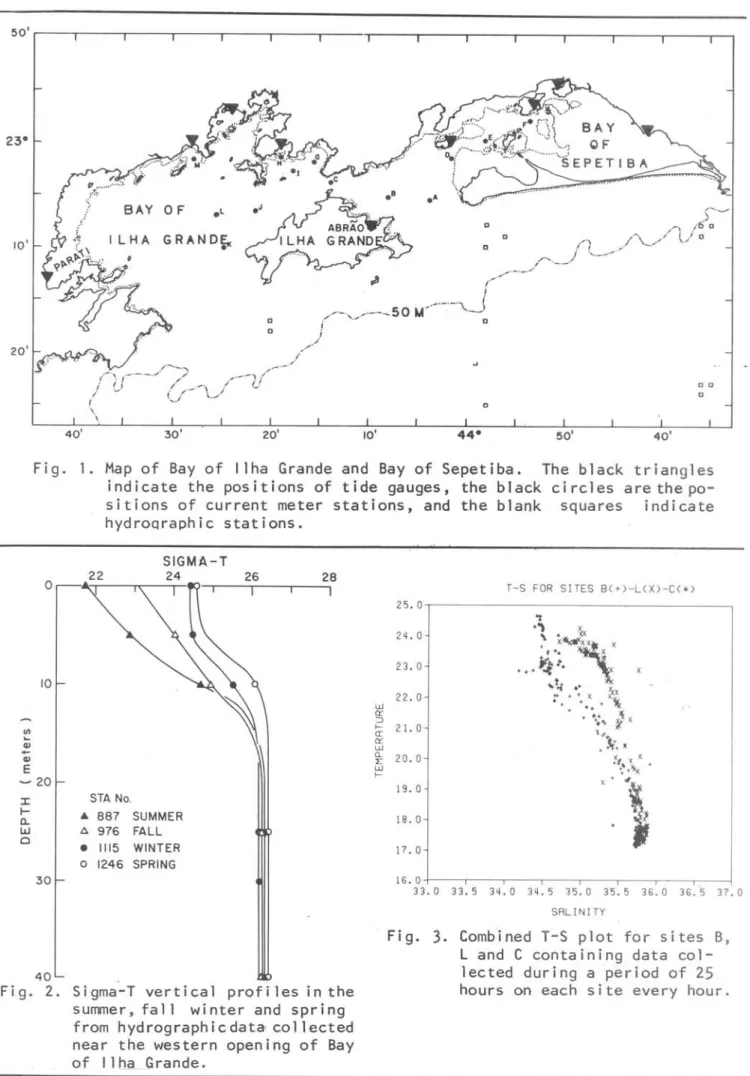
of water separated by a constriction formed between the continent and an island, Ilha Grande (Fig. 1).
Hydrographic data collected in the past years by various investigators have indicated that the combination of Bay of Ilha Grande and Bay of Sepetiba, an estu-arine body of water connected to Bay of Ilha Grande on its eastern side, which provides mos t of the fresh water to the region, forms a partially mixed es tuarine systemo
The circulation within such systems is known to be of both tidal and non~
tidal origino Ext~nsive research in the past few decades has focused upon gravi-tational convection, which is one aspect of the non-tidal portion.This quasi-steady motion is a distinctive property of estuaries arising from the combined effects of river and ocean water density differences and tidal mixing.
*
This paper is part of a Ph. D. Thesis submitted to the Graduated School of Oceanography of the University of Rhode Island, USA.Publ. nQ
483do Inót.
oQeano9~.da
U~p.Superimposed upon the gravitational convection, there are tidal oscillations and wind-driven motions o There is reason to believe that alI these driving mech-anisms are important in Bay of Ilha Grande. A quasi-steady clockwise
circu-lation around Ilha Grande, with reported durations far larger than tidal periods, has been observed on many occasions
(Ikeda 1977, and by the author in a survey taken in September 1977).
In this clockwise non-tidal flow, salty shelf water would eventually enter the Bay through its western opening to the ocean, circulate around the island, probably mix with fresher water on the eastern side provided by the outflow of Bay of Sepetiba and finally work its way out to the ocean through the eastern opening. This non-tidal behaviour sug-gests that the circulation in the Bay might be driven by forces other than
42
Hydrographic data
In the September 1977 survey, time series of temperature and sa1inity were taken by means of hour1y hydrocasts in sites L, B and C, from which the density time " series were computed. These resu1ts will
be discussed 1ater.
Besides the fie1d work undertaken in September 1977, a few more sources Qf hydrographic data are avai1ab1e. Four oceanographic cruises, one for each season of 1970, were undertaken by the Instituto Oceanografico da Universidade de são Paulo in the she1f region off the coast of Rio de Janeiro. Seven stations fa11 within the 1imits of the open boundaries
adopted for the region to be studied, four a10ng western ocean boundary and three a10ng the eastern one. The 10-cation of these stations areshown in Figure 1 by means of b1ank squares. On the western side on1y two squares were p10tted because there are two
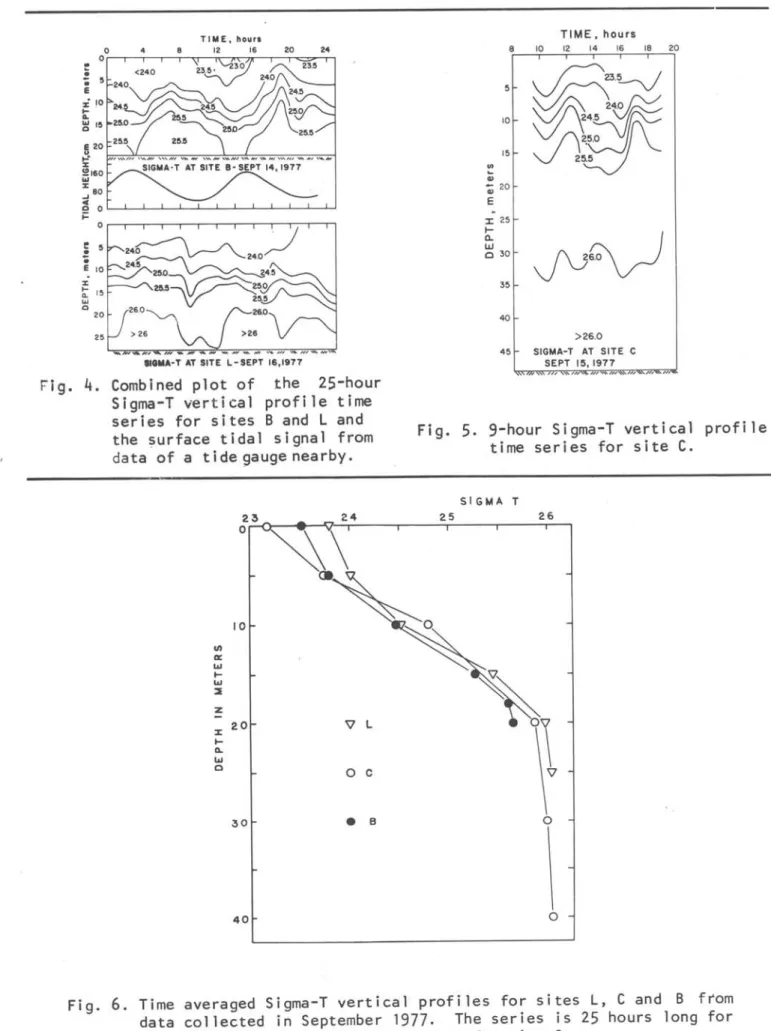
stations with coincidenta1 positions. Figure 2 shows sigma-T vertical profi1es for the stations near the western opening. They show an upper
15-meter 1ayer where a seasona1 pyc-noc1ine starts to deve10p in the spring with gradients increasing towards the
summer months. The 10wer 1ayers be10w 15-meter depths, however, are remarkab1y isopycna1 with a sigma-T va1ue fair1y c10se to 26.00. The T-S re1ationship for this water indicates that it has characteristics of South At1anticCentra1 Water usua11y found much deeper (around
200-meter depth) on the shelf edge of the region. A1though the mechanisms by which South At1antic Central Water finds its way into these sha110w areas remains to be proven, some mechanisms invo1ving the dynamics of the Brazi1 Current and
upwelling off the coast of Cabo Frio (Cabo Frio 1ies to the east of Bay of Ilha Grande and it is not shown in Figure 1) were suggested by Signorini
(1978) o
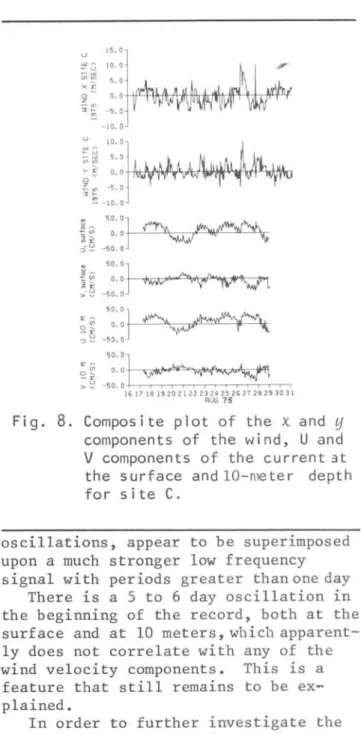
A T-S diagram for the combined time series from sites B, L and C is shown in Figure 3. For temperatures greater than 20°C, which correspond to depths sha110wer than 15 meters, the data points for site L, which is on the western side of the Bay, indicate significant1y higher sa-1inities than the data points for sitesB and Co The sa1inity at site B is inf1u-enced by the fresher water outf10w from
Bolm Inst. oceanogr., S Paulo, 29(1),1980
Bay of Sepetiba and has a somewhat lower salinity than site C (at the constriction).
For the data points with temperatures 1ess than 20°C, corresponding to depths higher than 15 meters, the three sites show a1most identica1 T-S behaviour, an indication of horizontal homogeneity for this water mass which is like1y to derive from the mixing of the South At1antic Central Water anoma10us1y 10cated on the she1f and coas tal water.
Figure
4
contains a 25-hour sigma-T time series for site B (eastern side) , the surface tida1 e1evation prediction computed from data co11ected nearby, and the 25-hour sigma-T series for site L (western side) o The inc1usion of the tida1 signa1 is to show that the 5 to 10 meter osci11ation in the pycnoc1ine atsite B cou1d not be a resu1t of contami-nation of the record due to the barotropic tides which span on1y a meter in ampli-tude. However, based on these short time measurements a10ne it is a1most impossib1e to derive any conc1usions about the nature of these interna1 oscillations.
Figure 5 shows the sigma-T time series at site C for 9 hours of obser-vations. Again, interna1 osciJlations with amplitudes near 5 meters are present. At this site the period of the
osci1-1ations seems to be c10se to 6 hours. It will be shown in the next section that current osci11ations with the same period were observed on the same site in August 1975 and September 1977.
The density time series of Figures 4
and 5 are usefu1 to i11ustrate interna1 motions in the density fie1d but it is a1so important to estimate the density differences between the three sites in order to investigate the possibi1ity of density gradients that cou1d favor the existance of density driven f1ows.
Since the observations on the three sites were not simu1taneous and the time series for site C is on1y 9 hours 10ng as opposed to 25 hours for sites L and B, the density time series were time aver-aged in order to produce a sing1e verti-cal density profi1e for each site (Figo
6) ~
SIGNORINI: Circu1ation: Bays of Ilha Grande and Sepetiba 43
50'r----.---.----,---,---,---,---,---,---,---,---,---,---,----,,-,
lO'
20'
40'
GRAND~
30'
o
o o o
Fig. 1. Map of Bay of Ilha Grande and Bay of Sepetiba. The black triangles indicate the positions of tide gauges, the black circles are the po-sitions of current meter stations, and the blank squares indicate hydroqraphic stations.
SIGMA-T
22 24 26 28
Or--A~--~~--~'IO-~--~----T_--~
IJ)
~
cu
.-cu
E
10
~ 20
:I:
l-a..
lJ.J
o
30
40
STA No.
A 887 SUMMER
I:>. 976 FALL
• 1115 WINTER o 1246 SPRING
Fig. 2. Sigma-T vertical profi 1es in the summer, fa 11 wi nter and spr i ng from hydrographicdata' co11ected near the western opening of Bay of 11 ha Grande.
w o::
::J
f--cr o:: w a..
:EC
w
>-T -S FOR S I>-TES B(+)-L(X)-C(.) 25.0
':
.'\ x
2 ~. o
~
:; +.;...::'"
x23.0 + • + ~:.
.. tt .'
22. o .... + + x lX
• + + .... \:
+ + .+. :; X
21.0 1"
."
+
k+.
2 o. o x X
+~+\x +
+
'1
19. o
18. o
.
17. o
16.0~----,---,----,---_, ---.----._--._--~
33.0 33.5 3~.0 3~.5 35.0 35.536.036.537.0 SALlNITY
44
TIME, houn
0°r-.-~4-'r-8~rr-~12~~;16-,~2~0~~~~
e
!
.
Ej 5
• E 10
:z:
t 15
'"
Q 20
25
""'A-T AT SITE L-SEPT 16,1917
rig. 4. Combined plot of the 25-hour Sigma-T ver t ical profile time series for sites B and L and the surface tidal signal from data of a tide gauge nearby.
24
10
In
a::
UI
f-UI
~
~
:z: 20
f-Il.
\01 o
30
40
Bolm Inst. oceanogr., S Paulo, 29(1), 1980
TIME. hours
8 10 12 14 16 18 20
5
~Z3
.~
~~
10
15
Yli!ft
25.5
.,
...4> -;; 20
E
-J: 25
f-J\3~
!lo
W
o 30
35
40
> 26.0
45 SIGMA-T AT SITE C SEPT 15,1911
"" "" " "'" .",,""" "'" ,*""~,; ... ,,,,;: , ... "
Fig. 5. 9-hour Sigma-T vertical profile time series for site C.
SI GIolA T
25 26
o
SIGNORINI: Circulation: Bays of Ilha Grande and Sepetiba
45
stratification and the corr~sponding
pressure gradients are shoWt\ in Table I. The pressure gradient; between sites L ande shows little variation with depth . and it is always positive (or eastward).
favoring a clockwise density driven flow around Ilha Grande. On the other hand, the pressure gradient between sites e and B shows more variation with depth and the values are negative (westward) at the surface and 5 meters and positive
(eastward) at 10 and 20 meters. The'
n~Aative values of theI?ressure gradient in the top 10 meters could 1:>e related to the fact that near site B the surface density changes occur much faster than the other two sites due to the strong alternating tidal flow mixing fresher
surface water from Bay óf Sepetiba with
ocean water from the shelf region and the fact of the data :was not simultaneously collected could reflect more on the compu-tation of the pressure gradients between sites C and B than sites L and C.
The available current meter data have shown no indication of a non-tidal two-layer flow through the channel between the two Bays and therefore it seems unlikely that any opposing gradients, due to a possible free-surface slope, would be competing with the pressure gradients due to the density strati-fication favoring the eastward flow through the channel.
Another source of information about the horizontald_istribudon of density in Bay of Ilha Grande comes from
temperature and sàlinity survey made by
Miranda
et at.
(1977) in June 21 of 1975 •They employed a continuous temperature and salinity recorder which allows a quick coverage of large areas since the data collection is done with the ship under way. The resul t is a verysynoptic
view of the salinity and temperature '
distrib~tions in the area. Their survey of the entire region of Bay of Ilha Gran-de took only 12 hours.
The· surface distribution of sigma-T, computed from their salinity and temper'" ature continuous records, is shown in Figure 7. The horizontal density gradi-ents_ in Bay of Ilha Grande arepositive in the eastward direction, favoring a clockwise density flow around Ilha Grande. The influence of the fresher water
runoff from Bay of Sepetiba is indicated by the low density tongue near the
eastern ocean bou~dary.
Current and wind measurements
Wind and current observations collected in--1975 were kindly made avaHable to the author by the Hydrographic Office of the Brazilian Navy (Direto·ria de Hidrogra-fia e Navegação). The observations were made at 13 sites scattered throughout the Bay. These are labeled A through M in
Table I - Mean density strati fication and pressure gradients between . 5 i tes L, C and B
(I0 5dynes / em2 ) PRESSURE GRAOIENT
MEAN OENS I TV (cr tl PRESSURE
(IO·Sem/s2 )
OEP7H (m) S I TE L S ITE C S ITE B S I TE L S ITE C S ITE B L • C C - B
°
23.802 23 . 172 23 . 5245 .
°
I 71 5.0149 5.°
159 10. I -9.05 24 . 011 23 . 736 23. 779
lO.n360 10 . 0338 10 . 0341 10. 1 -2.5
10 24 . 51 7 24 . 79 2 24 . 467
15 .05 84 15 . 0566 15 . 05 59 8 . 3 6.4
15 25. 44 2 25.333 25.262
20 . 084 4 20 . 082 1 20 . 0807 11.1 13.2
46
Fig.
7.
Surface Sigma-l distribution de-rived from a thermosalinograph data. lhe dots represent the data points along the ship's track used to draw the density distribution (Adapted from Mi randa e;t a-t., 1977).Figure 1.
A statistical monthly distribution of wind force and direction, as well as some current observations inside Bay of
Sepetiba, were made available by the Ins-tituto Nacional de Pesquisas Hidro-viarias (INPH, 1977 a,
b).
In addition, in September 1977 a field work was undertaken on board the University of S~o Paulo R/V '~rof. Wo
Besnard" in order to gather further information on tides, currents, winds and the hydrography of the region. The ship wasmoored for 25 hours at sites L and B and on-deck readings were taken at intervals of 30 minutes for the wind speed and direction, and intervals of 15
minutes for the current speed and di-rection o
A current meter was aIs o moored at a depth of 25 meters in site C for a period of 4 days (see Fig. 1 for location of sites) •
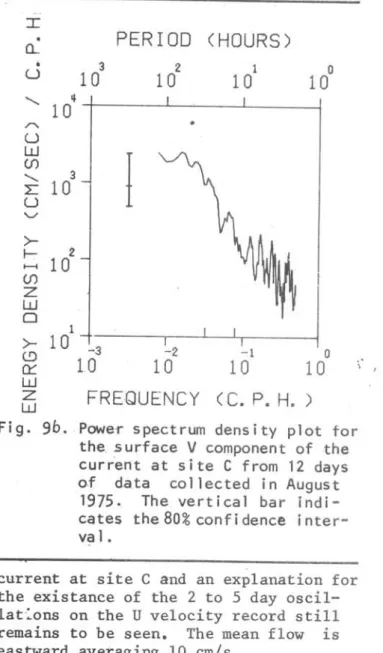
Figure 8 shows the longest time series available for the region taken at site C in August 1975 (located at the center of the passage between the island and the continent). The wind and currents are divided into two components, the X com-ponent being along the longest dimension of the Bay (061.7° clockwise from the true north) positive eastward, and the
y
component normal to it and positive northward (331.7° clockwise from the true north). This coordinate system will , be used throughout this study.The current velocity series in Figure 8 is about 12 days long with a sampling
interval of one hour o A simple visual inspection of the current signal shows that high frequency, small amplitude
Bolm ,Inst. oceanogr., S Paulo, 29(1), 1980
g ~ 50.
O]
~ ~ o. o ::l ~ - 50 . o
g ~ 50.0]
':: (f) O. o
;l i'
>~ -50 . 0
50. O]
~~ O.O~~
::::l ~ -50. o
5o.0l
~ ~
-5::
:+--.,
'?~~~' : ~. :: ~'~ """""~.--JiII\
~
16 17 18 1920212223 21l 25 26 27 28 29 30 31
AUG 75
Fig.
8.
Composite plot of the X andy
components of the wind, U and V components of the current 3t the surface and lO-meter depth for site C.
oscil1a.tions, appear to be superimposed upon a much stronger low frequency signal with periods greater than one day
There is a 5 to 6 day oscillation in the beginning of the record, both at the surface and at 10 meters, which apparent-ly does not correlate with any of the wind velocity components. This is a
feature that still remains to be ex-plained.
In order to further investigate the nature of the current signal, the power spectrum of the U and V velocity com-ponents at the surface was computed. These are shown in Figures
9a
and9b.
The Fast Fourier Transform algorithm was used and the time series that
origi-nated the spectrum had 256 data po i nts with a sampling interval of one hour.
The spectrum shows high energy density at the lower frequency range
(red spectrum) and this can be explained by the fact that the energy has been leaked out of fhe low frequency oscil-lations that appeªred on the r e cord fo r only one or two periods o In order to resolve the low frequency signal the series should have been at least ten times longer.
SIGNORINI: Circulation: Bays of Ilha Grande and Sepetiba
47
;enough frequency reso1ution so that a significant peak appears at a period of six hours. The 80% confidence interva1 is indicated by vertical bar in Figure 9.
The two tick marks on the upper side of the frequency axis correspond to the semi-diurna1 tide period (12.42 hours) and the inertial period for the latitude of the Bay (30.7 hours). There is no peak at the semi-diurna1 tide period. This suggests that the semi-diurna1 tide is not significant in the f10w near site C.
In an attempt to determine a possib1e low frequency corre1ation between wind and c_urrents the time seríes of , FiBure 8
PERIOO CHOURS)
3 2 1
10
10
10
10
=r:
1 0
5 +-__ ---1 _ _ _ ---L-_ _ ---JCL
.
U
'- 10"
'"
u
w
(f)
;: 10
3U
'-./
1
>-
10
(!)
~
W
Z
W o
I
o
1 O
-t--~--.----.JL--..I,_--__l-3 -2 -1
o
10
10
10
10
FREQUENCY CC. P. H. )
Fig.
9a..
Power spectrum density plot forthe surface U component of the
current at site C from 12 days
of data collected in August
1975. The vertical bar
indi-cates the 80% confidence
inter-vaI.
wa-s -low pass filtered w1.th a ' cutoff frequency of approximately 9 hours o The low passed time series of·wind and
surface current are shown in Figure 10. There is no. indication of any
corre-lation between the local wind and the
- ,
I
.
CL
• 3
U
10
PERIOO CHOURS)
2 1
10
10
10
o
,
10"~--~~~--L--~'"
U W
(f)
i:
10
3 U'-./
>-I-:- 2
... 10
I
: 1 O'
-t_-3----,~r2---.l.--L,1
~-1---11
o
~
1.0
10
10
10
w
z
w
FREQUENCY CC.P.H.)
.'
,
Fig. 9b.Powe·r spectrum density plot for the, surface V component of the current at site C from 12 days of data collected in August
1975. The vertical bar
indi-cates the 80% conf i dence i
nter-va 1.
current at site C and an exp1anation for the existance of the 2 to 5 day osci1-1at:ons on the U ve10city record sti11 remains to be seen. The mean f10w 1S
eastward avetaging 10 cm/s.
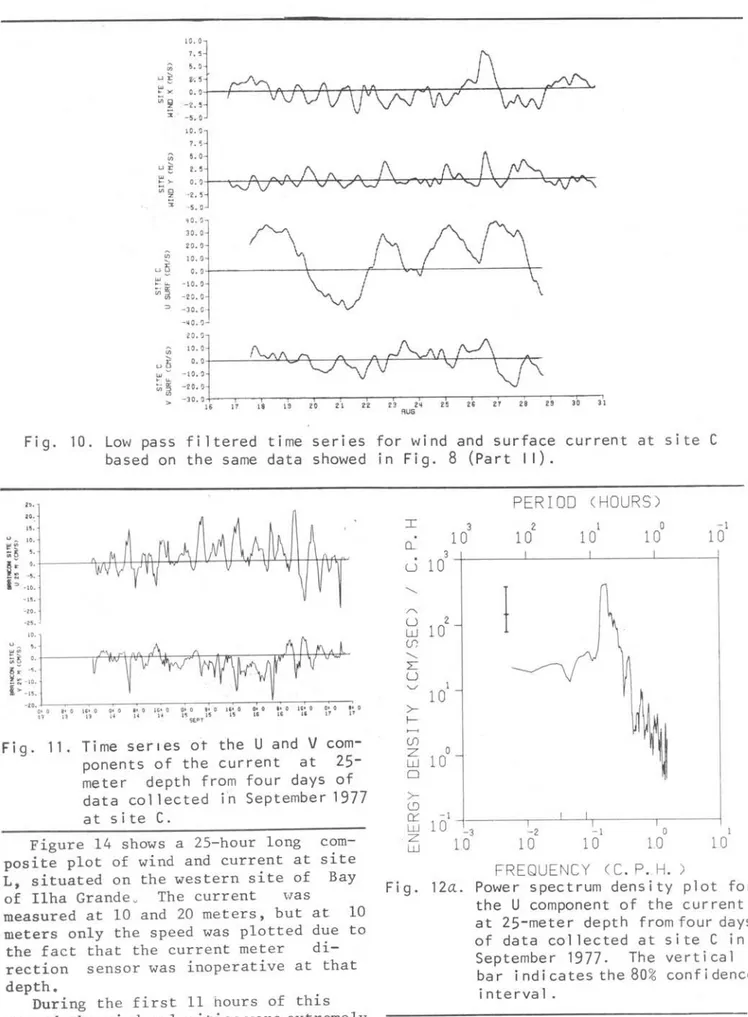
Figure 11 shows the U and V com-ponents of the current at 25 meters in site C from data generated two years 1ater (September 1977) by a moored current ' meter for
a:
period of four days. The aver-age current is southeastward with a magni-tude of 3 cm/s, but significant osci1-1ations are superimposed upon this mean flow. The power spectrum' for this re-cord was computed fol10wing the same procedure used before. The time series consisted of 259 data points with a . sampling interval of 20 minutes o Thepowerspectra ,is shown in Figures l2a and l2b. Agaín, there is no indication
oi
the semi-diurnaltide but the peak at .6 hours is obviously present this time'too.
48
,0.0
1
7.5
U) 5.0
~ 5 v.! ~ x o. ')
Vi!f -2.5
:% . -5. o
liO,')
30.0 20.0 ' 0.0
Bolm Inst. oceanogr., S Paulo, 29(1),1980
o. 0+---I-- ---7L---..:1.-r+---~--_+_
'"
.... Lo.. -10. ')
;;;~ -20 .0
~:;iij+---'-
- 30. 'J:1:16-<:17--:-r,s:---,sc--:2,~~:-:---A--7"'::~~~~~T
'o -2"-'-2""'2--"23-'2.--2', -2',-.T",-.-r
S-'2S---'30--'Ú AUGFig. 10. Low pass filtered time series for wind and surface current at site C based on the same data showed in Fig.
8
(Part 1 I).11:\1=
o. o 8' o=V}=:V:::=:=ryt?f=~=~J
16' o D' o 8' o 16' (} O. o 8' o U. o o. o I' o 16' o O· o lo o 13 13 11 H H I~ 1'5 15 1'5 Ui 16 t$ 11 1'7SEPT
Fig. 11. Time serles ot the U and V com-ponents of the current at
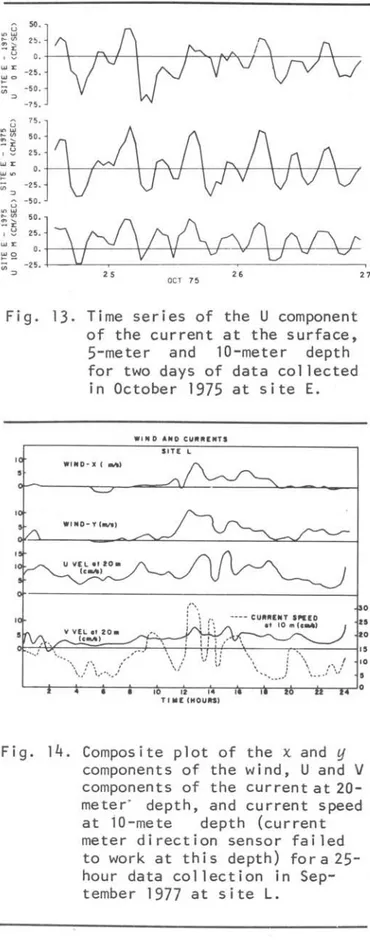
25-meter depth from four days of data co 11 ec ted in Septembe r 1977 at site C.Figure 14 shows a 25-hour long posite plot of wind and current at L, situated on the western site of
com-site
Bay
10 of Ilha Grande u The current \laS
measured at 10 and 20 meters, but at meters only the speed was plotted due to
the fact that the current meter di-rection sensor was inoperative at that depth.
During the first II hours of this record the wind velocities were extremely
~eak or totally nonexistent. However,
even though no noticeable wind was present, at 20 meters the water was flowing in
PERIOO (HOURS)
I CL
3 2 1 o
10 -1
10 10 10 10
3
U 1 O +--~--~--~ ---j
"-~
102c.n
'-.. :L
U
'-./ 1
>-
f--c.n
10
~
100O
>-l')
O::: -1
W 10 -3
Z
W 10
I
-2 -1 o
10 10 LO 10
FREQUENCY (C . P. H. )
1
Fig. 12a. Power spectrum density plot for
the
U
component of the current at 25-meter depth from four days of data co11ected at site C in September 1977. The vertical ba r i nd i cates the 80% conf i dencei nterva 1 .
SIGNORINI: Circulation: Bays of Ilha Grande and Sepetiba
49
After these first 11 hours of data,the wind started to blow from the southwest in an impulsive fashion, increasing the strength of the current and, at the same time, triggered a noticeable seiche-like oscillation with a period of the order of an hour in the U component of the current velocity. This oscillation apparently died out as
the wind ceased to blow.
:r::
D- PERIOO (HOURS)
U
"--N
o
-110
10
..-*
"
U
W (f)
"-- 1
L
10
u
'-"
>-f-
o
~
1 0,
~
I I>-
1 O
_-z--L---1-r - - . - - - - rI 1-~
~
10
10
110
010
1W
~ FREQUENCY (C. P. H. )
Wig.12b. Power spectrum density plot for the V component of the current at 25-mefer depth from four days of data collected at site C in September 1977. The vertical bar indicates the 80% confidence
t-nterva 1.
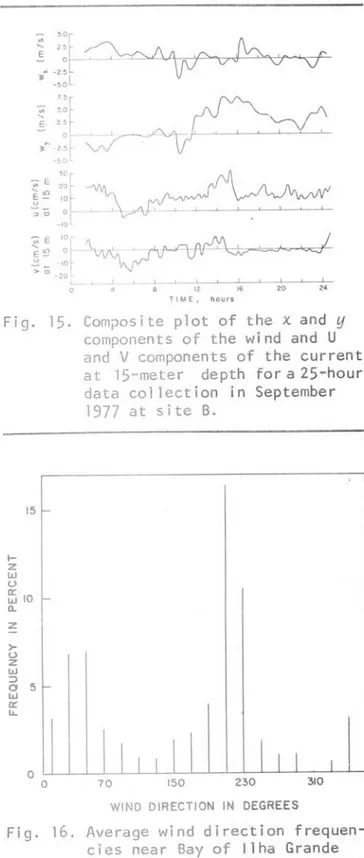
Figure 15 shows a 25-hour long time series of the X and Ij components of the
wind velocity and the two components of the current at 15 meters for site B. There seems to be no apparent corre-lation between the local wind and the current at this site. The U velocity averages 1l'.5 cm/s and the V velocity -1.8 cm/s. Therefore the flow is mostly eastward, which fits the pattern dis-cussed previously, i.e., a clockwise flow around Ilha Grande. Oscillations . with periods ranging between 30 and 45
minutes are constantlx present on the .record.
, The average wind direction frequen-cies near Bay of Ilha Grande, compiled
from data taken by the Santa Cruz Air Force Base in the period between Sep-tember 1974 and December 1975, are shown in Figure 16. The data shows two peaks, one at 50 degrees and one at 210 degrees, the latter being the most frequent average wind direction.
25
OCl 75
Fig. 13. Time series of the
U
component of the current at the surface, 5-meter and lO-meter depth for two days of data collectedin October 1975 at site E.
WIND AND cU'UtENTS SITE L
WIND- X C MIa'
WIND- Y ,..,.,
27
o
U
10
YV[Lot20. (clRA,
~~>F:::=:==::::.=::- .. -;-j •• L---.:~\-+/
-+
...
:h;f-f:i ~:""\-,--'-f
... -..
==:::::....~,5"\, ... ""\ ... /' \/ : '., ,",! 10
~'._-~: \. _.: '.,'
~:r-r--T.-T-~10-~12~~14.-~~r-..r~~~~·0
T I "E ,"OUIta)
Fig. 14. Composite plot of the x and Ij
50
30
t
-; E 20
' " ,
E-lo ~õ
oL
-10 L
12 16 20 24
TIME I hours
Fig. 15. Composite plot of the x and
y
components of the wind and U and V components of the current
at 15-meter depth for a 25~hour
data collection in September 1977 at site B.
I-Z
W U
15
~ 10 Q.
Z
>-u
z w
:::>
o 5
w
Ir
...
O
r-
c-
r-O
I
I
I
I
I
I
I I
I70 150 230 310
WIND DIRECTION IN DEGRE ES
Fig. 16. Average wind direction frequen-cies near Bay of Ilha Grande based on a 16-month data average from September 1974 to Oecember 1975.
The wind data also shows that the most likely wind force from any wind direction lies between 6 and 10 kftots. This infor-mation will be later used in the wind driven numerical experiments which will be presented in Part 11 of this paper.
An overall view of one of the poss i-ble circulation patterns in Bay of Ilha
Bolm Inst. oceanogr., S Paulo, 29(1)
,- +980
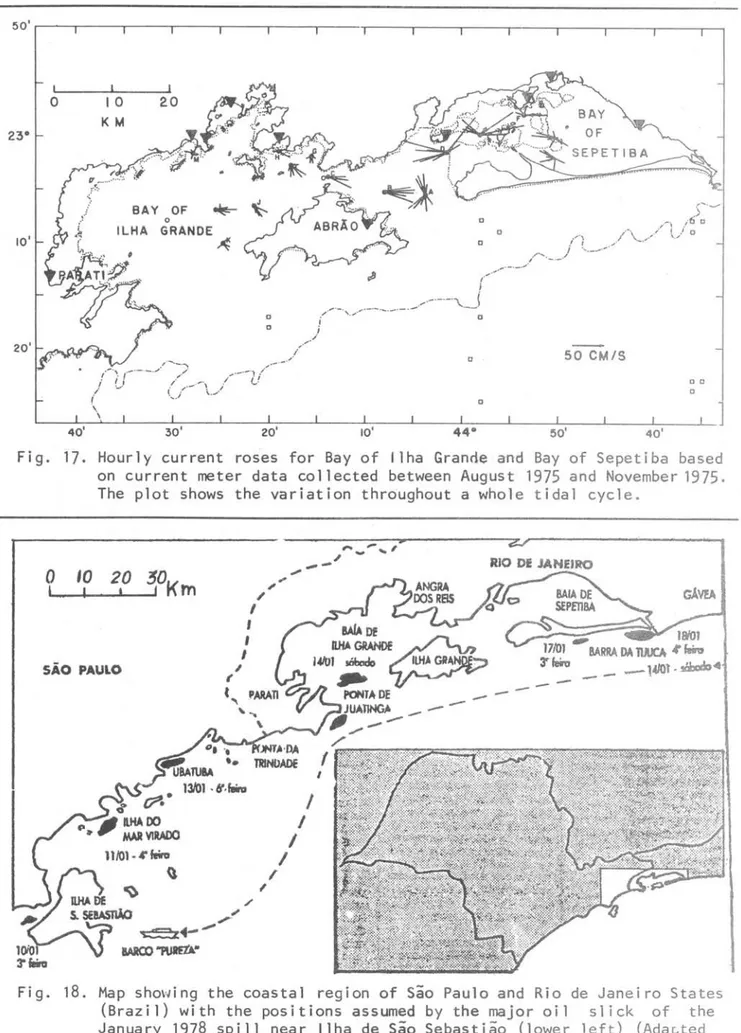
Grande and Bay of Sepetiba is shown by the current roses at 5 meters depth throughout a complete tida! cycle illus-tr a ted in Figure 17. AI though the current measurements were not made simul-taneously, the records were long enough to select portions froM each record corresponding to ' the saroe tidal ampli-tude. Those, shown in Figure 17, corre-spond very closely to spring tide. One can easily see the outstanding difference between the pattern in Bay of Ilha Grande and Bay of Sepetiba. In the former, the pattern is a quasi-steady clockwise flow around the island, whereas in the latter the flow pattern is dominated by the tides o
An unexpected source of evidence for the type of circulation just described became available in January 1978 when a major oil spill occurred in the vicinity
of Ilha de são Sebastião (Fig o 18). The Brazilian news media published, based on various sightings of the spill reported by fisherman and residents alI along the coast of são Paulo and Rio de Janeiro, a map containing the positions of the spill during January 10 to 18 reproduced in Figure 18. From Ilha de são Sebastião the spill followed the coastline in the northeast direction with an average velocity, judging from the successive positions on the map, of about 20 cm/s.
Once the spill reached the western opening of Bay of Ilha Grande it turned northward moving into the Bay and ap-parently continued to flow around Ilha Grande and out to the ocean through the eastern opening. Therefore, it seems fair to assume that the oil spill has followed the same pattern of
circu-lation indicated by the current meter measurements.
InternaI seiches
Hydrographic and current meter obser-vations at site Chave shown
oscil-lations with a period of about 6 hours o In an attempt to explain the nature of these oscillations, a simplified theory for an interfacial standing wave across a two-layer channel will be used (Sverdrup et
alo,
1942, p o 600).The density profile of Figure 206 for
site C can be approximated by a t~o
layer density profile with equal layer thicknesses(hl= h2) of the order of
20 meters, top layer density (Pl) of
1.0245 g/cm3 and bottom layer density
SIGNORINI: Circulation: Bays of Ilha Grande and Sepetiba 51
50·r_--.----,r_---r----.----,r_---r---- , ~----r_--_.----,_----._--_.----._-- --,_,
O
10'
20'
10
KM
20
BAY DF ....
o
ILHA GRANDE
~
o
o
;'
o
o
(~
i
/'-'-'"\ I
.",,,,,,_.,,.,.,,._.-._._._.- .-.... D
I
i
... /
,. o
o o
;/ ... ,
.,.;.-._ . .."
50 CM/S
o o
o
Fig. 17. Hourly current roses for Bay of Ilha Grandeand Bay of Sepetiba based on current meter data collected between August 1975 and November 1975. The plot shows the variation throüghout a whol e tidal cycle.
o
I'0
I
SÃO PAULO
,
,
,
,
,
,
"
~--,..
-
,
~
-
...-RIO Df JANEIRO
GÁV'fA
-
52
channel is the mean width of the passage between Ilha Grande and the continent, which is about 4 kilometers o
Since only vertical displacement is allowed at the solid boundaries, the fundamental wave will have one node at the center of the channel and one anti-node at each side wall o Therefore, the wavelength À of the fundamental standing wave across the channel will be À=2L, where L is the width of the channelo
The period of the standing wave will be T=À/c, where c is the phase velocity, which is given by
c
( - - - ) g(P2 - pd hl h 2 1/2 (201)hence, the period is finally given by, g(P2-Pl) hl h2 1/2
T 2L/{ } (2.2)
P2 (h1 + h2)
Substituting the values discussed previously into equation (2.2) one obtains a period of 5.8 hours. The period computed by means of this simplified approach seems to be very close to the period of the oscillations observed at site C and therefore it seems that internaI seiches are a likely feature of the region.
Seiches in the system formed by Bay of Ilha Grande and Bay of Sepetiba
The current meter data at site Chave shown oscillations with a period of about 6 hours.The period of these oscillations is many times longer than the seiche period of either Bay of Ilha Grande or Bay of Sepetiba.
In an attempt to explain this dis-crepancy, the problem will be treated as a coupled system of two water
bodies connected by a narrow channel in the light of the theory developed by Neumann (1944) , also described by Neumann &
Pierson Jr. (1966, ~.367-368).
Neumann's theory describes the
seicheing in such systems by analogy to electrical systems. The analogy is to a network of inductances and capacitances in an electrical network, with
re-sistances so small that they can be neglected.
The inductance and the capacitance can be connect~d in series or in
paral-Bolm Inst. oceanogr. , S Paulo, 29(1), 1980
leI . At th e r e sonance frequency, the circuit connec ted in series will have an impedance (a measure of the total oppo-sition to current flow in an alternating-current circuit) equal to zero and a large electric current will flow across it. On the other hand , if the circuit is con-nected in par all el, the conductance (the recirrocal of the impedance) will be zero and a larg e v oltage will develop across it.
By means of this analogy to electrical circuits, t he i mpedances of a lake, a bay, and a wide channel can be shown to be , respectively
i pCt WL
t
ZE = - cot ( - )
St Ct
Zb =
- - - -
ipCb cot (WLb/Cb) (2.3)Sb
i pC
Z c S c tan (wL c c /C ) c
where the density p is assumed constant, S is the average cross-sectional area of the body of water, c = ~ is the phase velocity , h i s the water depth, and LI, Lb and Lc t h e length of the respective bodies of wat er(i=
1=1).
The impedance of the channel in (2.3),
if the channel is short, can be written as
ipc
Z
=
--:::-_ c _q S
C
wL c
C c
ipw€.
q (2.4)
where S =q is the cross-sectional area of
the cha~nel , and t is used to designate
the channel length in this special case. The impedances can be combined to find the fr e quency of oscillation of complex systems . One of these systems is the sys t em f ormed by Bay of Ilha Grande and Bay of Sep etiba, connected by the
relativ ely narrow constriction formed between Ilha Grande and the continent.
SIGNORINI: Ci,'cvlation: Bays of ; 'Iha Grana,: and Sepetij,J
53
subscripts 1 and 2 to two 1akes, the system hooked up in series.
designate the can be considered
Thus
C wL
w.e.
which
and
Z +
1
can
2f-T
Z
q be
1
+ Z =
~
-S-L
rewritten as
T2 = 2L 2
\ i.)ll
cot 1 +
e
q1
(Merian' s f()rmuL.~. due to J .R.Merian 1828) where TI éLnd T2 a1~ ... t he p€l.·icds of
osci1-lation of t 1le sepa-:-.::' t·" lAkf':.~ and T is to
be found. !3 r ' 1. i:lt · ., :::.ó) is a
transcell-dental equation iu
r
and can be solvedgraphi ca 11~T. The. doub1e lake system thus
has periods af oscillatiün much longer than either lake alone. One lake riso' in leveI as the other sinks. At the Sru,. ·ê:
time, also, the separate modes of oscil-lation still occur, but they have much shorter periods.
The numerical approximations for the case of Bay of Ilha Grande are:
LI = 25 km L = 23 km L 2 = 53 km
h 1 28 m h 18 m
b 1 = 25 km b 4 km b2 = 11 km
where bl, b2 and b are the breadths of the two bays and channel, respectively.
The graphic solution is shown in Figure 19. The so~ution for T is met when
the right hand side and left hand side of equation (2.6) assume the samevalue. Be-yond the values oi TI
=
0.86 hours and T2=
2 .56 hours we find the long period T for the combined systemwith avalue equal to 6.35 hours . As the theory predicted, the value of T is several times longer than the individual seiche period of thei nd E'pendent bays. Furthermore, the value
of :). 35 hours agree:; fairly well with
the observed period at site C, located in rhe middle of the channel, as in Figure 8.
In order to establish error limits l n
t i" '~ 2 terml nation of the period of os
cil--l a tcil--lon i.n the combined svstem, a simple erro,:: analys is is performed.
C
2 cot wL 2
S 2
T2
cot~'--)
T
15r-r. T.
I'
I'10:
I::c
1I I :"
,
~
, 1:\
I~ 5 I \
u i "
~ I
C 2
o
(2.5)(2.6)
I
I'1
I
>- I T=6 ,35 hrs
~ ~~I~~~~~~:;~~~~~~;;;;~-L--J
O' 4 6 8 /0
~
I
Time (hours)-5:- Q/I(~cotTTf + ~cotTT
fn
-/0
-/5
Fig. 19. Graphic solution for equation (2.6). The inset shows the geometri of the coupled system.
----t' irs t, if the depths of the three
hodies of water have an uncertainty of ± 10%, equation (2.6) predicts an un-certainty of ± 5.4% in TI and T2 and ±O.87. l n T. Thus depth error has a. negligible effect on the 10ngest período
However, if the depths, lengths, and breadths alI have an uncertainty of ±10%, thepredicted uncertainty is ± 16% for TI, T2 and T. Thus it is estimated that the long period seiche of the
combined system lies between 5.3 and 7. 3 hours.
In short, the osc ll lations observed botr. on the current meter and hydro-graphic data were explained by a series of simple theoretical formulations . Table 11 summarizes the results, giving the location and depth of ~he observed
'."S~' illations and compa-::-~';-' each osc.i
1-':ii ;.on peri0c \vith i~ :~ ; ;)rn?Üsf'G t~ ·
54
Bolm Inst. oceanogr.,S Paulo, 29(1), 1980Table I I - Periods of oscillation derived from observational data and from theo-retical estimation
S IH LOCATION DEPTH OF PERIOD FROM PERIOD FROM MODE DATA ANALYSIS THEORY USED
OBS (m) DATA (hrs) THEORY (hrs) HCHNIQUE
Bay of IG 10 I. to 2. 0.9 Seiches Direction from Merian's
(western) CM record formula
Channel Surface 6.9 Seiches Neumann
Channel 5 5. o 5 . 3 in Spectral &
Channel 10 6.2 to coupled Analysis Pierson Jr.
Channel 25 5.7 7.3 system (1966 )
Bay of IG 15 0.5 to 1.0 0.5 Seiches Directly from
(eastern) CM record formula
c Channel Thermocline 5. o 5.8 Internai Directlyfrom Sverdrup et aLo
Seiches Sigma-T series (1942)
B Bay of IG Thermocl ine 12. o 12.42 Internai Directlyfrom
(eastern) Tide Sigma-T series
Bay of O, 10, I 5 6.2IandI2.42 same Tides Tide Gauge Harmonic
Sepetiba
Summary
Observational data has shown that the estuarine system formed by Bay of Sepetiba and Bay of Ilha Grande is partially mixed, where major driving meehanisms for the eireulation were
identified; tidal, wind-driven and gravitational or density driven.
The tidal portion in Bay of Ilha Grande is very weak, while the tidal signature is evident in Bay of Sepetiba where strong alternating tidal flows of
75 em/s, with a period of 6.21 hours (M 4 tidal eonstituent), were measured.
There are two probably reasons for this eontrast between the tidal eireu-lation in the two Bays. Firstly, Bay of Ilha Grande is eonneeted to the ocean by two openings at whieh the tidal wave arrives in phase synehronism and splits into two separate waves that enter the Bay and propagate in opposite direetions, having its effeets partially eaneelled,
-(M2,M4) Analysis
espeeially at the refleetion point (point whieh the two waves meet at).
Secondly, the total length of Bay of Sepetiba is very elos e to one quarter wavelength of the M 4 tidal eonstituent
(6.21 hours), whieh eould eertainly have an amplifying effeet on the standing tidal wave of that frequeney. The length of Bay of Ilha Grande is far from the quarter wavelength of either the M 2
(12.42 hours) or the M 4 (6.21 hours) tidal eonstituents.
The presenee of a eloekwise quasi-steady flow around Ilha Grande with ve-locities averaging 10 em/s was deteeted by eurrent meter measurements and
SIGNORINI: Circulation: Bays of I lha Grande and Sepetiba
55
eastern side provided by the outflow of Bay of Sepetiba and final.ly work its way out to the ocean through the eastern opening. In this process, sa 1 t and fresh
water sources are provided in order to maintain the density stratification.
Conversely, the wind ane current time series were much too short to establish a statistically significant correlation between wind and currents. However, a numerical experiment OH the wind effects,
based on the wind statistics discussedin "Current and wind measurements", will be offered in Part 11 of this paper.
References
lKEDA, Y. 1977. Influências sazonais nas propriedades oceanográficas em grande, media e pequena escalas, de Ca-bo Frio-RJ a Cananeia-SP. Tese de doutorado. Universidade de são Paulo, Instituto Oceanográfico, 83p.
INPH. 1977a. Relat~rio dos estudos hi-dráulicos na Baia de Sepetiba execu-tados pelo INPH entre 08/1974 a 12/ 1975. Rio de Janeiro, Instituto de Pesquisas Hidroviárias, vol. 1.
INPH. 1977b. Relat~rio dos estudos
hidr~ulicos na Baia de Sepetiba ~xe
cutados pelo INPH entre 08/1974 a 12/ 1975. Rio de Janeiro, Instituto de Pesquisas Hidroviãrias, vol. 2. MIRANDA, L. B. de; IKEDi]., Y.; CASTRO
FI--LHO, B. 1'-1 . de t. PEREIRA FILHO, N.
1977. ~o t0 on the occurrence of saline f r onts in the Ilha GranJe region (RJ). Bolm Inst. oceanogr., S Paulo, 26(2) :249-256.
NEUMANN, G. & PIERSON JR., W. J. 1966. Principles of physical oceanography. Eng1ewood Cliffs, N. J., Prentice-Hall, 545p.
SIGNORINI, S. R. 1978. On the circu-lation and the volume transport of the Brazil Current between Cape of são Tome and Guanabara Bay (22°-25°::='; and 39°-43°W). Deep Sea Res., 25: 481-490.
SVERDRUP, H. A.; JOHNSON, M. W. & FLEMING, R. H. 1942. The oceans, their physics, chemistry and general biolo-gy. Englewood Cliffs, N. J.,
Prentice-Hall, p. 1087.