Management in Retailing Supported by
Data Mining Techniques
Vera L´
ucia Migu´
eis Oliveira
A Thesis submitted to Faculdade de Engenharia da Universidade do Porto for the doctoral degree in Industrial Engineering and Management
Supervisors
Professor Ana Maria Cunha Ribeiro dos Santos Ponces Camanho Professor Jo˜ao Bernardo de Sena Esteves Falc˜ao e Cunha
Customer relationship management (CRM) has never been as relevant for organizations as it is nowadays. The competitive environment in which com-panies operate is forcing comcom-panies to adopt customer centered strategies. In addition, the technologic devolvement observed in recent years enabled companies to keep databases with customer related data. This allows the use of data mining techniques to extract knowledge from these databases in order to gain competitive advantage and remain at the leading edge. This thesis develops a methodology to support CRM in the retail sector, by applying data mining techniques. The research aims to contribute to the improvement of the relationship between retail companies and their cus-tomers. In order to ensure that the methodology proposed can be used in real situations, a company is used as case study.
CRM is mainly supported by 4 dimensions: customer identification, cus-tomer attraction, cuscus-tomer development and cuscus-tomer retention. The meth-odology proposed aims to tackle customer identification by segmenting cus-tomers using clustering data mining techniques. This involved an analysis considering two alternative criteria: purchasing behavior and lifestyles. Cus-tomer attraction and cusCus-tomer development are addressed by means of the design of differentiated marketing actions, based on association data mining techniques. Customer retention is approached by the development of models that determine the promptness of customers to leave the company for the competition. These models apply classification data mining techniques. The methodology proposed in this thesis contributes to the marketing liter-ature by exploring several analytical CRM dimensions in the retail sector. Moreover, it provides guidance for companies on the use of analytical CRM to support customers’ knowledge achievement and, consequently, enables the reinforcement of the relationship with customers. This thesis also demon-strates the potential of data mining techniques applied to large databases in the context of CRM.
O Customer relationship management (CRM) nunca foi t˜ao crucial para as empresas como ´e atualmente. O ambiente competitivo em que as empresas operam tem imposto a ado¸c˜ao de estrat´egias centradas no cliente. Para al´em dito, o desenvolvimento tecnol´ogico verificado nos ´ultimos anos tem permitido `as empresas manter bases de dados com informa¸c˜oes relativas aos clientes. Isto permite o uso de t´ecnicas de data mining para extrair conhecimento dessas bases de dados de forma a obter vantagens competitivas e a ocupar posi¸c˜oes de lideran¸ca.
Esta tese desenvolve uma metodologia de suporte ao CRM no sector de retalho, usando t´ecnicas de data mining. A investiga¸c˜ao visa contribuir para a melhoria da rela¸c˜ao entre as grandes empresas de retalho e os seus clientes. De forma a assegurar que os m´etodos propostos possam ser aplicados em situa¸c˜oes reais usa-se uma empresa como caso de estudo.
O CRM baseia-se essencialmente em 4 dimens˜oes: a identifica¸c˜ao, a atra¸c˜ao, o desenvolvimento e a reten¸c˜ao dos clientes. A metodologia proposta tem como objetivo abordar a identifica¸c˜ao dos clientes recorrendo a t´ecnicas de
clustering. Isto envolveu uma an´alise considerando dois crit´erios alterna-tivos: o comportamento de compra e o estilo de vida. A atra¸c˜ao e o de-senvolvimento dos clientes s˜ao abordados atrav´es do desenho de a¸c˜oes de marketing diferenciadas, baseadas em t´ecnicas de associa¸c˜ao. A reten¸c˜ao dos clientes ´e abordada atrav´es do desenvolvimento de modelos de identi-fica¸c˜ao dos clientes que poder˜ao vir a abandonar a empresa. Estes modelos baseiam-se em t´ecnicas de classifica¸c˜ao.
A metodologia proposta nesta tese contribui para a literatura de marketing atrav´es da an´alise de diferentes dimens˜oes do CRM anal´ıtico no sector do retalho. Para al´em dito, a metodologia serve como guia `as empresas de como o CRM anal´ıtico pode suportar a extra¸c˜ao de conhecimento e como conse-quentemente pode contribuir para a melhoria da sua rela¸c˜ao com os clientes. O trabalho desenvolvido tamb´em demonstra o potencial das t´ecnicas de data
My first thanks goes to Prof. Ana Camanho, whose supervision was crucial for my doctoral work. Thanks for her time and for sharing her knowledge. I also thank Prof. Jo˜ao Falc˜ao e Cunha for all comments on my work. I thank Prof. Dirk Van den Poel for welcoming me in the UGent and for providing me very good working conditions. I also thank my UGent colleagues for their hospitality, help and friendship.
I would like to express my gratitude to the company used as case study and its collaborators, particularly to Dr. Nuno and to Dr. Ana Paula, for providing the data and all necessary information. Thanks for the economic support. It enabled the discussion of the research work by the domain experts.
I also thank the Portuguese Foundation for Science and Technology (FCT) for my grant (SFRH/BD/60970/2009) cofinanced by POPH - QREN “Tipolo-gia” 4.1 Advanced Formation, and co-financed by Fundo Social Europeu and MCTES.
I thank my colleges and friends from the Industrial Engineering department for all moments of fun over the last years, particularly: Andreia Zanella, Isabel Horta, Jo˜ao Mourinho, Lu´ıs Certo, Marta Rocha, Paulo Morais, Pedro Amorim and Rui Gomes. Marta, I will miss you a lot! I also thank the Professors I have worked with, namely Prof. Ana Camanho, Prof. Jos´e Fernando Oliveira, Prof. Maria Ant´onia Carravilla and Prof. Pina Marques, for all support concerning all teaching tasks. I also thank Prof. Sarsfield Cabral, head of the department, for his encouragement over these years. I acknowledge D. Soledade, Isabel and M´onica for all nice chats and friendship. Finally I thank all my family for the support, specially my parents, my brother and my grandmother. I thank all my friends for all moments of fun, which provided me energy to conduct this project. I also thank Andr´e for his company, help, comprehension and love.
ANN Artificial Neural Networks
AUC Area Under Curve
CART Classification And Regrets Techniques CLV Clustering around Latent Variables
CRM Customer Relationship Management
DIY Do It Yourself
DVD Digital Video Device
EM Expectation Maximization
ERP Enterprise Resource Planning
EU European Union
GDP Gross Domestic Product
ID3 Iterative Dichotomiser3
IT Information Technology
KDD Knowledge Discovery in Databases
MBA Market Basket Analysis
PCC Percentage Correctly Classified
POS Point Of Sale
RFM Recency Frequency and Monetary
RM Relationship Marketing
ROC Receiver Operating Characteristic
SOM Self-Organizing Map
VIF Variance Inflation Factor
VLMC Variable Length Markov Chains WOM Word-Of-Mouth
Abstract i
Resumo iii
Acknowledgements v
Table of Contents vii
List of Figures xi
List of Tables xiii
1 Introduction 1
1.1 General context . . . 1
1.2 Research motivation and general objective . . . 3
1.3 Specific objectives . . . 4
1.4 Thesis outline . . . 6
2 Customer Relationship Management 9 2.1 Introduction . . . 9
2.2 Marketing concept . . . 9
2.3 Customer relationship management concept . . . 12
2.3.1 CRM benefits . . . 13
2.3.2 CRM components . . . 14
2.4.1 Dimensions . . . 16
2.4.2 Applications . . . 19
2.5 Summary and conclusions . . . 22
3 Introduction to data mining techniques 25 3.1 Introduction . . . 25
3.2 Knowledge discovery . . . 26
3.3 Data mining and analytical CRM . . . 29
3.4 Clustering . . . 34
3.4.1 Partitioning methods . . . 36
3.4.2 Model-based methods . . . 38
3.4.3 Hierarchical methods . . . 45
3.4.4 Variable clustering methods . . . 49
3.5 Classification . . . 49 3.5.1 Logistic regression . . . 50 3.5.2 Decision trees . . . 51 3.5.3 Random forests . . . 58 3.5.4 Neural networks . . . 59 3.6 Association . . . 63 3.6.1 Apriori algorithm . . . 65 3.6.2 Frequent-pattern growth . . . 66 3.7 Conclusion . . . 68
4 Case study: description of the retail company 71 4.1 Introduction . . . 71
4.2 Company’s description . . . 71
4.3 Loyalty program . . . 73
4.4 Customers characterization . . . 75
5 Behavioral market segmentation to support differentiated
promotions design 81
5.1 Introduction . . . 81
5.2 Review of segmentation and MBA context . . . 82
5.3 Methodology . . . 85
5.3.1 Segmentation . . . 85
5.3.2 Products association . . . 86
5.4 Behavioral segments and differentiated promotions . . . 87
5.5 Conclusion . . . 92
6 Lifestyle market segmentation 93 6.1 Introduction . . . 93
6.2 Methodology . . . 94
6.3 Lifestyle segments . . . 95
6.4 Marketing actions . . . 103
6.5 Conclusion . . . 105
7 Partial customer churn prediction using products’ first pur-chase sequence 107 7.1 Introduction . . . 107
7.2 Customers retention . . . 108
7.3 Churn prediction modeling . . . 109
7.4 Methodology . . . 112
7.4.1 Partial churning . . . 113
7.4.2 Explanatory variables . . . 114
7.4.3 Evaluation criteria . . . 118
7.5 Partial churn prediction model and retention actions . . . 119
8 Partial customer churn prediction using variable length
prod-ucts’ first purchase sequences 125
8.1 Introduction . . . 125
8.2 Variable length sequences . . . 126
8.3 Methodology . . . 126
8.3.1 Evaluation criteria . . . 127
8.3.2 Explanatory variables . . . 128
8.4 Partial churn prediction model . . . 129
8.5 Conclusion . . . 132
9 Conclusions 133 9.1 Introduction . . . 133
9.2 Summary and conclusions . . . 133
9.3 Contributions of the thesis . . . 137
9.4 Directions for future research . . . 138
A Appendix 141
2.1 Analytical CRM stages. (Kracklauer et al., 2004) . . . 17
2.2 CRM instruments. (Kracklauer et al., 2004) . . . 19
3.1 Overview of the stages constituting the KDD process. (Fayyad et al., 1996b) . . . 27
3.2 Typical effort needed for each stage of the KDD process (Cabena et al., 1997). . . 29
3.3 Classification framework on data mining techniques in CRM. (Ngai et al., 2009) . . . 33
3.4 Illustrative example of a clustering result. (Berry and Linoff, 2004) . . . 35
3.5 Kohonen map. (Yin et al., 2011) . . . 41
3.6 Probabilistic hierarchical tree. (Han and Kamber, 2006) . . . 44
3.7 Dendrogram example. (Hromic et al., 2006) . . . 45
3.8 Single linkage distance. . . 47
3.9 Complete linkage distance. . . 47
3.10 Average linkage distance. . . 48
3.11 Example of a decision tree concerning the purchase of a com-puter. (Han and Kamber, 2006) . . . 52
3.12 Random forests.(Tan et al., 2006) . . . 58
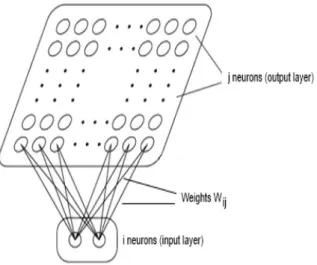
3.13 Neuron architecture. (McCulloch and Pitts, 1990) . . . 60
3.14 Most common activation functions.(Negnevitsky, 2004) . . . . 60
3.15 Single Layer Feed-forward Network example. . . 60
3.17 Recurrent Network example. . . 61 3.18 Apriori algorithm. (Rajaraman and Ullman, 2011) . . . 66 3.19 FP-tree example. . . 67
4.1 Histogram of the average amount of money spent per trans-action. . . 77 4.2 Histogram of the average time between purchases. . . 78 4.3 Distribution of the number of transactions per business unit. 78 4.4 Distribution of the amount spent per business unit. . . 79
5.1 Error measures for different numbers of clusters. . . 88 5.2 Clusters characterization. . . 89
6.1 Products’ dendrogram resulting from the varclus algorithm. . 96 6.2 Proportion of products in each business unit. . . 97 6.3 Proportion of products in the main category. . . 99 6.4 Proportion of products in each brand position. . . 100
3.1 Set of transactions. . . 66
5.1 Association rules for Cluster 4. . . 90
5.2 Association rules for Cluster 0. . . 91
6.1 Number of products in each cluster. . . 96
6.2 Relevant categories. . . 98
6.3 Distribution of customers by the clusters. . . 103
6.4 Distribution of customers by the clusters for specific stores. . 105
7.1 Performance results. . . 122
8.1 Forward model - first stage sequences selection. . . 130
8.2 Backward model - first stage sequences selection. . . 130
8.3 Performance results. . . 131
A1 Non-churners transition matrix. . . 142
Introduction
1.1
General context
Retailing is an activity that involves buying goods or services and subse-quently selling them to the final consumer, usually in small quantities and without transformation. A retailer is a reseller, i.e., obtains a product or service from someone in order to sell to others. Retail services encompass a wide variety of forms (shops, electronic commerce, open markets, etc.), for-mats (small shops, supermarkets, hypermarkets, etc.), products (food, non-food, prescription, over-the-counter drugs, etc.), legal structures (indepen-dent stores, franchises, integrated groups, etc.), and locations (urban/rural, city centre/suburbs, etc.).
The retail sector is vital to the world economy, as it provides large scale employment to skilled and unskilled labor, casual, full-time and part-time workers. In 2008 the retail sector employed a total of 17.4 million people in the EU (8.4% of the total EU workforce). The economic significance of this sector for the European Union is also revealed by its GDP share, i.e. 4.2% of the EU’s GDP in 2008 (European Commission, 2008).
diver-sity of goods and the existence of people with disposable income to purchase those goods enabled the emergence of a merchant class and numerous shops. Mass retailing began to emerge in the second half of the 19th century when improvements in manufacturing compelled merchants to build stores that could sell a wide range of products in high volume. Merchants in west-ern Europe created department stores, i.e. the first mass-retailing outlets. These stores were mainly located in city centres. This growing pattern con-tinued well into the 20th century with a cluster of stores downtown that sold many goods, and a few food and general merchandise stores in the neighbor-hoods. The last decades have been mainly characterized by the emergence of electronic commerce. Moreover, these decades have been marked by the consolidation and rise of large store chains to replace smaller or local ones. This trend has occurred earlier in the grocery context, with the well-known supermarket revolution, which drove many smaller and traditional grocery retailers out of business. A parallel movement was the rise of the so-called category killer stores. This type of stores offers a very wide selection of items in its market category and sometimes at lower prices than smaller retailers. In theory, category killers eliminate the necessity of consumers to shop around for a particular item of interest because these stores carry almost everything. Both category killer and superstore formats have been adopted in diverse areas, such as hardware, office suppliers, consumer elec-tronics, books and home decoration.
Currently the retail sector growth is slowing down. Therefore, companies are competing intensely for market share. Price is one of the most important competitive dimensions. In addition, loyalty actions, enabled by the imple-mentation of loyalty programs, are also considered an extremely important dimension of competitiveness.
Besides the changes in the form and competition in retailing, the evolution of information technology (IT) also enabled a significant reduction of
lo-gistic and store operation costs. Relevant advances in retailer’s operation is enabled by the electronic information technology, where bar-coding and electronic scanning of products play a central role.
1.2
Research motivation and general objective
Due to the increased competitiveness of the retail activity, the relationship between companies and customers became a critical factor of companies’ strategy. In the past, companies focused on selling products and services without searching detailed knowledge concerning the customers who bought the products and services. With the proliferation of competitors, it became more difficult to attract new customers, and consequently companies had to intensify efforts to keep current consumers. The evolution of social and eco-nomic conditions also changed lifestyles, and as a result customers became less inclined to answer positively to all marketing communications from com-panies. This context led companies to evolve from product/service-centered strategies to customer-centered strategies. Therefore, the establishment of loyal relationships with customers became a main strategic goal. Indeed, companies wishing to be at the leading edge have to improve continuously the service levels, in order to ensure a good business relationship with cus-tomers.
Some companies invested in creating databases that are able to store a big amount of customer-related data. For each customer, many data objects are collected, allowing the analysis of the complete customers’ purchasing his-tory. However, the information obtained is seldom integrated in the design of business functions such as customer relationship management (CRM). In fact, in most companies, the information available is not integrated in procedures to support decision making. The overwhelming amounts of data have often resulted in the problem of information overload but knowledge
starvation. Analysts have not being able to keep pace to study the data and turn it into useful knowledge for application purposes.
In this context, the doctoral work described in this thesis aims to develop a methodology to support CRM in the retail sector, such that the relationship between companies and their customers can be reinforced. This research focuses on customer identification, attraction, development and retention. The research applies data mining techniques to extract knowledge from large databases.
In this thesis, a food-based retail company is used as case study, in order to ensure that the methods and models proposed can be applied to real contexts.
1.3
Specific objectives
This section summarizes the specific research objectives. These objectives are linked to the chapters of the thesis and consequently, for each objective, the corresponding thesis chapter is indicated.
Taking into account that a retail company receives thousands of visits to its stores every day, it is not possible to know each customer personally. There-fore, from a managerial point of view, companies are not able to customize their relationship with each customer. In order to establish and reinforce the relationship with customers, companies need to identify groups of customers who can be treated similarly. This procedure allows companies to structure the knowledge concerning the customers, and to define the target market for specific marketing actions. According to companies’ goals, several mod-els of segmentation can be developed. The methodology proposed in this thesis aims to construct a segmentation model based on customers’ shop-ping behavior, namely the frequency of visits to the stores and the amount
spent. Having segmented the market, it is of utmost importance to endure the relationship with customers from specific market segments. Therefore, the methodology also intends to support the design of differentiated mar-keting actions to encourage customers from different segments to visit the stores more often and spend more on purchases. This involves promoting the purchase of different kinds of products, that are still not purchased by the clients despite their potential interest. From a technical point of view, this thesis aims to use market basket analysis within clusters to discover frequent associations between products (Chapter 5).
The research aims to explore other forms of segmentation. The methodology proposed in this thesis aims to construct a segmentation model based on the content of customers’ shopping baskets. This methodology intends to infere customers’ lifestyle from the content of their shopping baskets and to give insights into the most appropriate products to promote for each segment of customers (Chapter 6).
Considering that attracting new customers is more costly than retaining current customers, it is important to take measures to avoid customers de-fection. The methodology developed in this thesis aims to construct a model able to identify the new customers who will leave the company. The research intends to explore the use of a similarity measure of the sequences of the first products purchased with the sequences observed for churners and non-churners. The methodology aims to support the decision makers in directing their marketing efforts to those customers who are more prone to leave the company (Chapter 7).
The methodology proposed also aims to explore the use of variable length sequences of the first products purchased to identify the new customers who will leave the company. The research intends to analyze these sequences ordered in chronological order and in reverse chronological order (Chapter
8).
In order to make the methodology applicable to large databases, this thesis applied data mining techniques.
1.4
Thesis outline
This thesis includes 9 chapters, which are summarized below.
Chapter 2 presents a summary of the literature regarding marketing and customer relationship management concepts. This chapter aims to introduce the main topics covered in this thesis and to revise some existing studies centered on customer relationship marketing, in order to provide insights into the research directions addressed.
Chapter 3 provides a summary of knowledge discovery processes, giving em-phasis to the data mining stage. It presents the main data mining techniques used to support analytical CRM, in order to give insights into the techniques that could have been used in the doctoral work.
Chapter 4 describes the retail company used as a case study. This chapter contains a description of the company position in the market, store formats, organizational structure and products classification. In addition, it includes a brief presentation of the loyalty program, segmentation models and pro-motional policies conducted by the company. This chapter also includes a brief characterization of the company’s customers.
Chapter 5 proposes a method for customers’ behavioral segmentation, based on the frequency of visits and monetary value spent. This is achieved by using k -means. This chapter also proposes a model to characterize the customers’ profile within each segment, by means of a decision tree. This chapter also includes a model to identify product associations within seg-ments, which can base the identification of products which can be part of
differentiated promotions. This is done by means of the apriori algorithm.
Chapter 6 presents a model for market segmentation based on customers’ lifestyle. By using the varclus algorithm, this method identifies a group of typical shopping baskets, which are used to infer customers’ lifestyle. Customers can then be allocated to a specific lifestyle segment based on their purchase history.
Chapter 7 develops a model to address customers retention. This model (i.e. a churn prediction model) estimates the probability of a new customer leaving the company for the competition using random forests and logistic regression. This model uses as a predictor the similarity of the sequences of the first products purchased with churner’s and non-churner’s sequences. The sequence of first purchase events is modeled by means of markov-for-discrimination.
Chapter 8 proposes additional models to support customers’ retention. These models explore the use of variable length sequences of the first products pur-chased as predictors. These sequences are modeled in chronological order and in reverse chronological order. These models are supported by a logistic regression.
Chapter 9 presents the summary and conclusions of the research developed in this thesis. It also lists the main contributions of the thesis and presents some directions for future research.
Customer Relationship
Management
2.1
Introduction
This chapter provides a revision of the concepts of marketing and customer relationship management. The objective of this chapter is to introduce the main topics approached in this thesis in order to contextualize the research objectives. It also provides a brief literature review on CRM.
This chapter is structured as follows. Section 2.2 presents the evolution of the marketing concept over time, giving particular attention to the concept of relationship marketing. Section 2.3 consists of an overview of the con-cept, benefits and components of CRM. Section 2.4 gives emphasis to the dimensions and applications of analytical CRM. Section 2.5 summarizes and concludes.
2.2
Marketing concept
The initial concept of marketing focused on the process through which goods and services moved from suppliers to consumers. It emerged in the transition
from a purely subsistence-based society, in which families produced their own goods, to more cooperative and specialized forms of the civilization. For instance, the simple act of trading a tool for cereals entails some marketing aspects. The term marketing derives from the word market, which means a group of sellers and buyers that cooperate to exchange goods and services. Some researchers have divided the history of marketing into four distinct eras, corresponding to different practices and focus (Hollander et al., 2005; Boone and Kurtz, 2008). The periods commonly cited include, in chrono-logical order, the production era, the sales era, the marketing era, and the relationship era.
The production era predates the second world war. The main emphasis of marketing consisted of producing a satisfactory product, without big efforts, and introducing it to the potential customers, through catalogs, brochures and advertising. The sales era ran from the 30s to the 50s and promoted the concept of transactional marketing. Due to the excess of supply over demand, companies recognized the need of having salespeople to sell the products. The marketing emphasis was placed on developing persuasive ar-guments to encourage customers to buy the products. By the 1950s, and until the 1960s, this context evolved further into the marketing era, when companies began to adopt a customer orientation and became aware of the importance of following consumer preferences and motivations. Finally, the relationship era as well as the marketing concept as it is known nowadays had its origin in 1980s. This was a period of technological and scientific progresses which resulted in mass manufacturing. This fact, combined with the development of transport systems and mass media, namely the radio, promoted the management of the sales of goods. It created a separation between companies and their customers, since it was no longer feasible for companies to customize their products. Therefore, companies were no longer able to personally know their clients. There was practically no interaction
between customers and companies. The concept of relationship market-ing (RM), proposed by Berry (1983), arose as an attempt to minimize the gap between companies and their customers. RM is not focused on simple transactions but on retaining customers and facilitating more complex long term relationships with customers. Berry’s notion of relationship marketing resembles the ideas of other scholars studying services marketing, such as Levitt (1981), Gronroos (1983) and Gummesson (1987).
According to Sheth (2002) there are three main events that aroused the interest of companies in RM. First, the energy crises of 1970 and the conse-quent economic inflation resulted in the reduction of raw materials’ demand, which caused surplus inventories. These facts obliged companies to evolve from marketing approaches, based on transactional marketing, to relation-ship marketing, giving emphasis on retaining customers (Sheth et al., 1988). Second, research started to be focused on the distinctive aspects of services marketing and product marketing techniques, what resulted in the emer-gence of RM concept. Third, product quality became an important issue for companies, which started launching new programs to establish stronger relationships with their suppliers in order to better manage, improve and control quality. Sheth (2002) also considers three other factors that later influenced the definition of relationship marketing. First, internet and IT, such as enterprise resource planning (ERP) systems, allowed companies to focus on customer relationship management. Second, the emergence of the belief that companies should be selective and target their relationships pro-moted a new vision of marketing. Finally, the theory of Sheth and Sisodia (1999) which stated that customers outsourcing should be implemented to deal with non-profitable customers also conduced to the current relationship marketing concept.
Currently, there are several definitions of the RM concept (see Harker, 1999, for an overview). According to Gronroos (1990), RM consists of
identify-ing, establishidentify-ing, maintaining and enhancing long-term relationships with customers and other stakeholders at a profit, so that the objectives of the parties involved are met. This is done by mutual exchange and fulfilment of promises. Gronroos (1990) also claims that RM should consider the extinc-tion of the relaextinc-tionships with the customers when this is convenient. Coviello et al. (1997) defines relationship marketing as an integrative activity involv-ing functions across the organization, with emphasis on facilitatinvolv-ing, buildinvolv-ing and maintaining relationships over time.
2.3
Customer relationship management concept
CRM is based on RM and is focused on the technology underlying the man-agement of customers. CRM has its origin in the desire of combining the help desk, the customer support, the ERP and data mining (Peel, 2002). The first CRM initiatives were launched in the early 1990s and were mainly focused on call center activities (Roya Rahimi, 2007). The promising emer-gence of CRM was influenced by the advances in information technologies, data management systems, improved analytics, enhanced communications, systems integration and internet adoption (Greenberg, 2001). Currently, in information technology terms, CRM means the integration of technologies such as: datawarehouse, website, intranet/extranet, help desk, sales, ac-counting, ERP and data mining. Indeed, all information technology able to gather data is integrated in order to provide the information required to create a more personal interaction with customers (Bose, 2002).
CRM can be defined as the process of using information technology in im-plementing relationship marketing strategies, with particular emphasis on customer relationships (Ryals and Payne, 2001; Gummesson, 2008). Nairn (2002) goes further and defines CRM as a long-term business philosophy that focuses on collecting and understanding customer information, treating
dif-ferent customers differently, providing a higher level of service for the best customers and using these together to increase customer loyalty and prof-itability. This is further supported by Buttle (2003) who states that CRM is a core business strategy that combines internal processes and functions with external networks to create and deliver value to targeted customers at a profit. Buttle (2003) also highlights the importance of using high-quality customer data. Other CRM definitions can be found in the literature (see Payne and Frow, 2005; Ngai, 2005, for an overview).
2.3.1 CRM benefits
Although most benefits of CRM are different in each business area, there are some benefits common to all businesses (Swift, 2000). These benefits are generally the following: lower cost of customers’ acquisition, improvement of customer services, customer retention and loyalty increase, higher cus-tomers profitability, easier identification of profitable cuscus-tomers and com-panies’ productivity increase (Alhaiou, 2011). The cost of customers ac-quisition decreases due to the possibility of saving on marketing, mailing, contact, follow-up, fulfilment services and so on (Swift, 2000; Romano and Fjermestad, 2003; Curry and Kkolou, 2004). Customer service improves due to the analysis of processes promoted by CRM. The data integration and the knowledge sharing with all dealers incites the design of customized processes, what stimulates increased levels of service (Fjermestad et al., 2006). As a consequence of customer service improvement, customers satis-faction increases and customers stay longer. Moreover, loyalty increases be-cause companies can use customers’ knowledge to develop loyalty programs (Crosby, 2002; Swift, 2000; Curry and Kkolou, 2004). Regarding customers’ profitability, it increases due to the increase of up-selling, cross-selling and followup sales (Bull, 2003; Curry and Kkolou, 2004). Companies are able to know which customers are profitable, which are going to be profitable in
the future and which ones will never be profitable by the analysis of cus-tomers’ data (Kotler, 1999; Swift, 2000; Curry and Kkolou, 2004). CRM also promotes the increase of companies’ productivity since it enables the integration of all companies’ departments, such as information technology, finance and human resources (Romano and Fjermestad, 2003; Crosby, 2002; Kracklauer et al., 2001).
2.3.2 CRM components
According to Dych (2001), the CRM technologies can be divided in three components: operational, collaborative and analytical.
Operational CRM referees to the component that helps improving the ef-ficiency of day-to-day customers operations (Peppers and Rogers, 2011). Therefore, this is concerned with the automation of processes involving com-munication and interaction with customers and integrates front, back and mobile offices. This CRM component is the initial producer of data and in-cludes typical corporate functions of sales automation, enterprise marketing automation, order management and customer service or support (Crosby and Johnson, 2001; Greenberg, 2004). In order to ensure success of opera-tional CRM, companies should focus on the requirements of customers and employees should have the right skills to satisfy customers. The output from operational CRM solutions typically are summary level only, showing what activities occurred, but failing to explain their causes or impact (Reynolds, 2002).
Collaborative CRM can be seen as a communication centre that provides the connection between companies and their customers, suppliers, and busi-ness partners. Indeed, it allows customers, staff, sales people and partners to access, distribute and share data. Personalized publishing, e-mail, com-munities, conferences and web-enabled relationship interaction centres are
examples of collaborative services. These services make teamwork easier and more productive, enabling companies to improve processes and consequently improve customers’ satisfaction (Greenberg, 2001). Collaborative CRM is used to establish the lifetime value of customers beyond the transaction by creating a partnering relationship.
In the past, companies focused on operational and collaborative tools, but this tendency seems to be changing (Reynolds, 2002). Decision-makers have realized that analytical tools are necessary to drive strategy and tactical deci-sions, related to customer identification, attraction, development and reten-tion. Analytical CRM is mainly focused on analyzing the data collected and stored, in order to create more meaningful and profitable interactions with customers. To achieve this purpose the data is processed, interpreted and reported using several tools (Greenberg, 2004). The data analyzed is part of a large reservoir of information, i.e. a data warehouse, which contains data from both external and internal sources, obtained using operational tools. The data gains value when the knowledge extracted becomes action-able. According to Reynolds (2002), the most critical CRM component is the analysis. Analytical CRM solutions allow to manage effectively the re-lationship with customers. Only by analyzing customers data, companies can understand behaviors, identify buying patterns and trends and discover causal relationships. The insights obtained from the data help to model and predict future customer satisfaction and behavior more accurately, and may constitute a quantified foundation for strategic decision making.
According to Reynolds (2002), each CRM component is dependent on the others. For instance, analytics drives the decision making in operational CRM, e.g. sales arrangement, marketing actions and customer service pro-cesses. On the other hand, without the data collected via operational CRM processes, analytical CRM would not be possible. Moreover, the data pro-cessed by analytical CRM tools could not be used effectively and strategic
decision-making would not occur without collaborative CRM. Summing up, operational CRM, collaborative CRM and analytical CRM work together to create business value.
2.4
Analytical CRM
The doctoral work described in this thesis is mainly concerned about ana-lytical CRM since it aims to explore the use of data mining techniques to improve the relationship between companies and their customers. Therefore, this section explores in more detail analytical CRM, namely its dimensions and applications.
2.4.1 Dimensions
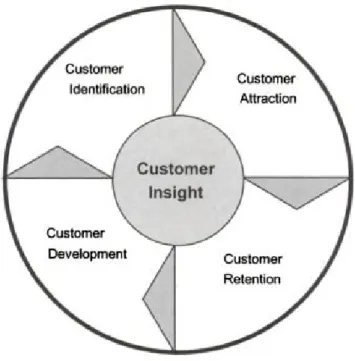
Following Swift (2000); Parvatiyar and Sheth (2002); Kracklauer et al. (2004), Ngai et al. (2009) categorizes analytical CRM on four dimensions: (1) cus-tomer identification, (2) cuscus-tomer attraction, (3) cuscus-tomer development and (4) customer retention. These four dimensions can be seen as a closed cycle of the customers management system (Au et al., 2003; Kracklauer et al., 2004; Ling and Yen, 2001). The diagram of Figure 2.1 shows the sequence of relevant components of CRM.
These four CRM dimensions can be described as follows:
1. Customer identification: CRM begins with this dimension, also called customer acquisition (Kracklauer et al., 2004). Customer identification includes mainly customer segmentation and target customer analysis. Customer segmentation implies the subdivision of the set of all cus-tomers into smaller segments including cuscus-tomers with similar char-acteristics (Woo et al., 2005). Target customer analysis involves the definition of the most attractive segments for the company, based on
Figure 2.1: Analytical CRM stages. (Kracklauer et al., 2004)
customers characteristics. The selection of the target groups requires the collection of quantitative and qualitative data on these groups.
2. Customer attraction: This stage follows customers identification. Hav-ing identified the target groups, companies concentrate efforts and al-locate resources to attract these segments. Competitive advantages, such as price and other differentiation characteristics, can be drivers of customers’ attraction. Another customer attraction driver is direct marketing. This is an element of company’s marketing mix that mo-tivates customers to place an order immediately (Cheung et al., 2003; Liao and Chen, 2004; He et al., 2005; Prinzie and Vandenpoel, 2005). For instance, direct mail or coupon distribution are typical examples of direct marketing. Customer attraction involves the use of an ap-propriate method of communication and the elimination of any sort of wasted effort (Kracklauer et al., 2004).
3. Customer development: The main focus of this dimension is to increase transaction intensity, transaction value, and individual customer prof-itability. The main elements of customer development are customer lifetime value analysis and up/cross selling. Customer lifetime value is the total net income that a company can expect from a customer (Drew et al., 2001; Rosset et al., 2003). Up/Cross selling are the promotional activities that aim to increase the number of associated or closely related services or products that a customer uses within a company (Prinzie and Van den Poel, 2006). The design of such promo-tional activities is usually supported by market basket analysis, which allows to identify the patterns underlying customer behavior (Aggar-wal et al., 2002; Giraud-Carrier and Povel, 2003; Kubat et al., 2003).
4. Customer retention: This dimension is one of the main concerns of CRM. According to Kracklauer et al. (2004), customer satisfaction is the main issue regarding customers retention. Customer satisfaction can be defined as the comparison of customers expectations (resulting from personal standard, image of the company, knowledge of alter-natives, etc) with the perceptions (resulting from actual experience, subjective impression of product performance, appropriateness of the product or service, etc). The customer’s perception of the value offered by the company leads to sustained customer retention. Moreover, a high quality shopping experience leads to a positive emotional feeling, which enables the company to achieve the desired customer loyalty. El-ements of this CRM dimension include one-to-one marketing, loyalty and bonus programs, and complaints management. One-to-one mar-keting involves personalized marmar-keting campaigns supported by ana-lyzing, detecting and predicting changes in customer behavior (Chen et al., 2005a; Jiang and Tuzhilin, 2006). Loyalty and bonus programs involve campaigns or supporting activities which aim at maintaining a
long term relationship with customers. Examples of loyalty programs include credit scoring, service quality or satisfaction and churn analy-sis, i.e. analysis whether a customer is likely to leave for a competitor (Ngai et al., 2009).
Figure 2.2, shows the dimensions of customer relationship management and the tactical tools for achieving the respective core tasks. Some tools, such as benchmarking and one-to-one marketing, are common to several dimensions.
Figure 2.2: CRM instruments. (Kracklauer et al., 2004)
2.4.2 Applications
Despite its apparent contribution for companies’ sustainability and growth, analytical CRM has not been systematically applied. In fact, research on analytical CRM is quite limited (Anderson et al., 2007).
Regarding the customer identification dimension, Han et al. (2012) seg-mented customers of a telecom operator in China, by considering customer value as a derivation from historic value, current value, long-term value,
loyalty and credit. Kim et al. (2006) proposed a framework for analyzing customer value and segmenting customers based on their value. This paper used a wireless telecommunication company as case study. Bae et al. (2003) proposed a web adverts selector for e-newspaper providers, which person-alizes advertising messages. For this purpose, customers were splitted into different segments, on the basis of their preferences and interests. Woo et al. (2005) suggested a customer targeting method, based on a customer visualization map, which depicts value distribution across customer needs and customer characteristics. This customers’ map was applied to a Korean credit card company. Chen et al. (2003) built a model for a tour company that predicts in which tours a new customer will be interested. This model uses information concerning customers profiles and information about the tours they joined before.
Concerning customer attraction, Baesens et al. (2002) approached purchase incidence modeling for a major European direct mail company. It evaluated whether a customer would repurchase or not, considering different customer profiling predictors. Buckinx et al. (2004) proposed a model that makes pre-dictions concerning the redemption of coupons distributed by a fast-moving consumer goods retailer. This model considers historical customer behavior and customer demographics. Ahn et al. (2006) introduced an optimized al-gorithm which classifies customers into either purchasing or non-purchasing groups. To validate the algorithm proposed, this study used data from an online diet portal site in Korea. This site contains all kind of services for online diets, such as information providing, community services and a shop-ping mall. The algorithm was also tested by using data from another online shop. Kim and Street (2004) suggested a model that enables to identify op-timal campaign targets, based on each individual’s likelihood of responding to campaign messages positively. The model was tested in a recreational vehicle insurance context, by using data from many European households.
Chiu (2002) proposed a model to identify the customers who are most likely to buy life insurance products. This purchasing behavior model was devel-oped using real cases provided by one worldwide insurance direct marketing company.
Regarding customer development, Baesens et al. (2004) focused on predict-ing whether a newly acquired customer would increase or decrease his/her future spending, by considering initial purchase information. This research was conducted on scanner data of a large Belgian do-it-yourself (DIY) retail chain. Rosset et al. (2003) used analytical models for estimating the effect of various marketing activities on customers lifetime value. This study was developed in the telecommunications industry context. Brijs et al. (2004) tackled the problem of product assortment analysis, and introduced a mi-croeconomic integer-programming model for product selection, considering the sets of products which are usually purchased together. The empirical study was based on data from a fully-automated convenience store. Chen et al. (2005b) introduced a method to discover customer purchasing pat-terns from stores’ transactional databases, by identifying products which were usually purchased together. Prinzie and Van den Poel (2006) analyzed purchase sequences to identify cross-buying patterns what might be used to discover cross-selling opportunities in the financial services context.
Customer retention has deserved particular attention in CRM literature. Larivire and Van den Poel (2005) analyzed the impact of a broad set of explanatory variables on churn probability. This set of variables included past customer behavior, observed customer heterogeneity and some typical variables related to intermediaries on three measures of customer outcome: next buy, partial-defection and customers’ profitability evolution. This anal-ysis used a large European financial services company as case study. Hung et al. (2006) estimated churn prediction in mobile telecommunication by using customer demographics, billing information, contract/service status,
call detail records, and service change log. Chen et al. (2005a) integrated customer behavioral variables, demographic variables, and a transactional database to establish a method for identifying changes in customer behav-ior. The approach was developed using data from a retail store. Ha et al. (2006) proposed a content recommender system which suggests web con-tent, in this case news articles. It considers users preferences observed when he/she is vising an internet news site. The study developed by Cho et al. (2005) proposed a new methodology for product recommendation that uses customer purchase sequences. The methodology proposed was applied to a large department store in Korea. Chang et al. (2006) used customers’ online navigation patterns to assist user’s search of items of interest. This study conducted an empirical analysis designed for the case of an electronic commerce store selling digital cameras.
2.5
Summary and conclusions
This chapter reviewed the evolution of the marketing concept. The history of marketing can be divided into 4 distinct periods: the production, the sales, the marketing, and the relationship periods. Relationship marketing represents the current state of marketing. Customer relationship manage-ment is part of relationship marketing. CRM is about establishing, cultivat-ing, maintaining and optimizing long term mutually valuable relationships. The benefits underlying companies’ adoption of CRM strategies are: lower cost of acquiring customers, higher customer profitability, increased cus-tomer retention and loyalty, reduced cost of sales, integration of the whole organization, improved customer service and easy evaluation of customers profitability.
CRM integrates mainly three components: operational, collaborative and analytical. Operational CRM concerns the automation of processes in order
to facilitate customers service; collaborative CRM focuses on the interaction with customers and analytical CRM concerns the analysis of customer data, for a broad range of business purposes. Focusing on analytical CRM, this in-cludes four main dimensions: customer identification, customer attraction, customer development and customer retention. From the analysis of the literature it is fair to conclude that the study of each of these dimensions in the retail sector is still incipient, enabling room for improvement. There-fore, this thesis aims to address analytical CRM dimensions by proposing innovator models, supported by data mining techniques, to reinforce the relationship between companies and customers.
Introduction to data
mining techniques
3.1
Introduction
Knowledge discovery in databases (KDD) is a CRM analytical tool which has received considerable attention in recent years (Frawley et al., 1992). This chapter provides a summary of the knowledge discovery process. Moreover, since this research required the use of several data mining techniques, this chapter also includes a summary of the main data mining techniques used to assist analytical CRM.
This chapter is organized as follows. Section 3.2 introduces the process of KDD. Section 3.3 defines data mining and introduces its main techniques. It also shows the relationship between data mining and analytical customer relationship management. The following sections describe the data mining techniques mainly used to support analytical customer relationship manage-ment (i.e. clustering - Section 3.4, classification - Section 3.5 and association - Section 3.6). Section 3.7 summarizes and concludes.
3.2
Knowledge discovery
The advance in IT over the last decades and the penetration of IT into orga-nizations enabled the storage and analysis of a large volume of data, creating a good opportunity to obtain knowledge. However, the transformation of data into useful knowledge is a slow and difficult process.
The first applications of techniques to extract knowledge from databases faced many difficulties, mainly due to the fact that existing algorithms had been designed in laboratory, where, in general, the quality of the data was guaranteed and the amount of data was very limited (Fogel and Fogel, 1995). Therefore, it became evident the need of following a systematic process focused on data preparation. This would allow increasing the confidence in the results obtained. The systematic approach combining a data pre-processing stage and a post-pre-processing stage is called knowledge discovery in databases (KDD) and it was first discussed at the first KDD workshop in 1989.
KDD is a complex process concerning the discovery of relationships and other patterns in the data. It includes a well-defined set of stages, ranging from data preparation to the extraction of information from the data. KDD uses tools from different fields, such as statistics, artificial intelligence, data visualization and patterns recognition. The techniques developed in these areas of study are used in KDD to extract knowledge from the databases.
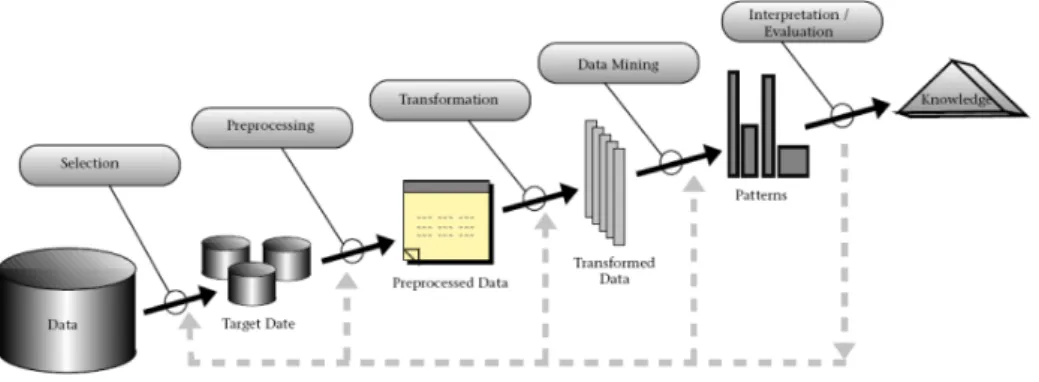
The KDD process is outlined in Figure 3.1. This process includes several stages, consisting of data selection, data treatment, data pre-processing, data mining and interpretation of the results. This process is interactive, since there are many decisions that must be taken by the decision-maker during the process. Moreover, this is an iterative process, since it allows to go back to a previous stage and then proceed with the knowledge discovery
Figure 3.1: Overview of the stages constituting the KDD process. (Fayyad et al., 1996b)
process. The stages of KDD process are briefly described below.
• Data selection: This stage includes the study of the application
do-main, and the selection of the data. The domain’s study intends to contextualize the project in the company’s operations, by understand-ing the business language and definunderstand-ing the goals of the project. The data selection aims to focus the analysis on a subset of variables or data samples, on which discovery is to be performed. In this stage, it is necessary to evaluate the minimum subset of data to be selected, the relevant attributes and the appropriate period of time to consider.
• Data preprocessing: This stage includes basic operations, such as:
re-moving noise or outliers, collecting the necessary information to model or account for noise, deciding on strategies for handling missing data attributes, and accounting for time sequence information and known changes. This stage also includes issues regarding the database man-agement system, such as data types, schema, and mapping of missing and unknown values.
order to convert the data in the appropriate formats for applying data mining algorithms. The most common transformations are: data nor-malization, data aggregation and data discretization. Some algorithms require data normalization to be effectively implemented. To normal-ize the data, each value is subtracted the mean and divided by the standard deviation. Usually, data mining algorithms work on a single data table and consequently it is necessary to aggregate the data from different tables. Some algorithms only deal with quantitative or qual-itative data. Therefore, it may be necessary to discretize the data, i.e. map qualitative data to quantitative data, or map quantitative data to qualitative data.
• Data mining: This stage consists of discovering patterns in a dataset
previously prepared. Several algorithms are evaluated in order to iden-tify the most appropriate for a specific task. The selected one is then applied to the relevant data, in order to find implicit relationships or other interesting patterns.
• Interpretation/Evaluation: This stage consists of interpreting the
dis-covered patterns and evaluating their utility and importance with re-spect to the application domain. In this stage it can be concluded that some relevant attributes were ignored in the analysis, thus suggesting the need to replicate the process with an updated set of attributes.
According to Cabena et al. (1997), the time spent in the KDD process is not equally distributed among all stages, as shown in Figure 3.2. Despite requir-ing know-how about the algorithms used in the analysis, the data minrequir-ing stage is the least time-consuming stage of the KDD process. In opposition, data preparation is usually the most time-consuming and challenging phase (Famili et al., 1997). The estimated effort of data preparation in KDD projects is about 50% of the overall process (Cabena et al., 1997).
Figure 3.2: Typical effort needed for each stage of the KDD process (Cabena et al., 1997).
3.3
Data mining and analytical CRM
Berry and Linoff (2000) defines data mining as the process of exploring and analyzing huge datasets, in order to find patterns and rules which can be important to solve a problem. Berson et al. (1999); Lejeune (2001); Berry and Linoff (2004) define data mining as the process of extracting or detecting hidden patterns or information from large databases. Data mining is motivated by the need for techniques to support the decision maker in analyzing, understanding and visualizing the huge amounts of data that have been gathered from business and are stored in data warehouses or other information repositories. Data mining is an interdisciplinary domain that gets together artificial intelligence, database management, machine learning, data visualization, mathematic algorithms, and statistics.
Data mining is considered by some authors as the core stage of the KDD process and consequently it has received by far the most attention in the literature (Fayyad et al., 1996a). Data mining applications have emerged from a variety of fields including marketing, banking, finance, manufacturing and health care (Brachman et al., 1996). Moreover, data mining has also been applied to other fields, such as spatial, telecommunications, web and multimedia. According to the field and type of data available, the most appropriate data mining technique can be different.
A wide variety of data mining techniques are described in the literature. Thus, an overview of these techniques can often consist of long lists of seem-ingly unrelated and highly specific techniques. Despite this, most data min-ing techniques can be seen as compositions of a few basic techniques and principles. Several can be applied for the execution of a specific task. The performance of each one depends upon the task to be carried out and the quality of the data available. According to Ngai et al. (2009), association, classification, clustering, forecasting, regression, sequence discovery and vi-sualization cover the main data mining techniques. These groups of data mining techniques can be summarized as follows:
• Association intends to determine relationships between attributes in
databases (Mitra et al., 2002; Ahmed, 2004; Jiao et al., 2006). The fo-cus is on deriving multi-attribute correlations, satisfying support and confidence thresholds. Examples of association model outputs are as-sociation rules. For example, these rules can be used to describe which items are commonly purchased with other items in grocery stores.
• Classification aims to map a data item into one of several predefined
categorical classes (Berson et al., 1999; Mitra et al., 2002; Chen et al., 2003; Ahmed, 2004). For example, a classification model can be used to identify loan applicants as low, medium, or high credit risks.
• Clustering, similarly to classification models, aims to map a data item
into one of several categorical classes (or clusters). Unlike classification in which the classes are predefined, in clustering the classes are deter-mined from the data. Clusters are defined by finding natural groups of data items, based on similarity metrics or probability density models (Berry and Linoff, 2004; Mitra et al., 2002; Giraud-Carrier and Povel, 2003; Ahmed, 2004). For example, a clustering model can be used to group customers who usually buy the same group of products.
• Forecasting estimates the future value of a certain attribute, based
on records’ patterns. It deals with outcomes measured as continuous variables (Ahmed, 2004; Berry and Linoff, 2004). The central elements of forecasting analytics are the predictors, i.e. the attributes measured for each item in order to predict future behavior. Demand forecast is a typical example of a forecasting model whose predictors could be for example price and advertisement.
• Regression maps a data item to a real-value prediction variable (Mitra
et al., 2002; Giraud-Carrier and Povel, 2003). Curve fitting, mod-eling of causal relationships, prediction (including forecasting) and testing scientific hypotheses about relationships between variables are frequent applications of regression.
• Sequence discovery intends to identify relationships among items over
time (Berson et al., 1999; Mitra et al., 2002; Giraud-Carrier and Povel, 2003). It can essentially be thought of as association discovery over a temporal database. For example, sequence analysis can be developed to determine, if customers had enrolled for plan A, then what is the next plan that customer is likely to take-up and in what time-frame.
• Visualization is used to present the data such that users can notice
data mining models to provide a clearer understanding of the dis-covered patterns or relationships (Turban et al., 2010). Examples of visualization applications include the mindmaps.
Data mining techniques can also be categorized in supervised learning and unsupervised learning. Supervised learning requires that the dataset con-tains predefined targets that represent the classes of data items or the be-haviors that are going to be predicted. For example, a supervised model can be trained to identify patterns which enable to classify bank clients as poten-tial loan defaulters or non-defaulters. Unsupervised learning techniques do not require the dataset to contain the target variables (e.g. classes of data items) (Bose and Chen, 2009). An unsupervised model can be trained to group customers into similar unknown groups. Most data mining techniques are supervised. The most common unsupervised techniques are those used for clustering.
The use of data mining techniques to extract meaningful information from data is very promising. In fact, many companies have collected and stored data resulting from the interactions with customers, suppliers and business partners. However, according to Berson et al. (1999), the inability to find valuable information in the data has prevented companies from converting these data into valuable and useful knowledge. Particularly within the ana-lytical CRM dimension, data mining techniques are becoming popular ways of analyzing customer data. In fact, the employment of data mining to support CRM analytical dimension is seen as an emerging tendency (Ngai et al., 2009). Data mining techniques can be used to support competitive marketing strategies by analyzing and understanding customer behaviors and characteristics, so as to acquire and maintain customers and maximize customer value. The selection of appropriate data mining techniques which can extract useful knowledge from large customer databases is of utmost
importance. According to Berson et al. (1999), when carefully selected, the data mining techniques are one of the best supporting tools of CRM decisions.
Ngai et al. (2009) proposes a graphical classification framework which depicts the relationship between data mining techniques and analytical CRM, as shown in Figure 3.3. This framework results from a literature revision on data mining techniques in CRM and it is mainly based on the research conducted by Swift (2000), Parvatiyar and Sheth (2002) and Kracklauer et al. (2004).
Figure 3.3: Classification framework on data mining techniques in CRM. (Ngai et al., 2009)
According to the literature review developed by Ngai et al. (2009), for cus-tomer identification purposes, classification and clustering techniques are
the most often used. If the objective is to attract customers, classification techniques are the most frequently used, while if the objective is to re-tain customers, association and classification are the most frequently used. Concerning customers’ development, association techniques are the most frequent. Despite this, it is known that a combination of data mining tech-niques is often required to support each CRM analytical dimension (Ngai et al., 2009).
Since the research reported in this thesis focuses on customers identification, attraction, development and retention, this involved a study of clustering, classification and association data mining techniques. This study aimed at exploring the techniques and getting insight into the advantages and disadvantages of each one, in order to develop models that could meet the objectives of the company. The next sections explore more deeply clustering, classification and association data mining techniques.
3.4
Clustering
Clustering techniques are very useful to gain knowledge from a dataset. Clustering analyzes data items without considering a known class label. In general, the class labels are not present in the training data, since they are not known. Therefore, clustering can be used to generate such labels. The items are clustered according to the principle of intraclass similarity maxi-mization and the interclass similarity minimaxi-mization. It means that clusters are formed so that items within a cluster have high similarity, but are very dissimilar to items in other clusters. Each cluster that is formed can be seen as a class of items, from which rules can be derived. Figure 3.4 illustrates an example of clustered items.
In most clustering algorithms, the number of clusters is set as a user param-eter (Thilagamani and Shanthi, 2010). In order to support the choice of the
Figure 3.4: Illustrative example of a clustering result. (Berry and Linoff, 2004)
number of clusters, there are different metrics that aim to evaluate the qual-ity of the clustering result (see Tibshirani et al., 2001, for a revision). For example, the davies-bouldin index, developed by Davies and Bouldin (1979) is a function of the ratio of the sum of within-cluster (i.e. intra-cluster) scatter to between cluster (i.e. inter-cluster) scatter. A good value for the number of clusters is associated to lower values of this index. The elbow cri-terion, proposed by Aldenderfer and Blashfield (1984), is based on a typical plot of an error measure (the within cluster dispersion defined typically as the sum of squares of the distances between all items and the centroid of the correspondent cluster divided by the number of clusters) versus the num-ber of clusters (k ). As the numnum-ber of clusters increases the error measure decreases monotonically and from some k onwards the decrease flattens sig-nificantly. Such “elbow” is commonly assumed to indicate the appropriate number of clusters.
The most popular clustering techniques can be classified into the follow-ing categories: partitionfollow-ing methods, model-based methods and hierarchi-cal methods (Yau and Holmes, 2011). These methods are described below.
Variable clustering is also explored below. Although the usual aim of the framework of clustering is to cluster items, variable clustering is also rele-vant.
3.4.1 Partitioning methods
Partitioning methods (or non-hierarchical methods) create clusters by opti-mizing an objective partitioning criterion, such as the distance dissimilarity function. Given a database of n items, a partitioning method constructs k partitions of the data, where each partition represents a cluster and k≤ n. Each group must contain at least one item and each item must belong to exactly one group. Please note that this second requirement can be relaxed in some fuzzy partitioning techniques (see Kaufman and Rousseeuw, 1990, for further details).
The most popular and commonly used partitioning methods are k -means and k -medoids (Witten et al., 2001; Huang et al., 2007).
k -means
The k -means algorithm, introduced by Forgy (1965) and later developed by MacQueen (1967), assigns a set of n items to k clusters. The number of clus-ters is pre-defined by the analyst. According to the partitioning algorithms definition, k -means aims at achieving a high intracluster similarity and a low intercluster similarity. Therefore, each item is assigned to the closest cluster, based on the minimum distance between the item and the cluster mean. This algorithm requires the definition of the initial seeds (initial items defined as the clusters mean) in the first iteration of the algorithm. After classifying a new item, it is calculated a new mean for the corresponding cluster and the process continues. This algorithm involves several iterations which differ concerning the initial seeds. The process is finished when the
partitioning criterion function, usually the square-error, converges to a value close to the minimum. Considering p as the as the point in the space repre-senting a given data item and mi the mean of cluster Ciwhere p is included,
the partitioning criterion is usually the sum of the square error for all items in the dataset, defined as shown in expression (3.1).
E = k ∑ i=1 ∑ p∈Ci |p − mi|2 (3.1)
The advantages of the use of k -means that have been more frequently stressed are the simplicity of the concept, the ease of implementation and the high relative speed of the computational process, which makes it suitable for large datasets (Huang, 1998; Fred and Jain, 2002).
k -means has the disadvantages of requiring the prior specification of the
number of groups (common to all partitioning techniques), and depending heavily on the initial seeds. Selecting different initial seeds may generate differences in clustering results, especially when the target dataset contains many outliers. This algorithm does not have any mechanism for choosing appropriate initial seeds. Moreover, the cluster mean may not be the most representative point of the cluster, and for non-convex clusters this cluster-ing technique will give bad results due to the tendency to find equal-sized clusters (Looney, 2002; Tan et al., 2006).
k -medoids
the k -medoids algorithm was introduced by Kaufman and Rousseeuw (1990) and it is very similar to k -means algorithm. However, instead of taking the mean value of the items in a cluster as the reference point, this algorithm considers the medoid as the most representative item. The method used to choose the medoid may vary, but the most standard procedure is to pick