“PACTAR EL FUTURO.
Debate para un nuevo consenso en torno al bienestar
”.
Sevilla, 16 y 17 de Febrero de 2016
Minimum Social Standards in Portugal: changes and
adequacy from the pre to the post austerity period
Elvira Pereira
CAPP, ISCSP, Universidade de Lisboa; [email protected] Francisco Branco
CEDH, FCH, Universidade Católica Portuguesa; [email protected] Maria Inês Amaro
ISCTE, Instituto Universitário de Lisboa; [email protected] José Pereirinha
GHES, ISEG-Universidade de Lisboa; [email protected]
Trabajo presentado al Grupo de Trabajo 7.2 ‘The Great Recession and the small safety net: an opportunity for minimum income guarantee against poverty in Southern Europe?’
2 Abstract
Several international and European commitments recognize the right for all to have an adequate level of resources to lead a decent and dignified life and the need for an adequate income support for those who lack sufficient resources (i.e. for those living in poverty). In the last eleven years some important changes were introduced in Portugal affecting this right. Some, like the introduction of the Solidarity Supplement for the Elderly, were positive moves towards the realization of this right, others, like some of the changes introduced in the non-contributory protection system during the period of social and economic crisis in Portugal, had a clear negative impact on the level of income guaranteed by the state for different households types.
Using six vignettes for different household types this paper aims: a) to identify the impact on the minimum income guaranteed by the state (for the considered households types) of the main changes introduced after 2006 in minimum wage and in the non-contributory protection system, namely in Social Insertion Income and in Solidarity Supplement for the Elderly, b) to compare the minimum income guaranteed for the considered household types since 2006 and c) to assess the adequacy of the minimum income guaranteed, between 2016 and 2015,considering the relative at risk of poverty line.
Key words: Minimum Income standards; Minimum Wage; Social Insertion Income; Solidarity Supplement for the Elderly; Portugal
3 1. Introduction
Several international and European commitments recognize the right for all to have an adequate level of resources to lead a decent and dignified life and the need for an adequate income support for those who lack sufficient resources (i.e. for those living in poverty). This is of great relevance for Portugal for two kinds of reasons. One the one hand, Portuguese welfare system is a fragile one, where coexists a modern institutional arrangement of social rights with a weak economic support of such rights (low primary incomes), low redistributive efficiency of social transfers and high risks of financial unsustainability. On the other hand, after the 2008 global financial crisis with negative social impacts, Portugal embarked in a age of austerity since mid-2010, being committed to reduce the budget deficit and to bring the debt-to-GDP ratio in a downward growth path. This austerity consisted on packages of policy measures of internal social devaluations (substitutes to monetary devaluations) with negative social effects. Low adequacy of minimum incomes became then a matter of greater concern (Pereirinha & Murteira, 2016: 587-588).
In the period analysed in this paper, some important changes were introduced in Portugal affecting the above-mentioned right. Some, like the introduction of the Solidarity Supplement for the Elderly, were positive moves towards the realization of this right, others, like some of the changes introduced in contributory protection system during the period of crisis and austerity in Portugal, had a clear negative impact on the level of income guaranteed by the state for different households types.
We have selected three types of income sources, which are relevant to assess the social effects of policy measures taken in this period: minimum wage (implemented in 1974) and two non-contributory social transfers that aim at guaranteeing a minimum income to different household types: the social insertion income (implemented in 1996) and the solidarity supplement for the elderly (implemented in 2006). They have impact on different types of households, which will be investigated.
Using six vignettes for different household types (a single working age adult employed full time, a couple of working age adults, both employed full time, a single working age adult unemployed, a couple of working age adults both unemployed, a pensioner living alone and a couple of pensioners), this paper aims: a) to identify the impact on the minimum income guaranteed by the state (for these households types) of the main changes introduced after 2006 in minimum wage and in the non-contributory protection system, namely in Social Insertion Income and in Solidarity Supplement for the Elderly, b) to compare since 2006 the minimum level guaranteed for these
4
household types and c) to assess the adequacy of the minimum level guaranteed, between 2006 and 2015, considering the relative at risk of poverty line.
The research was conducted using document and statistics analysis and a simulated application of the considered policy measures to the vignettes selected. The document analysis was used regarding the legal frameworks of the policy measures; secondary statistical data was gathered to discuss the evolution and the take-up of measures, and vignettes were used to gain in-depth knowledge about the implications of changes introduced over time.
The next section presents the context of implementation, the characteristics and the evolution, in the period between 2006 and 2016, of the three policy measures considered above that aim at guaranteeing a minimum income to different household types. In Section 3 the minimum income guaranteed by the state is compared (in the same period) for the different household types considered. Section 4 presents a crude assessment of the adequacy of these minimum standards, using as reference the relative at risk of poverty line. The paper ends with some final remarks highlighting some of the main results.
2. The minimum income guaranteed by the state
This section presents the context of implementation, the characteristics and the evolution, in the period between 2006 and 2016, of the above mentioned policy measures: the national minimum wage (implemented in 1974), the social insertion income (implemented in 1996) and the solidarity supplement for the elderly (implemented in 2006). The analysis of changes in these policy measures between 2006 and 2016 focus mainly those changes that had a direct impact in the minimum income guaranteed by the state for the established reference households.
2.1 A brief historical perspective
Until 1974, in Portugal, there was neither a national minimum wage nor a guaranteed social minimum as a social right. One month after the democratic revolution of April 1974, the Provisional Government, created both the national minimum wage and the social pension, which inaugurated the non-contributory social protection regime (Decree-law n.º 217/74 de 27 de maio). Regarding the role of social protection in terms of ensuring sufficient resources and benefits, until 1974, social protection in Portugal was secured by a system of compulsory social insurance, mainly developed in the 60s, and that, on the eve of the April Revolution, still had a limited warranty coverage for a limited set social risks, which did not include unemployment.
5
Sectors of the working population not covered by compulsory social insurance or groups not included in the labor market, permanently or temporarily, had only as public social protection, the traditional social assistance based in temporary and precarious help, not predictable and discretionary.
With the establishment, in May 1974, of the social pension, based on citizenship status, Portugal opened a new era with the establishment of a non-contributory social protection regime. As Costa and Maia (1985: 86) emphasizes, “the measure marked a qualitative shift from the concept of social protection, once it added to the traditional source of rights - employment relationship and payment of contributions - another: citizenship, coupled with a social need.”
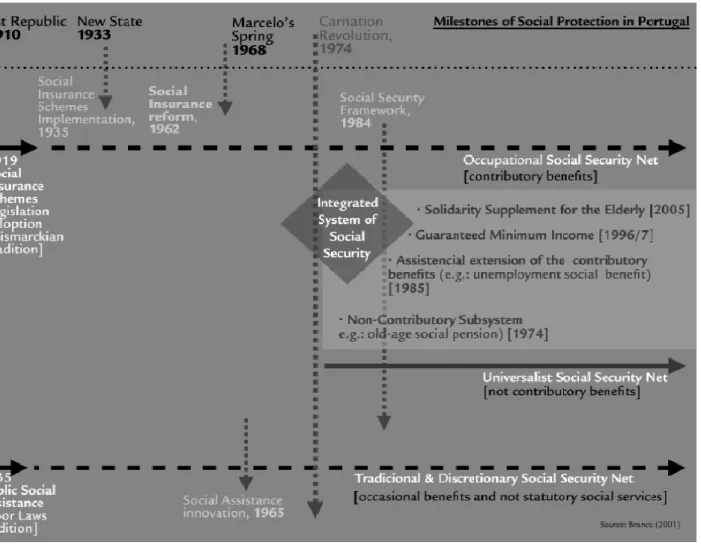
This new social safety net has experienced other developments over time being completed with the creation of the guaranteed minimum income (Rendimento Mínimo Garantido) in 1996, about 20 years later, and the solidarity supplement for the elderly (Complemento Solidário para Idosos) in 2005, 9 years later (see Figure 1).
Figure 1 Milestones of Social Protection in Portuga
6
In fact, the creation of the social pension (1974), the social unemployment assistance (1985), and other developments of minor significance in the protection network based on categorical minimum failed to overcome the rudimentary nature of the Portuguese social assistance regime, characterized by a limited range, low level of guaranteed income provided by social benefits and an organizational structure with a high level of exclusion. This scenario only changed significantly with the establishment (1996) and generalization of the guaranteed minimum income (1997). Only from this time is that it makes sense to talk about the existence in Portugal of a universal system of guaranteed income.
The creation of the Guaranteed Minimum Income extended significantly the network of basic social protection to Portuguese citizens. For this pathway, the non-contributory social protection regime in Portugal departed from the pattern common to the countries of Southern Europe and approached the integrated schemes, considering the general standards and management system benefit, but maintained the low level of benefits characteristic of Southern Europe.
2.2 National minimum wage
A national minimum wage1 for employees (with some exceptions namely rural and domestic workers2) was implemented in may of 1974 (one month after the democratic revolution), by the Provisional Government, with a value of 3.300$ for full time workers (Decree-law n.º 217/74 de 27 de maio). This minimum wage along with the increase of the family allowance, the creation of social pension (non-contributory) and temporary price freezing were considered urgent measures within the general aim of “improving the situation of the worst-off classes” (…), simultaneously opening the way “to satisfy the just and pressing aspirations of the working classes and stimulate the economic activity” (Preamble, Decree-law n.º 217/74 de 27 de maio).
This amount set for the national minimum wage was higher (+20%) than the amount estimated as needed for a worker living alone in Lisbon in a study developed by the Ministry of Corporations and Social Security in 19693. The amount calculated as needed for a worker living alone in Lisbon (in Lisbon there were higher expenditures in both housing and transports than in the rural part of the
1
Since 1977, designated by minimum guaranteed monthly retribution. 2
The minimum wage for rural workers was implemented in 1977 (with an amount that was 78% of the minimum wage set for other workers) and the minimum wage for domestic workers in 1978 (with an amount that was 78% of the minimum wage set for rural workers).
3
It is important to note that the previous regime already foresaw the establishment of a national minimum wage and that two studies were developed, in 1965 and in 1969, by the Ministry of Corporations and Social Security to estimate the adequate amount (Pereirinha & Branco, 2013).
7
country) and not integrated in any social security system (which had implications in terms of health expenditures) was 1.495,6$ in 1969 (Pereirinha & Branco, 2013). Updating it to 1974 using the Consumer Price Index (annual average) the amount needed would be of 2745,36$.
This value was increased to 4.000$ in the following year (Decree-law n.º 292/75 de 16 de junho) and since then the value of the national minimum wage has been periodically increased. But, the fact is that, because of the high inflation felt in the second half of the 70’s and the first half of the 80’s it never recovered its initial values in real terms (Figure 2).
Figure 2 National Minimum Income in euros (real value - base 2011), 1974-2015
Source: PORDATA, 2017
At the present, in Portugal “workers are guaranteed a minimum monthly remuneration, regardless of the modality practiced, the value of which is determined annually by specific legislation, after hearing the Standing Committee on Social Concertation” (n. 1, art. 273º of the Portuguese Labour Code, updated version of august 2016). The determination of the amount of the minimum wage has to take into account, among other factors, “the workers' needs, the increase in the cost of living and the evolution of productivity, in view of their adequacy to the criteria of income and price policy” (n. 2, art. 273º of the Portuguese Labour Code, updated version of august 2016).
8
In 2006, the nominal value of the national minimum wage for employees (including rural and domestic workers) was 385,90€4. According to the Preamble of the law establishing this amount, the minimum wage “benefits the group of workers receiving the lower retributions, aiming at improving their life conditions and ensuring them, under constitutional terms, the right to a decent existence” (Preamble, Decree-law n.º 238/2005 de 30 de dezembro). Until 2007, this value was also the reference value for calculating different and important social benefits. That is why, in establishing the amount, different criteria had to be taken into account: “the improvement in life conditions of the group of workers receiving the lower retributions, the rise in the cost of living, the evolution of productivity and competitiveness of companies and the economy, as well as the sustainability of public finances” (idem, ibidem). In 2007, considering that the value of minimum wage was too low, an agreement was established to periodically increase the value aiming to achieve the value of 450€ in 2009 and of 500€ in 2011 (Preamble, Decree-law nº 2/2007, de 3 de janeiro). The achievement of this goal was interrupted in 2011, justified with the negative effects of the international financial and economic crisis in the national economy and labor market (Preamble, Decree-law n.º 143/2010 de 31 de dezembro), and “resumed” in october 2014.
So, from 2006 to 2010, the amount has increased above the inflation rate which allowed an increase in its real value (Table 1). Between 2011 and 2013, the real value of the minimum wage decreased, because the increase in 2011 was below the inflation rate and because in 2012 and 2013 there was no change in nominal value. The real increase of october 2014 brought the level of minimum wage to near its 2010 real value. And, again, in 2016 there was an increase in the real value of the minimum wage, because the increase of the nominal value was above the inflation rate (Table 1).
4
9
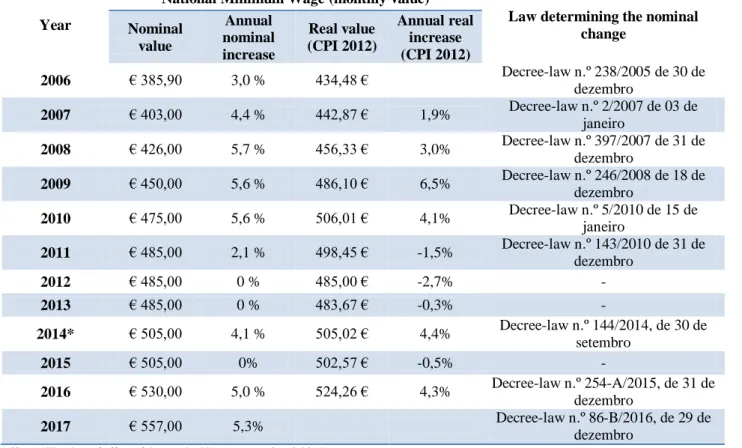
Table 1 Evolution of national minimum wage value since 2006
Year
National Minimum Wage (monthly value)
Law determining the nominal change Nominal value Annual nominal increase Real value (CPI 2012) Annual real increase (CPI 2012) 2006 € 385,90 3,0 % 434,48 € Decree-law n.º 238/2005 de 30 de dezembro 2007 € 403,00 4,4 % 442,87 € 1,9% Decree-law n.º 2/2007 de 03 de janeiro 2008 € 426,00 5,7 % 456,33 € 3,0% Decree-law n.º 397/2007 de 31 de dezembro 2009 € 450,00 5,6 % 486,10 € 6,5% Decree-law n.º 246/2008 de 18 de dezembro 2010 € 475,00 5,6 % 506,01 € 4,1% Decree-law n.º 5/2010 de 15 de janeiro 2011 € 485,00 2,1 % 498,45 € -1,5% Decree-law n.º 143/2010 de 31 de dezembro 2012 € 485,00 0 % 485,00 € -2,7% - 2013 € 485,00 0 % 483,67 € -0,3% - 2014* € 505,00 4,1 % 505,02 € 4,4% Decree-law n.º 144/2014, de 30 de setembro 2015 € 505,00 0% 502,57 € -0,5% - 2016 € 530,00 5,0 % 524,26 € 4,3% Decree-law n.º 254-A/2015, de 31 de dezembro 2017 € 557,00 5,3% Decree-law n.º 86-B/2016, de 29 de dezembro
Note: *The date of effect of the nominal increase was 01.10.2014.
Source: For nominal values, http://www.dgert.msess.pt/evolucao-da-remuneracao-minima-mensal-garantida-rmmg; For real values, own calculations using IPC – base 2012, annual values, available at www.ine.pt
Considering that in Portugal, and since 1975 (Decree-law n.º 292/75, de 16 de Junho), the monthly wage is paid 14 times (12 months, plus Holidays subsidy and Christmas subsidy), to calculate the net monthly income of the reference households we have to multiply the value by 14 and divide it by 12. We also have to take into account the compulsory worker’s social security contributions and potential personal income taxes. In the case of social security contributions, for employees in general, there is a compulsory flat rate of 11% of the gross pay (rate in force since 1986). In the case of personal income taxes, the Portuguese Tax Code on Personal Income establishes a minimum existence value that in practice exempt workers receiving only the minimum wage from taxes (n. 1 art 70, Portuguese Tax Code on Personal Income).5 Table 2 presents the results of the net monthly
5
For individuals whose income originates predominantly from dependent work or pensions, the application of the tax rates shall not result in the availability of a net income less than the annual value of the minimum wage plus 20%, nor result in any tax for the same kind of income whose taxable amount, after the application of the marital ratio, is equal to or less than a determined value – 1775€ in 2006,1812€ in 2007, 1850€ in 2008, 1896€ until 2010, 1911€ until 2016 (n. 1 art. 70º, Portuguese Tax Code on Personal Income).
10
income for the two cases considered of working age adults, employed full time, receiving the national minimum wage (single and couple) from 2006 to 2017.
Table 2 Net monthly income of working age adults, employed full time, receiving the national
minimum wage
Net monthly income Net monthly income
(nominal value) (real value - CPI 2012)
Single Couple Single Couple
Jan-06 400,69 € 801,38 € 451,13 € 902,27 € Jan-07 418,45 € 836,90 € 459,84 € 919,69 € Jan-08 442,33 € 884,66 € 473,82 € 947,64 € Jan-09 467,25 € 934,50 € 504,73 € 1.009,46 € Jan-10 493,21 € 986,42 € 525,41 € 1.050,81 € Jan-11 503,59 € 1.007,18 € 517,56 € 1.035,11 € Jan-12 503,59 € 1.007,18 € 503,59 € 1.007,18 € Jan-13 503,59 € 1.007,18 € 502,22 € 1.004,43 € Jan-14 503,59 € 1.007,18 € 503,61 € 1.007,22 € Jan-15 524,36 € 1.048,72 € 521,84 € 1.043,68 € Jan-16 550,32 € 1.100,63 € 544,36 € 1.088,72 € Jan-17 578,35 € 1.156,70 €
Source: Own calculations
As it can be seen in table 2, the real value of the net monthly income guaranteed to working age adults employed full time increased between 2006 and 2010, achieving a peak in this year. Between 2010 and 2014 the real value decreased (with oscillations) to a level lower than its 2009 real value, and in 2015 and 2016, there was an important recovery and increase of the real value of the net monthly income guaranteed to working age adults, employed full time, above its 2010 level.
2.3 Social insertion income
As referred before, the process of enlargement of the non-contributory scheme in Portugal was only completed when the guaranteed minimum income was adopted. The guaranteed minimum income, created in 1996, instituted for the first time in Portugal a safety net universalizing a guaranteed minimum income level, expanding the coverage of the prior minimum social categorical to all Portuguese citizens aged over 18 years, the young who have not attained the age of majority but with family responsibilities and migrants with residence authorization.
In early 2002 a new political cycle began in Portugal with impact on social protection policy. The new government replaced the Guaranteed Minimum Income (GMI) by the Social Insertion Income (SII). Through these changes, the Government intended to emphasise the transitory character of the
11
Minimum Income Scheme establishing new entitlement rules, affecting specially the young citizens, and the eligibility criteria, introducing more restrictive conditions for access to and maintenance of this social right, reinforcing the means-test conditions, the activation requirements (cf. table 3), and the proposal “to introduce a greater rigor in the attribution, processing and management of the measure itself” (Decree-law 283/2003, 8 Novembro).
Table 3 Comparison of the entitlement rules and eligibility criteria between GMI and SII
Guaranteed Minimum Income
Lei 19-A/96, 29 junho
Revoking of Guaranteed Minimum Income and creation of Social Insertion Income
Decreto nº 18/IX da AR, 26 setembro 2002
Social Insertion Income
Lei nº 13/2003, 21 de maio (republished 29 maio) * and Decree-law n.o 283/2003 de 8 de Novembro
Entitlement - Individuals with 18 years old or higher or younger if they have minors in the exclusive economic dependence
- Individuals with 25 years old or higher or younger if they have minors in the exclusive economic dependence of their household or are pregnant, be married or cohabiting for more than one year
- Individuals with 18 years old or higher or younger if they have minors in the exclusive economic dependence of their household or are pregnant
Eligibility (main criteria)
- Legal residence in Portugal - The absence of own income or of the household members,
higher than those defined in the law
- Express commitment to subscribe and to continue the planned integration program, in particular by means of an active availability for work or professional training. - Provision of all legal means requested by the means-test
- identical to GMI
- Allow the competent social security authority access to all relevant information to carry out the referred assessment.
- Idem Decreto nº 18/IX da AR, 26 setembro 2002
- Additional conditions for individuals between 18 and 30 years old (e.g. registration as a job seeker in the centre of
employment, active availability to employment, for socially necessary work or vocational training)
Allowance amount
- The amount is indexed to the social pension according to the composition of the family household:
- For each adult, up to two adults, 100% of the amount of the Social Pension;
- For each adult, from the third, 70%;
- For each minor, up to two, 50%;
- Idem GMI and:
- For each minor, from the third, 60%.
- The amount is increased whenever the beneficiary is pregnant or is married/cohabiting with a pregnant woman (30% during that period and 50% during the first year of the child's life) - When there are in the family people with severe mental or physical disabilities; people with chronicle diseases; older people in a situation of great dependency; - To compensate housing expenses.
Note: * After veto for unconstitutionality of the president of the Republic (9 January 2003), the Judgement of the Constitutional Cou rt no. 509/2002
of 12 February, and the political veto of the president of the Republic (28 March 2003).
Source: own elaboration
The more restrictive aspects of some of these changes, in the point of view of citizenship rights, were revoked by unconstitutionality, following the veto of the President of the Republic. In the
12
positive side, the Social Insertion Scheme introduced a logic of positive discrimination increasing the allowance amount for situations of special vulnerability.
At the present, the SII scheme is addressed at individuals and families who are in a severe situation of economic deprivation. The deprivation threshold is currently established as an individual income below 43,634% of the amount of the indexing reference of social support - 183,84€ per month, in 2017 - or household income below a threshold based on that value calculated adopting different weights for adults and children (at the present, it is used the OCDE equivalence scale).
Other eligibility conditions are: — legal residence in Portugal;
— age of 18 years old or older or aged less than 18 in case he/she has dependent minor children or in case of pregnant women;
— subscription and following a social insertion programme namely by an active availability to work or to undertake actions of occupational training or integration;
— enrollment in a local employment centre, in case of unemployment and as long as the person has got the conditions to be working (exception to people with a permanent incapacity for work or long-term illness, those below 16 years old or above 65 and persons who are providing an indispensable support to members of their family household);
— To provide information proving their economic deprivation situation.
— The value of the movable assets of the applicant and his / her household does not exceed 60 times the value of the index of social support (IAS);
— The value of movable property subject to registration, namely motor vehicles, vessels and aircraft, does not exceed 60 times the value of the IAS.
The allowance, which covers the difference between individual or household income and the reference value referred before, is granted for a period of one year which may be renewed annually under requirement, if the eligibility conditions remain, and the claimant should declare, any time, change of the household, of residence and of resources.
For household income determination purposes, are considered: a) income from dependent work; b) business and professional income; c) income from capital; d) property income; e) pensions; f) social benefits; g) support for housing with character of regularity; h) other income.
13
Between 2006 and the present, this measure was subject to many changes. In this paper, only those with direct impact on the minimum value guaranteed by the state for different household types are analyzed - namely changes in the threshold and changes in the equivalence scales6.
It is important to note that until 2012, the value of the SII threshold was indexed to the social pension (which was since 2007 indexed to the value of the indexing reference of social support). Only in 2012, this value was delinked from the social pension and directly linked to the indexing reference of social support (Decree-law nº 133/2012 de 27 de junho).
Thus, between 2006 and 2010, the nominal value of the threshold was increased (in line with the increases in the social pension), which allowed a rise in its real value between 2006 and 2009, because the increases were above the inflation rate (Table 4).
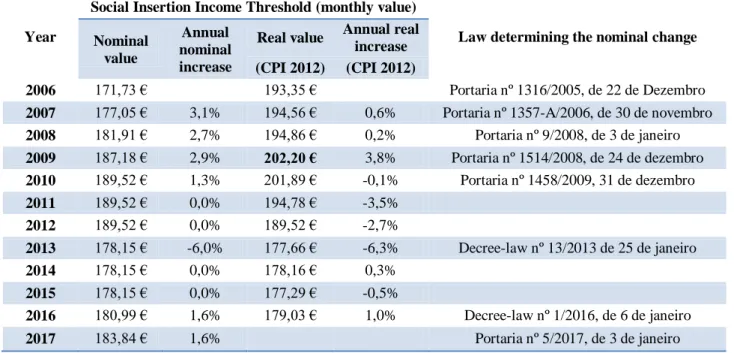
Table 4 Evolution of social insertion income threshold since 2006
Year
Social Insertion Income Threshold (monthly value)
Law determining the nominal change Nominal
value
Annual nominal increase
Real value Annual real increase (CPI 2012) (CPI 2012)
2006 171,73 € 193,35 € Portaria nº 1316/2005, de 22 de Dezembro
2007 177,05 € 3,1% 194,56 € 0,6% Portaria nº 1357-A/2006, de 30 de novembro
2008 181,91 € 2,7% 194,86 € 0,2% Portaria nº 9/2008, de 3 de janeiro 2009 187,18 € 2,9% 202,20 € 3,8% Portaria nº 1514/2008, de 24 de dezembro 2010 189,52 € 1,3% 201,89 € -0,1% Portaria nº 1458/2009, 31 de dezembro 2011 189,52 € 0,0% 194,78 € -3,5% 2012 189,52 € 0,0% 189,52 € -2,7% 2013 178,15 € -6,0% 177,66 € -6,3% Decree-law nº 13/2013 de 25 de janeiro 2014 178,15 € 0,0% 178,16 € 0,3% 2015 178,15 € 0,0% 177,29 € -0,5% 2016 180,99 € 1,6% 179,03 € 1,0% Decree-law nº 1/2016, de 6 de janeiro 2017 183,84 € 1,6% Portaria nº 5/2017, de 3 de janeiro
Source: For nominal values https://dre.pt/; For real values calculations it was used the IPC – base 2012, annual values, available at www.ine.pt
In 2010, there was a slight decrease (-0,1%) in its real value, because the nominal increase was below the inflation rate. Between 2010 and 2012, there were no changes in the nominal value, thus decreases in the real value were observed, explained by the inflation rate. In 2013, an important nominal decrease (-6%) of the reference amount was implemented by law, translated into the most important decrease observed in real terms (-6,3%). Variations in its real value in 2014 (slight
6
Other changes were for instance those introduced by the Means Tested Condition Law of 2010 (Decree-law nº 70 de 2010, 16 de junho): household definition, elimination of support for housing expenses and other supplementary benefits for health, education and transportation, the consideration of housing benefits, social benefits and scholar and professional grants in the evaluation of the income, the introduction of a real estate test limit, etc
14
increase) and in 2015 (slight decrease) are fully explained by the inflation rate. In 2016 and 2017, the value was increased aiming at compensating, in a phased way (25% each time), the decrease of 2013. By 2017, both the nominal and the real value were below the value guaranteed in 2009. The equivalence scales adopted have also changed over time, especially under the austerity policy orientation (Table 5).
Table 5 Guaranteed Minimum Income/Social Insertion Income Equivalence Scales
1996 GMI/SII 2010 OECD 2012 OECD Modified 2016 OECD 2017 Claimant 1 1 1 1 183,84€ 2nd adult 1 — — — — each additional adult 0,7 0,7 0,5 0,7 128,69€ each minor 0,5 0,5 0,3 0,5 91,92€
Source: Own elaboration
Table 6 shows the evolution of beneficiaries since 2006.
Table 6 Evolution of Beneficiaries of SII and amount paid (nominal values) since 2006
Year Number of Beneficiaries Annual Growth of beneficiaries Monthly average allowance amount by beneficiary (€) Monthly average allowance amount by family (€) 2006 332 122 79,88 216,48 2007 369 078 11% 82,57 222,31 2008 417 400 13% 87,58 230,99 2009 485 537 16% 92,54 239,64 2010 525 723 8% 87,61 228,07 2011 447 266 -15% 89,09 242,01 2012 420 506 -6% 83,54 214,68 2013 360 235 -14% 86,65 210,85 2014 320 674 -11% 91,39 215,37 2015 295 668 -8% 94,84 213,89 2016 (November) 214 058
Source: Statistics of Social Security, 2017
It is apparent from the data presented that in the worst years of the economic crisis (between 2011 and 2013), the number of beneficiaries decreased. In these years unemployment increased and family income decreased (especially in 2011 and 2012). This paradox can only be explained by the
15
changes introduced in this measure during this period that diminished the level of protection, namely the changes in equivalence scale in 2010 and 2012, and the decrease of the reference value in 2013.
Considering both changes in the threshold value and in the equivalence scales, table 7 presents the evolution in the minimum income guaranteed by the non-contributory social protection regime in Portugal for a single working age adult living alone and a couple of working age adults (considering in both cases that they have no income from work)7 from 2006 to 2017.
Table 7 Net monthly income of working age adults, with no income from work, receiving the social
insertion income
Net monthly income Net monthly income
(nominal value) (real value - CPI 2012)
Single Couple Single Couple
Jan-06 171,73 € 343,46 € 193,35 € 386,70 € Jan-07 177,05 € 354,10 € 194,56 € 389,13 € Jan-08 181,91 € 363,82 € 194,86 € 389,72 € Jan-09 187,18 € 374,36 € 202,20 € 404,39 € Jan-10 189,52 € 379,04 € 201,89 € 403,78 € Jan-11 189,52 € 322,18 € 194,78 € 331,12 € Jan-12 189,52 € 322,18 € 189,52 € 322,18 € Jan-13 178,15 € 267,23 € 177,66 € 266,49 € Jan-14 178,15 € 267,23 € 178,16 € 267,24 € Jan-15 178,15 € 267,23 € 177,29 € 265,94 € Jan-16 180,99 € 307,68 € 179,03 € 304,35 € Jan-17 183,84 € 312,53 €
Source: Own calculations. For nominal values based on https://dre.pt/; For real values it was used the IPC – base 2012, annual values, available at
www.ine.pt
It is apparent from table 7 that the net monthly income guaranteed by the state to working age adults, with no income from work, achieved its peak in real value in 2009, that the real value guaranteed decreased during the worst years of the economic crisis, especially for couples (due to changes in equivalence scales), and that the recent increases in nominal value, in 2016 and 2017, were not enough to recover to the real value guaranteed 10 years before (in 2006).
7
This assumption is important because to determine the income of the individual/household and calculate the amount of the allowance, only 80% of net income from work is considered, and if the claimant or other household member in situation of unemployment starts working during the period receiving social insertion income, only 50% of the net income for work is considered for the first twelve months. This means that the minimum income guaranteed for those with income from work can be higher, with an upper limit of 120% of the reference amount in general and 150% for the referred specific situations.
16 2.4. Solidarity supplement for the elderly
The Solidary Supplement for the Elderly (SSE) was launched in 2005 as a policy measure targeted to elders living below the poverty line. More than 30 years after the democratic revolution in Portugal, which inaugurated the principles and the structure of an universalist social security net based on the statute of citizenship and on the idea of social rights, it was clear that the implemented measures were not enough to respond to a social minimum standard.
SSE was created as a positive discrimination measure, directed to one of the most vulnerable groups of the Portuguese society – the elders. The measure aims at taking out of poverty a group of the population who wasn’t supposed to be poor under the framework of a welfare state with social protection guarantees. Indeed, in the turn of the millennium a significant part of people in poverty was constituted either by workers (working poor) or by elders, which was sound evidence that the fragile universalistic net and the occupational net were not able to solve the problem. The preamble of the Decree which implemented SSE mentioned as “intolerable” the circumstance of being in “the group of elders that are still observed the most severe situations (…), urging from that an intervention targeted to this age group in order to improve the social frailty situation they are at” (Decree-law n. 232/2005, 29 de Dezembro).
The scene was set to enable more efficiency in the fight against poverty among this group through the creation of a scheme of income complement in order to reach the value of the “poverty line” and eliminate the gap below. It was recognized, though, right from the beginning of its implementation, that attention should be draw to different background situations and that the measure should avoid the universalistic character attributed to others (namely, minimum pension) and work as a differentiation measure for the most vulnerable:
“(…) it is emphasized the absolute need to proceed with a profound reformulation of social minimums for elders policies, trying to improve levels of efficiency in the reduction of inequalities, but also higher levels of accountability of all who can and should contribute to enhance elders’ life quality, namely their families” (Decree-law 232/2005, 29 de Dezembro).
Hence, the measure has a non-contributive nature and is targeted to people older than 66 years and three months,8 which is the age limit beyond which the old age contributory pension is due. It is only attributed to elders with low economic resources with a reference value for total income that is
8
Inittially, it was directed to people above 65. It has been, with the introduction of the sustainability factor in 2014 (Portaria 277/2014), suffering changes towards the uprising of the threshold of application.
17
annually established having as approximate reference the relative at risk of poverty line (60% of median equivalent income) in Portugal. Specifically, for 2017, the pre-conditions to be entitled are:
If the person lives in a couple (legally married or not) for more than 2 years, the resources for the couple shouldn’t be more than 8897,52€/year and the personal resources of the beneficiary should be equal or lower than 5084,30€ (thus considering a factor of scale of 0,75 for the second adult);
If it is a single person (not living in a couple for more than 2 years), the resources should be equal or lower than 5084,30€.
For this matter, as resources it is understood the own annual income, the annual income of the spouse and an amount defined in relation to children’s income, independently if they live or not with the beneficiary.
The means-tested analysis includes the income from work or other professional activities, the income generated by capital investment and real estate; any kind of social support issued by the social security system; pensions; money transfers from other persons or organizations, and a percentage of the value of own properties (excluding the residence of the beneficiary). In relation to children’s income assessment, it is made through the analysis of the tax declaration and, depending on the income bracket, the values considered may range from 0,00€ to 508,43€ (for single person) and to 444,88€ (for couples). Elders with children in the highest income bracket are not entitled to SSE9.
Additionally, to benefit from the measure the applicant shall be living in Portugal for, at least, 6 years in a row; be beneficiary of any contributive or non-contributive social measure to which is entitled; allow social security to assess all fiscal and banking information from the applicant and respective spouse, and be willing to require any other social support and alimony to which is entitled.
In sum, and for the year 2017, the SSE ensure that no elder is living with less than 5084,30€ per year (i.e. 423,69€ per month). Hence, SSE is a monthly subsidy which covers the difference between own resources (including children income) and the reference value considered.
9
Theoretically this doesn´t mean that the income guaranteed is different for these cases, because, in those cases, the state transfers to descendants the responsibility of providing the amount needed to achieve the threshold. This transference of responsibility is based in the Portuguese Civil Code (art. 1874 and 2009, Decree-law 47344/66, 25 de novembro) that imposes a maintenance duty towards ascendants (based on family solidarity) and it has been one of most polemic features of solidarity supplement for the elderly since its creation.
18
The benefit is not limited in time, but is subjected to the strict compliance with the stipulated obligations, namely, to declare any change of the household, of residence and of resources. In such case, the benefit is suspended and after two years of suspension, it is cancelled.
The benefit is supplemented with other kind of support namely the health additional benefits and the extraordinary social support for energy consumer (both gas and electricity), to which the elderly receiving the SSE are entitled to.
The reference amount is supposed to be updated taking into consideration the evolution of prices, economic growth and wealth distribution (art. 9º, Decree-law nº 232/2005, 29 de dezembro), and since 2006 to the present, the main changes introduced in this measure were in fact related to the reference value.
Between 2006 and 2010, the nominal value of the threshold was increased (in 2007 and 2009 considering the annual evolution of nominal GDP per capita, and in 2008, the greatest increase, considering also the data of EU-SILC 2006)10, which allowed a rise in its real value, because the increases were above the inflation rate (Table 8).
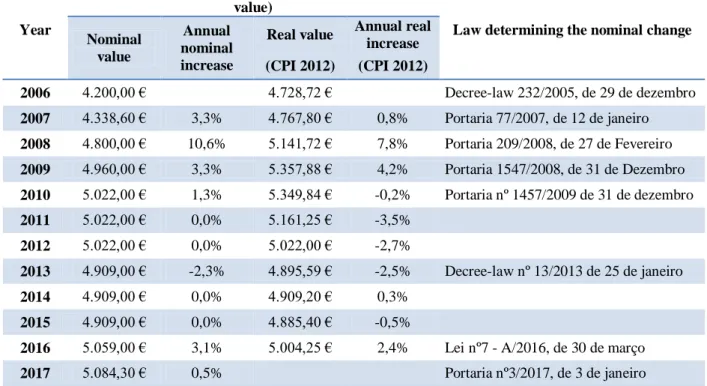
Table 8 Evolution of solidarity supplement for the elderly threshold since 2006
Year
Solidarity supplement for the elderly threshold (annual value)
Law determining the nominal change Nominal
value
Annual nominal increase
Real value Annual real increase (CPI 2012) (CPI 2012) 2006 4.200,00 € 4.728,72 € Decree-law 232/2005, de 29 de dezembro 2007 4.338,60 € 3,3% 4.767,80 € 0,8% Portaria 77/2007, de 12 de janeiro 2008 4.800,00 € 10,6% 5.141,72 € 7,8% Portaria 209/2008, de 27 de Fevereiro 2009 4.960,00 € 3,3% 5.357,88 € 4,2% Portaria 1547/2008, de 31 de Dezembro 2010 5.022,00 € 1,3% 5.349,84 € -0,2% Portaria nº 1457/2009 de 31 de dezembro 2011 5.022,00 € 0,0% 5.161,25 € -3,5% 2012 5.022,00 € 0,0% 5.022,00 € -2,7% 2013 4.909,00 € -2,3% 4.895,59 € -2,5% Decree-law nº 13/2013 de 25 de janeiro 2014 4.909,00 € 0,0% 4.909,20 € 0,3% 2015 4.909,00 € 0,0% 4.885,40 € -0,5%
2016 5.059,00 € 3,1% 5.004,25 € 2,4% Lei nº7 - A/2016, de 30 de março
2017 5.084,30 € 0,5% Portaria nº3/2017, de 3 de janeiro
Source: For nominal values, https://dre.pt/; For real values, own calculations using the IPC – base 2012, annual values, available at www.ine.pt
10
As mentioned before, because this measure has a specific intention of drawing the elderly out of poverty, the relative at risk of poverty line (60% of the median equivalent income) was considered from the beginning as an approximate reference to establish the reference amount of the supplement. In 2008, the value used was the relative poverty line of 2006, the one available by then, updated to 2008 using nominal GDP per capita change.
19
From 2010 to 2013, there was a decrease in the real value, because the increase in 2010 was below the inflation rate11, in 2011 and 2012 there were no changes in the nominal value and in 2013 the nominal change was a decrease. In 2014 and 2015 no changes were introduced in the nominal value. In 2016 and 2017, the nominal value was increased but the real value in 2016 was still quite below the value guaranteed in 2009 and even the real value guaranteed in 2012.
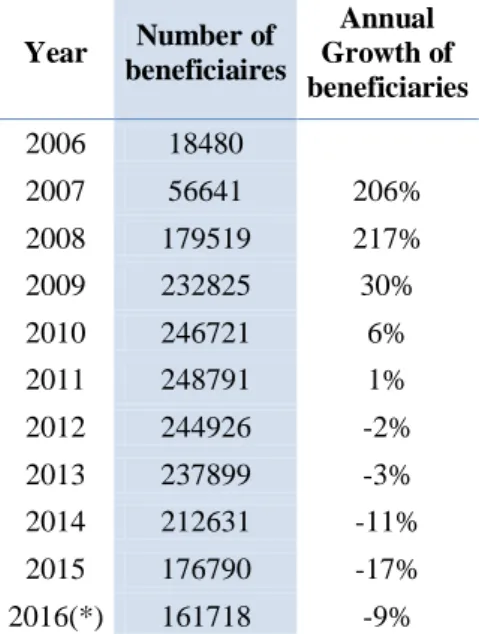
Table 9 presents the number of beneficiaries of SSE since its implementation in 2006. Table 9 Evolution of Beneficiaires of SSE since 2006
Year Number of beneficiaires Annual Growth of beneficiaries 2006 18480 2007 56641 206% 2008 179519 217% 2009 232825 30% 2010 246721 6% 2011 248791 1% 2012 244926 -2% 2013 237899 -3% 2014 212631 -11% 2015 176790 -17% 2016(*) 161718 -9%
Note: (*) calculated as average of monthly data for 2016 (jan-nov.) in http://www.seg-social.pt/estatisticas
Source: Adapted from http://www.seg-social.pt/estatisticas
The analysis of the available data show three different movements that might distinguish different stages of the measure implementation: 1st period, 2006-2008 – very significant growth of the measure, with very quick widespreading, linked to the phased implementation of the measure by age12; 2nd period, 2009-2011 – stabilization of growth, pre-austerity period; 3rd period, 2012-2016 – decreasing in the number of beneficiaries of the measure (austerity period), probably due to the cross-effect between the raising of the pension and social pension (in 2012 and 2013), the stabilization (in 2012, 2014 and 2015) and decrease (in 2013) of the threshold and limitations imposed in the means-testing conditions.
11
For this change, differently from before, the criteria for the increase were the ones used for the update of the indexing reference of social support. This was because if the nominal GDP per capita change was to be used (as before) it would imply a decrease in the value.
12
In 2006, to elders with 80 or more years, in 2007 to elders with 70 or more years and in 2008 to elders with 65 or more years.
20
Considering the changes in the threshold value (the equivalence scale has remained the same), table 10 presents the evolution in the minimum income guaranteed by the non-contributory social protection regime in Portugal for an elder living alone and a couple of elders from 2006 to 2017. Table 10 Net monthly income of elders, receiving the solidarity supplement for elders
Net monthly income Net monthly income
(nominal value) (real value - CPI 2012)
Single Couple Single Couple
Jan-06 350,00 € 612,50 € 394,06 € 689,60 € Jan-07 361,55 € 632,71 € 397,32 € 695,30 € Jan-08 400,00 € 700,00 € 428,48 € 749,83 € Jan-09 413,33 € 723,33 € 446,49 € 781,36 € Jan-10 418,50 € 732,38 € 445,82 € 780,18 € Jan-11 418,50 € 732,38 € 430,10 € 752,68 € Jan-12 418,50 € 732,38 € 418,50 € 732,38 € Jan-13 409,08 € 715,90 € 407,97 € 713,94 € Jan-14 409,08 € 715,90 € 409,10 € 715,92 € Jan-15 409,08 € 715,90 € 407,12 € 712,45 € Jan-16 421,58 € 737,77 € 417,02 € 729,79 € Jan-17 423,69 € 741,46 €
Source: Own calculations. For nominal values based on https://dre.pt/; For real values it was used the IPC – base 2012, annual values, available at
www.ine.pt
It is apparent from table 10 that the net monthly income guaranteed by the state to elders achieved its peak in real value in 2009, that the real value guaranteed decreased during the worst years of the economic crisis, and that the recent increases in nominal value, in 2016 and 2017, were not enough to recover to the real value guaranteed 8 years before (in 2008).
3. Comparing the minimum income guaranteed by the state for different household types
In this section the minimum income guaranteed by the state for different household types, between 2006 and 2017, is compared, first for single cases and secondly for couple cases. To make the comparison, in each year it is used as reference the value guaranteed for the working age, employed full time, cases.
Table 10 shows that the value guaranteed for the working age, employed full time, case is the greatest one in all the period considered. For elders the value guaranteed in the same period varies between 73% (in 2017) and 90% (in 2008) of the amount guaranteed for working age, employed full time. In fact, since 2008 there is a constant relative decrease in the amount guaranteed for elders compared to working age, employed full time. It is important to note thought that the elders
21
receiving SSE are entitled to some important benefits in health, energy and transportation, to which working age employed full time are not entitled. For working age unemployed the value guaranteed varies between 32% (in 2017) and 43% (in 2006), with a constant relative decrease in the amount guaranteed compared to working age, employed full time, since 2006. Working age adults receiving SSI are also entitled to some additional benefits (some of the benefits were eliminated in the period but in 2017 there were still some benefits related to health, energy and transportation).
Table 11 Minimum income guaranteed for single cases, since 2006
Minimum Income Guaranteed Working age,
employed full time
Working age,
unemployed Elders
Nominal value in % of nominal value for workers
in % of nominal value for workers Jan-06 400,69 € 43% 87% Jan-07 418,45 € 42% 86% Jan-08 442,33 € 41% 90% Jan-09 467,25 € 40% 88% Jan-10 493,21 € 38% 85% Jan-11 503,59 € 38% 83% Jan-12 503,59 € 38% 83% Jan-13 503,59 € 35% 81% Jan-14 503,59 € 35% 81% Jan-15 524,36 € 34% 78% Jan-16 550,32 € 33% 77% Jan-17 578,35 € 32% 73%
Source: Own calculations
Table 12 also shows that the value guaranteed for the working age, employed full time, case is the greatest one in all the period considered. For elders the value guaranteed in the same period varies between 64% (in 2017) and 79% (in 2008) of the amount guaranteed for working age, employed full time. In fact, since 2008 there is a constant relative decrease in the amount guaranteed for elders compared to working age, employed full time. For working age unemployed the value guaranteed varies between 25% (in 2015) and 43% (in 2006), with an almost constant relative decrease in the amount guaranteed compared to working age, employed full time, between 2006 and 2017, being the only exception 2016 (because of the change in the equivalence scale).
22
Table 12 Minimum income guaranteed for couple cases, since 2006
Minimum Income Guaranteed Working age,
employed full time
Working age,
unemployed Elders
Nominal value
in % of nominal value for workers
in % of nominal value for workers
Jan-06 801,38 € 43% 76% Jan-07 836,90 € 42% 76% Jan-08 884,66 € 41% 79% Jan-09 934,50 € 40% 77% Jan-10 986,42 € 38% 74% Jan-11 1.007,18 € 32% 73% Jan-12 1.007,18 € 32% 73% Jan-13 1.007,18 € 27% 71% Jan-14 1.007,18 € 27% 71% Jan-15 1.048,72 € 25% 68% Jan-16 1.100,63 € 28% 67% Jan-17 1.156,70 € 27% 64%
Source: Own calculations
It is clear by the analysis presented that the minimum income guaranteed by the state for working age adults employed full time relatively increased in the period, eventually putting this group in a relative better off situation, especially in the case of couples.13
4. Assessing the adequacy of the minimum income guaranteed by the state
In this section a crude assessment of the adequacy of the minimum income guaranteed by the state for different household types, between 2006 and 2017, is presented first for single cases and secondly for couple cases. To make this assessment, in each year, it is used as reference the relative at risk of poverty line in Portugal (60% of the median equivalent income).
This is a very crude assessment of adequacy because the amount implied in the relative poverty line doesn´t corresponds to the amount needed to lead a dignified life14 (Pereira, 2010). Nevertheless, because the results of the Adequate Income in Portugal research project15 are still to be disclosed,
13
The word eventually is used because a complete assessment would have to take into account both that there are in average some work related expenses (namely those on daily transportation) that the other cases don’t have and that the other cases have access to benefits in health, energy and transport to which working age employed full time are not entitled, although, in the case of elders, it is predictable that the health expenditures needed are also higher in average. 14
Only by coincidence could this be the amount needed to have a decent and dignified standard of living. 15
Adequate Income in Portugal (aiP) is a research project, conducted by a team of researchers who are also authors of this paper, funded by FCT, that adopts the consensual budget approach in order to determine a socially agreed and empirically based standard of the level of income needed for different family types to reach a decent and dignified standard of living.
23
we have decided to use the relative at risk of poverty line in Portugal (60% of the median equivalent income and the OCDE modified equivalent scale associated) as a very crude indicator.
For the single working age employed full time case, it is apparent from table 13 that the minimum income guaranteed by the state, in this period, was sufficient to prevent a situation of poverty, with a relative value that varied between a minimum of 103% (in 2007) and a maximum of 123% (in 2012). In fact, in the worst years of economic crisis (between 2011 and 2013) the minimum income for the case was above 120% the relative poverty line (mostly because the value of the line decreased with the decrease of median income in Portugal).
Table 13 Comparison between the minimum income guaranteed and the relative poverty line, since
2006, for singles
Minimum Income Guaranteed
(in % of the relative poverty line) Relative Poverty
Line for a Single (nominal value) Working age,
employed full time
Working age, unemployed Elders Jan-06 106% 45% 92% 378,67 € Jan-07 103% 43% 89% 407,17 € Jan-08 107% 44% 97% 414,08 € Jan-09 108% 43% 95% 433,92 € Jan-10 117% 45% 100% 420,50 € Jan-11 121% 46% 101% 416,17 € Jan-12 123% 46% 102% 408,83 € Jan-13 122% 43% 99% 411,42 € Jan-14 119% 42% 97% 421,75 € Jan-15 119% 41% 93% 439,00 €
Source: For Relative Poverty Line, INE, ICOR, 2017; For others, own calculations.
For the single working age unemployed case, it is clear from table 13 that the minimum income guaranteed by the state, in this period, was not sufficient to withdraw these cases out of poverty, with a relative value that varied between a minimum of 41% (in 2015) and a maximum of 46% (in 2011 and 2012). In fact, in the latest years (2012-2015) the gap increased.
For the single elder case, the minimum income guaranteed by the state, in this period, oscillated around the relative poverty line value, with a relative value that varied between a minimum of 89% (in 2007) and a maximum of 102% (in 2012). It is important to note that this measure has a specific intention of drawing the elderly out of poverty and that the relative at risk of poverty line was considered from the beginning as an approximate reference to establish the reference amount of the supplement. But in part because there is a lag of two years between the year of income assessment
24
and the disclosure of SILC results and in part because the updating of the supplement wasn’t always made in a strict obedience to the value of the poverty line, only by coincidence the value would be the same.
For the couple working age employed full time case, it is clear from table 14 that the minimum income guaranteed by the state, in this period, was quite sufficient to prevent a situation of poverty, with a relative value that varied between a minimum of 137% (in 2007) and a maximum of 164% (in 2012). Again the relative value was bigger in the worst years of economic crisis (between 2011 and 2013), above 160% the relative poverty line.
Table 14 Comparison between the minimum income guaranteed and the relative poverty line, since
2006, for couples
Minimum Income Guaranteed
(in % of the relative poverty line) Relative Poverty
Line for a Couple (nominal value) Working age,
employed full time
Working age, unemployed Elders Jan-06 141% 60% 108% 568,00 € Jan-07 137% 58% 104% 610,75 € Jan-08 142% 59% 113% 621,13 € Jan-09 144% 58% 111% 650,88 € Jan-10 156% 60% 116% 630,75 € Jan-11 161% 52% 117% 624,25 € Jan-12 164% 53% 119% 613,25 € Jan-13 163% 43% 116% 617,13 € Jan-14 159% 42% 113% 632,63 € Jan-15 159% 41% 109% 658,50 €
Source: For Relative Poverty Line, INE, ICOR, 2017; For others, own calculations.
For the couple working age unemployed case, the minimum income guaranteed by the state, in this period, was not sufficient to withdraw these cases out of poverty, with a relative value that varied between a minimum of 41% (in 2015) and a maximum of 60% (in 2006 and 2010). In fact, in the latest years (2012-2015) the gap increased.
For the couple elder case, the minimum income guaranteed by the state, in this period, was always sufficient to prevent a situation of poverty, with a relative value that varied between a minimum of 104% (in 2007) and a maximum of 119% (in 2012). The difference vis-à-vis the single case is explained by the fact that the equivalence scale used in the supplement assigns a value of 0,75 to the second adult whereas the OCDE modified equivalence scale used in the calculation of the relative poverty line assigns a value of 0,5 to the second adult.
25 5. Final remarks
This paper was focussed on the assessment of the effect, on income adequacy, of policy measures taken in Portugal in a recent period of the history of this country characterized by the emergence of a financial, and then an economic crisis, followed by a period of austerity (public finance driven measures of internal social devaluation) and, more recently, a period of reverse of the economic policy, devoted to recover lost incomes and addressed to the rise of internal demand as a positive factor of economic growth.
It was an exploratory quantitative study, having been selected three income sources which reflect relevant policy measures for this period: minimum wage, insertion income and solidarity supplement for elders. After describing the trend on minimum income for each of these income sources, six different household categories were considered for such assessment: a single working age adult employed full time, a couple of working age adults, both employed full time, a single working age adult unemployed, a couple of working age adults both unemployed, a pensioner living alone and a couple of pensioners. The correspondence of the above income sources to these household categories is straightforward.
The assessment of income adequacy for these household categories requires the use of an acceptable adequate income threshold for the different household types, which does not exist yet in Portugal, although this country participated in the EU projet on reference budgets16 (Goedeme et
al., 2015) intending a future comparable estimative of adequate income for all EU countries.
EUROSTAT poverty threshold (60% median income), considered a rough and rather imperfect measure of adequate income, was used. The forthcoming availability of the adequate income for different household types in 2005 in Portugal, estimated in the context of the Adequate Income in Portugal research project above-mentioned, will allow a better assessment of such adequacy.
It is clear from the results that the real minimum income guaranteed by the state, related to the three policy measures analysed, decreased during the economic crisis, which is a paradox. Part of this decrease, namely on the policy measures of the non-contributory social protection system, can be explained by deliberated non increasing and/or decreasing changes in its nominal values (both in SSI and SSE) and equivalence scales (in the case of SSI). The most affected measure was SII,
16
With a team of researchers who are also authors of this paper. The budget calculated for Portugal is limited to a food budget.
26
whose real value in 2016 was below the real value guaranteed 10 years before (in 2006). In general in the post austerity period, in 2016 and 2017, there has been some recovery in the level of protection.
The SII, the only of the three measures analyzed with an universal character, corresponds, during this period, to the lowest level of minimum income guaranteed by the state and was the policy measure that was most negatively affected by ad-hoc changes during the economic crisis and the austerity period. In fact, it is visible the relative low level of the minimum income guaranteed by this measure, compared both with minimum wage and with the amount guaranteed by SSE, and the results show a constant relative decrease along the period in the amount guaranteed compared to the other policy measures. Furthermore, as the results for adequacy demonstrate the amount was never enough to prevent a situation of poverty for the households considered and the gap between the amount guaranteed and the relative poverty line has increased in recent years.
Thus, the most relevant meaning of SII in Portugal lies more on logic and scope of the universalisation than on the standard of needs satisfaction that it provides. In this context, it is in line with the Beveridgean universalist principle, but does not match the Marshallian concept of citizenship.
It is interesting to note that it was in the period of the economic crisis that the relative values of the income guaranteed by the state for most of the cases (the exception being the couple of working age not employed), in relation to the relative poverty line, were highest (although only slightly). This doesn’t mean, as already mentioned, that its level of adequacy increased but only that the decrease in the level of protection accompanied the decreasing income observed in Portugal.
References
Branco, F. (2001). A Fase Lunar dos Direitos Sociais: O Rendimento Mínimo Garantido como direito de cidadania em Portugal: virtualidades e limites. Tese de Doutoramento, PUC/SP, São Paulo, Abril 2001.
Costa, A. B., & Maia, F. (1985). “Segurança Social em Portugal - Principais características e análise dos seus efeitos distributivos”. In Desenvolvimento (2), 81-114.
Goedemé, T., Storms, B., Penne, T., and Van den Bosch, K. (eds.) (2015), The development of a methodology for comparable reference budgets in Europe - Final report of the pilot project, Pilot
27
project for the development of a common methodology on reference budgets in Europe, Contract no. VC/2013/0554. Brussels: European Commission.
Pereira, E. (2010). “Observar a pobreza em Portugal: uma leitura crítica das principais abordagens à operacionalização do conceito de pobreza”. In Fórum Sociológico, n. 20, pp. 57-66.
Pereirinha, J, Murteira, M. C. (2016). “The Portuguese Welfare System in a Time of Crisis and Fiscal Austerity”. In Schubert, K., de Villota, P., Kuhlman, J. (eds), Challenges to European
Welfare Systems (pp. 587-613). Springer, pp. 587-613
Pereirinha, J., Branco, F. (2013). “Uma abordagem histórica dos padrões de rendimento mínimo em Portugal”. In Ler História, 64, pp. 55-84