Dissertação Elaborada com vista à obtenção do Grau de Mestre em Ergonomia
Orientador: Professor Doutor Paulo Ignácio Noriega Pinto Machado
Júri:
Presidente
Professor Doutor Francisco dos Santos Rebelo Vogais
Professor Doutor José Domingos de Jesus de Carvalhais Professor Doutor Paulo Ignácio Noriega Pinto Machado Professora Doutora Maria Emília Capucho Duarte
Abstract:
Warnings, posted signs, alarms and labels on products are a constant in our everyday routine. All this information is made available with the main purpose of warning us of the risks and dangers to which we are exposed. The purpose of the present study was to examine how time pressure affects the compliance with warnings/ posted signs and exit signs. A virtual reality (VR) scenario was used. Fifty participants, were divided in two groups, one with no time pressure and the other with time pressure, to perform a work security verification routine during which a fire occurred and the participants had to leave the building guided by the exit signs. The results suggests that, under time pressure, the compliance with signs is worse. This work aims to contribute to the design of more effective warnings.
Keywords: Time Pressure; Warnings; Behavioural compliance; Virtual reality;
Resumo
Avisos, sinais, alarmes e rótulos de produtos são uma constante no nosso dia-a-dia. Esta informação é disponibilizada com o objetivo de nos alertar para os riscos e perigos a que estamos expostos. Este trabalho teve como objectivo avaliar como a pressão temporal influencia a consonância comportamental com avisos/sinais e sinalização de saída de emergência Para tal, utilizou-se um cenário de realidade virtual (RV). Cinquenta participantes divididos em dois grupos, um sem pressão temporal e outro com a pressão temporal, tinham de executar uma rotina de verificação de segurança, durante a qual ocorria um incêndio e, para saírem do edifício, os participantes tinham de seguir os sinais de saída de emergência. Os resultados sugerem que, sob pressão temporal, a consonância comportamental com sinais é pior do que quando não existe pressão temporal. Este trabalho tem como objetivo contribuir para a concepção de avisos mais eficazes.
Palavras - chave: Pressão Temporal; Avisos; Consonância comportamental; Reallidade Virtual; Ergonomia; Modelo CHIP; Sinalização; Sinais de Evacuação;
Comportamento Humano; Segurança. .
Acknowledgments
This work only was possible with the contributions of a multidisciplinary team. In this sense I would like to express my gratitude to the followingpersons that contributed to this work
First and foremost, I would like to thank Professor Noriega for his advice, patience and time.Thanks are also to Professor Rebelo for his critical opinions. I would also like to thank the multidisciplinary team of the ergonomics lab for the help with this work Dori, Tânia and Luís.
Thank you to all participants
And lastly I woul like to thank my familly and friends, specialy to my sidekick, Carlos, for their support.
Índex
ABSTRACT: ... 2 RESUMO ... 3 ACKNOWLEDGMENTS ... 4 ÍNDEX ... 5 INDEX OF FIGURES ... 7 INDEX OF TABLES ... 8 INDEX OF CHARTS ... 9 INDEX OF APPENDICES ... 10 1. INTRODUCTION ... 11 1.1 QUESTION IN STUDY ... 14 2. LITERATURE REVIEW ... 15 2.1 WARNINGS ... 152.1.1. Warnings Vs Posted Signs ... 16
2.2 HUMAN PROCESS INFORMATION ... 16
2.2.1 Communication- Human Information Processing (C-HIP) Model ... 18
2.3 COMPLIANCE ... 20 2.4 TIME PRESSURE ... 21 2.5. HYPOTHESIS ... 21 3. METHOD ... 23 3.1. EXPERIMENTAL DESIGN... 23 3.2. THE SESSION ... 23 3.3 VARIABLES ... 25 3.4. PARTICIPANTS ... 25 3.5. MATERIALS ... 25 3.5.1. Questionnaire ... 25 3.5.2. ErgoVR ... 25 3.6 EQUIPMENT ... 26 3.7. EXPERIMENT FACILITIES ... 26 3.8. VIRTUAL ENVIRONMENT ... 26
3.9. WARNINGS, POSTED SIGNS AND EXIT SIGNS USED: ... 29
3.9.1. Ambiguous sign ... 30
3.10. INSTRUCTIONS PRESENTED IN VE ... 31
3.11. PROCEDURE ... 31
4.1. BEHAVIOURAL COMPLIANCE ... 33
4.1.2 Global compliance ... 33
4.1.3 Compliance with warnings ... 35
4.1.2 Compliance with Posted signs ... 35
4.1.2 Compliance with Exit Signs ... 36
4.2. TIME ... 38 4.2.1 Time Spent ... 38 4.2.2. Task time ... 39 4.2.3. Egress time... 41 5. DISCUSSION ... 43 6. CONCLUSION ... 46 APPENDICES ... 51
Index of figures
FIGURE 1-ISO(LEFT) VS OSHA/ANSI(RIGHT) WARNINGS ... 13
FIGURE 2-THE C-HIP MODEL (KARWOWSKI,2006) ... 18
FIGURE 3 – STARTING POINT ... 28
FIGURE 4- MEETING ROOM ... 28
FIGURE 5- LABORATORY ... 28
FIGURE 6 - FIRE AT WAREHOUSE ... 28
FIGURE 7- WARNINGS USED IN VIRTUAL ENVIRONMENT ... 29
FIGURE 8- POSTED SIGN USED IN VIRTUAL ENVIRONMENT ... 29
FIGURE 9- EXIT SIGN USED IN VIRTUAL ENVIRONMENT ... 30
FIGURE 10- AMBIGUOUS SIGN ... 30
Index of tables
TABLE 1- MANN WHITNEY U RESULTS FOR WARNINGS AND POSTED SIGNS ... 34
TABLE 2- CHI-SQUARE RESULTS FOR WARNINGS AND POSTED SIGNS ... 34
TABLE 3- PRESSED BUTTONS BY EXPERIMENTAL CONDITIONS FOR WARNINGS (%) ... 35
TABLE 4- PRESSED BUTTONS BY EXPERIMENTAL CONDITIONS FOR POSTED SIGNS (%) ... 36
TABLE 5- MANN WHITNEY U FOR COMPLIANCE WITH EXIT SIGNS ... 37
TABLE 6- CHI-SQUARE RESULTS FOR EXIT SIGNS ... 37
TABLE 7- SUMMARY STATISTICS OF THE TIME SPENT IN THE SIMULATION (IN SECONDS) BY CONDITION 39 TABLE 8- SUMMARY STATISTICS OF THE TASK TIME (IN SECONDS) BY CONDITION ... 40
Index of charts
CHART 1- BEHAVIOURAL COMPLIANCE FOR WARNINGS AND POSTED SIGNS ... 33
CHART 2- COMPLIANCE FOR EXIT SIGNS ... 37
CHART 3- BOXPLOT FOR TIME SPENT ... 39
CHART 4- BOXPLOT TIME FOR TASK TIME ... 40
Index of appendices
APPENDIX I - COVER STORY, TRANSLATED IN ENGLISH, FOR "NO TIME PRESSURE" GROUP... 52 APPENDIX II - COVER STORY, TRANSLATED IN ENGLISH, FOR "TIME PRESSURE" GROUP ... 53 APPENDIX III - THE VE LAYOUT ... 54
1. Introduction
Warnings, posted signs, alarms and labels on products are a constant in our everyday routine. All this information is made available with the main purpose to warn us of the risks and dangers to which we are exposed.
According to Wogalter (2006) the four main purposes or functions of warnings are:
First: Be a method for communicating important safety information in order to provide people adequated information about hazards so they can make informed decisions on how to avoid getting themselves or others hurt. In orther to accomplish this functions some salient features are incoporated in the design of warnings in away to call attenttion to themselves.
Second: Warnings are intended to influence or modify people behaviour with the intention to improve safety.
Third: Warnings are intended to reduce or prevent health problems, workplace accidents, property damage and personal injury.
Fourth: It can be a reminder for people who already know information about the harzadous.
There are many kind of warnings. It can be in form of audio, labels, signs, tags, etc.
In general a warning is consisted by two areas:
A. Signal Word Panel: Has the objective of capture attention. It can have text, symbols or both and is consisted by three parts:
a) Signal word: Danger, Warner or Caution.
c) An alert symbol: An exclamation point inside a triangle icon.
B. Message Panel: Has three components that can be text, symbols or both. The components are:
a) Hazard information: identifies the danger (e.g., high voltage).
b) Instructions: tell what to do or not do to avoid the harzard (e.g., keep out).
c) Consequences: describe what may happen if the harzard is not avoided (e.g., death)
When information can be readily inferred from the other information presented in the warning one or more components can be eliminated.
Standardization of safety-related warning messages has the goal of making the warnings easy to recognize and easy to understand, and thus limiting the human and money cost of foreseeable errors and accidents. There is three major organizations working in this field: ANSI (the American National Standards Institute) and ISO (the International Organization for Standardization) and OSHA (the Occupational Safety & Health Administration of the U.S. Department of Labor).
In 2013: OSHA updated its rules on safety signs and tags–regulations which had not been changed since their inception in 1971. The new rule incorporates the appropriate ANSI Z535-2011 standard reference into OSHA's standards wherever safety signs, colors and tags are specified.
ISO and ANSI have similar goals – uniform systems to give users and others information about hazards, the severity of the hazards, and how to avoid them. The major difference is the method each system uses to achieve its goals.ISO places a heavier reliance on pictorial warnings than ANSI. In fact, the ISO warning
signal word and a message panel provide necessary information to the product user.
Figure 1 - ISO (left) vs OSHA/ANSI (right) warnings
Yet, despite all this information, accidents stil happen, some of them, because we ignore the alerts (Paul & Stimers, 2012). We need to ensure that warnings are effective, or consider alternative ways of reducing the risks.
An important consideration in safety analysis and accident prevention is the identification of warnings and signs and how we respond to them. Knowing how people react to time pressure is very important to design safer environments.
This study builds on the work of Duarte (2010), on the use of virtual reality
environments for assessing compliance with warnings. After Duarte’s (2010)
work, the importance of studying whether time pressure affects the compliance with warnings was identified.
Managers and other professional decision makers frequently identify time pressure as a major constraint on their behaviour (Svenson & Maule, 1993).
Although behavioural compliance is the gold measure, it is very difficult to assess and Virtual Reality (VR) has proven to be a reliable and useful tool to identify behavioural compliance (Duarte, Rebelo & Wogalter, 2010).
Prior studies used VR to evaluate which environmental features have influence on route selection in an emergency situation (Vilar, Rebelo, Noriega, Teles & Mayhor, 2013) and how that environmental variables, when used with signage, influences on route choices in everyday and emergency situations (Vilar, Rebelo, Noriega, Duarte & Mayhorn, 2014).
Once the scenario used in Duarte’s (2010) study, for evaluating behavioural compliance with warnings, has proved to be suitable, it was determined that in this study the same scenarios would be used, with only small changes, either in the experimental and pre-experimental training with virtual reality. As Duarte’s (2010) conclude in her work the compliance with dynamics signs is higher than the compliance with static signs and for this reason it was decided to use dynamics signs in an uncluttered environment (DUC) for this study.
1.1 Question in Study
2. Literature Review
2.1 WarningsSince the mid-1980s there has been a significant increase in research on safety communications, more specifically, warnings. Research was conducted by researchers from different fields, but a substantial portion of the research has been carried out by ergonomists (Laughery, 2006). That isn’t surprising because warnings are part of the interface for people using and maintaining a product or environment and such interfaces are in the domain of ergonomics.
Warnings can be defined as an advance notice of something. In safety, warnings are used as messages to inform people about hazards, and its objective is to prevent accidents, health problems, injury or damages. Understanding the best way to present warning information is a complex undertaking.
Through time there has been a large number of research studies which have helped to produce reasonable consensus in identifying the design principles for good warning signs (e.g., Wogalter, Conzola, & Smith-Jackson, 2002; Adams, Bochner & Bilik, 1998; Laughery, 2006) but, despite this work, some of the literature and empirical knowledge indicates that even well-designed signs are not totally effective. On his investigation DeJoy (1989) found warning compliance rates ranging from 17% to 37%. Even an apparently well-designed sign doesn’t raise compliance to 100%.
Nowadays, with all the technology we have at our disposal, we are able to develop more efficient warnings, making it possible to replace traditional visual signs or product labels for dynamic, audio and tactile ones to enhance risks communication (Wogalter & Mayhorn, 2005; Haas & Erp, 2014)
2.1.1. Warnings Vs Posted Signs
As this study is based on Duarte’s work (2010) we used the same classification to distinguish the different signs used in the virtual environment. The classification is present below:
“Warnings: Warnings, which were placed in the room area, contained explicit safety messages that provided information about a hazard and its consequences, as well as guidance on how to avoid the hazard. Warnings were the main target of the behavioural compliance evaluation. Both warnings and the scenario where they were embedded, were designed in a way that the participants could not expect them, as they were not pre-cued ahead of time by the task instructions that the participants carried out. Nevertheless they were placed coherently within the VR scenario.
Posted signs: The second type of safety information was posted signs. These posted signs had a different role than the warnings. They identified a safety device (e.g., a gas valve) and their contents were mentioned within the instructions given to participants on the tasks they were to perform, thus, the contents were pre-cued or expected prior to them being viewed in the VE. As a result, we expected to attain high values of compliance in such cases.
Finally, the exit signs were used to mark the routes of egress.”
(Duarte, 2010, p. 82)
2.2 Human process information
Understanding how people access, evaluate and process information is essential to do this research. There are many different theoretical approaches of risk perception, grounded in different bases (Riley, 2014):
a) Value- expectancy theory: Founded by Martin Fishbein in the 1970s, this theory states that behaviour is a function of the interaction between a person's expectancies about the outcome of actions and the value
they place on them (Wigfield, 1994).
b) Social learning theory: Developed by Bandura (1971) this theory states that people learn from one another, via observation, imitation and modelling.
c) Protection motivation theory: Developed by Rogers in 1975 this theory proposes that we protect ourselves based on four factors: the perceived severity of a threatening event, the perceived probability and vulnerability of the occurrence, the efficiency of the recommended preventive behaviour, and the perceived self-efficiency (Floyd &
Rogers, 2000).
d) Mental Models Methodology: This methodology was developed with the aim of understanding what judgment and decision processes people use to respond to a hazard (Bostrom, Fischhoff & Morgan, 1992).
e) Communication- Human Information Processing (C-HIP) Model: This model describes the route from attending to a warning and comply with it by assuming a certain behaviour. Derived from information-processing theories, the C-HIP model suggests that the receiver moves through several stages before adhering to the warning (Wogalter, Dejoy, & Laughery, 1999).
Several models have been proposed to help to understand which factors contribute to warning effectiveness (Conzola & Wogalter, 2001; Wogalter,
Conzola & Smith-Jackson, 2002) and two topics are common to the most of them - attention and behavior.
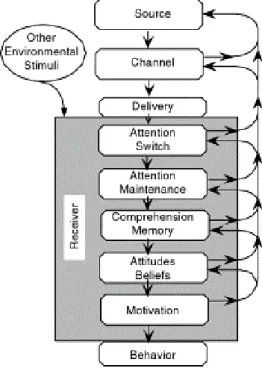
2.2.1 Communication- Human Information Processing (C-HIP) Model
The C-HIP model has been frequently used by researchers as a research framework about warnings (Conzola & Wogalter, 2001; Visscherst, Rutter, Kools, & Meertenst, 2004) This model helps to identify where, in the stages of processing, failure occurs, enabling the warning designer to focus on alternative designs that increase the likelihood of success.
Figure 2 - The C- HIP model (Karwowski, 2006)
The C-HIP model begins with a source delivering a warning to a receiver, through a channel, along with other environmental stimuli that may distract him from the message. The receiver goes through five information processing steps which,
The feedback loops shown on the right side of Figure 2 indicate that what happens at one stage can influence other stages. Thus, the processing of a warning message may be more complex than a simple flow of information through a linear sequence of stages (Laughery, 2006).
Next, each of the stages of the C–HIP model will be described.
The Source:
It is the originator or initial transmitter of the risk information. It can be a person or an entity (e.g., the government). Before the source actually transmits a warning there must be a recognized need for the warning.
The Channel
It concerns the way information is transmitted from the source to one or more receivers. There are two dimensions of the channel, one concerns the media in wich the information is embedded and the other to the sensory modality used by the receiver to capture the information.
The Receiver
The mental activities can be categorized into a sequence of information processing stages. In their article, Conzola and Wogalter (2001), explains that for a warning to effectively communicate information and influence behaviour, it must first cause attention to be switched to it and maintained long enough for the receiver to extract the necessary information from the warning. Next, the warning must be understood, and must concur with the receiver’s existing attitudes and beliefs. If it is in disagreement, the warning must be adequately persuasive to evoke an attitude change toward agreement. Finally, the warning should motivate the receiver to perform proper compliance behaviour. The stages of information processing that occur within the receiver will be described bellow:
a) Attention switch: An effective warning must initially attract attention.Generally this must occur in environments which also have other stimuli competing forattention. Since many industrial environments are cluttered, visual warnings must standout from the background in order to be noticed.
b) Attention maintenance: Individuals might notice the presence of a warning but not stop to examine it. A warning that is noticed but fails to maintain attention long enough for its content to be encoded is of little value.
c) Comprehension Memory: The message has to be well understood by the receiver. A warning message should give the receiver an appreciation of risks and enable informed judgment.
d) Belies and attitudes: Beliefs are the individual’s knowledge of a topic that are accepted as true. Attitudes are similar to beliefs but have greater emotional involvement.
e) Motivation: the motivation needed to do the desired behaviour. An important factor influencing motivation is the balance between the cost of complying with a warning and the cost of noncompliance.
f) Behaviour: Is the result of the mental activities of information processing stages. What we can see.
2.3 Compliance
Montgomery (2015), defines compliance as “(…) the performance of an action, or the termination of an action, at to a request.”
Warnings are developed with the aim of persuade people to do something in order to protect them from hazard, for example. We can see behaviour but we cannot see compliance, we assumed that if the behaviour is corrected there was compliance. But we need to know which factors affect compliance in order to developed better warnings.
2.4 Time Pressure
Time pressure can be defined as the difference between the amount of available time and the amount of time required to solve a task. (Rastegary & Landy, 1993) There isn’t a consensus about how time pressure affects performance.
Research on how time pressure affects performance has demonstrated clearly that time pressure increases the rate of individual and group performance (Karau & Kelly, 1992). However, results have been much less consistent on the quality of performance, with evidence of a positive relationship (Goodie & Crooks, 2004) a negative relationship (Moore & Tenney, 2012), a curvilinear relationship indicating an optimal level of moderate time pressure (Isenberg, 1981), and no relationship at all (Goodie & Crooks, 2004).
Recently there has been an increase in the number of studies on how time pressure affects decision making. Most of the studies conclude that under time pressure it is more likely that a poor decision is made (Hu, Wang, Pang, Xu, & Guo, 2015; Zakay & Wooler, 1984) Time pressure, also, promotes more risk seeking than under no time pressure (Hu, Wang, Pang, Xu & Guo, 2015; Madana, Spetch & Ludvig)
2.5. Hypothesis
According with the previous findings reported in the literature the following hypothesis were defined:
H1: In time pressure situations people have worse behavioural compliance than in a no time pressure situation.
3. Method
3.1. Experimental Design
The chosen methodology was a comparative study.
It was set out to compare the compliance of individuals when carrying out a work security verification routine in which, for the successful accomplishment of the intended task, some instructions and warnings should be taken in attention. At a given moment of the task, a fire started (hazardous situation) and participants had to leave the building as soon as possible. To leave the building they had to rely on exit signs located in the environment.
The “time pressure” group had as main gold accomplish the task in 4mins and 30 seconds. They were being informed on how much time they had every 5 seconds with an audio message. This audio message was previously recorded and inserted in the Virtual Environment (VE).
3.2. The session
After the participants had finish the training session, they took part in one of the two experimental conditions. Before starting the interaction with the virtual simulation, one cover story (Appendix I and Appendix II), depending on the experimental condition, was told with the purpose of introducing the task and the scenario to them.
In the VR simulation, the participants had to fulfill several tasks inside the VE, involving entering each one of the main four rooms in the following order: Meeting room, Laboratory, Food Processing Zone and Warehouse. In the VE, several warnings and posted signs were placed on the walls of the rooms. To facilitate the tasks, written instructions concerning safety warnings were left in each room, indicating what should be done.
The sequence of tasks was the one below:
1. The participants were told they should start the procedure by getting to the Meeting Room.
2. Inside the Meeting Room, the following instructions were displayed: “Check for Walkie-Talkies on top of the tables.If any is there take it with you. If not, please go to the laboratory and activate de security system.” 3. Switch on de fire detector near the exit door.
4. Do not activate the button at the entrance of the laboratory. 5. Inside the Laboratory, Sign 5 was present – “Security system”.
6. The instruction displayed inside this room was: “Now, go to the Food Processing Zone and switch the gas off”.
7. Outside the Food Processing Zone, close to the entrance door was Warning 3, which stated “Disinfection system, mandatory to warn before entering”.
8. Inside the Food Processing Zone, Sign 6 – “Shut-off gas” was present together with a button switch.
9. The instruction given was “After the gas is shut-off, go to the Warehouse
and cut the energy to the machine room”.
10. Outside the Warehouse, whose door was closed, was Warning 4, which stated: “Polluted atmosphere, start extractor before entering the room”. There was only one way to open the door, which was by pressing the button adjacent to the warning 4.
11. Inside the Warehouse was a button switch adjacent to Sign 7, which
stated: “Cut energy to machine room”. Since this was the last room, no
further instructions were given here.
12. After entering the warehouse, or 4:30 minutes after entering the corridors leading to the warehouse, a fire started in the Warehouse.
The entire experiment and the content of the warnings and posted signs, as well as all the experimental instructions (print and oral) were communicated in Portuguese.
3.3 Variables
The only variable manipulated was “time pressure” with two levels: high and low. The dependents variables were behavioural compliance and task time.
3.4. Participants
Fifty participants were recruited, 21 female and 29 male, aged 18 to 30 years old. The average age of all participants was 22 years old (SD= 3.28 years). Participants were unpaid volunteers and were recruited from the FMH campus. They were randomly divided into two groups - 27 performed the procedure with time pressure condition and 23 without time pressure condition.
3.5. Materials
3.5.1. Questionnaire
The questionnaire was applied at the end of the experiment with the objective of collecting demographic data, games and VR level of expertise, evaluate sensorial experience and the perception of hazard by each participant.
3.5.2. ErgoVR
ErgoVR is a Virtual Reality System developed at the Ergonomics Laboratory of FMH which allows the collection, visualization, measurement and analysis of data regarding human behaviour variables during the interaction with virtual environments, to be used mainly in Ergonomics for Design studies.
ErgoVR automatically collects behavioural interaction variables - trajectories, collisions, dislocation paths, etc (Teixeira, Rebelo & Filgueiras, 2010).
3.6 Equipment
In this research the following gear was used:
a) One desktop PC equipped with an Intel Quad-Core processor, 8 GB of RAM and a NVIDIA graphics card
b) Monitor HP (model L 1702) c) A joystick from Thrustmaster
d) Wireless stereo headphones from Sony®, model MDR-RF800RK e) A Targa DVD, model DRH-5000
f) An HMD from Sony® PLM-S700E
g) An AEE® wireless infrared video camera, model AT207
h) Two magnetic motion trackers from Ascension-Tech®, model Flock of Birds
3.7. Experiment Facilities
The study took place in the VR Unit of Ergonomics laboratory of the Faculty of Human Kinetics of Universidade de Lisboa. The area of the VR Unit was divided in two interconnected rooms, one used to introduce the study and complete the questionnaires (Room 1) and the other used for the VR equipment, where the participant interacted with the VE (Room 2). Room 2 remained with the door closed and the lights off during the entire interaction.
3.8. Virtual Environment
The virtual environment used was the same described by Duarte (2010) in her work but with some differences. Different warnings/posted signs, instead of
having a cafetaria there was a food processing zone and there wasn´t an explosion before the fire starting.
Like in Duarte’s study (2010) the VE layout (see Appendix III) were divided in to
big areas: the room area and the escape area.
The room area, was constitued by 4 rooms: a) meeting room; b) laboratory; c) food zone processing zone and d) warehouse. Each room had 12x12 meters size. To interconnect the rooms there were 2 symmetrical and perpendicular axescorridors, 2 meters wide. Another corridor circunvent the rooms and leaded to the escape rooutes area.
The escape routes area consist of a sequence of six corridors in a t-shaped format, in which only one of the options (right/left) provides access to the exit.
The triggers that activate the fire were positioned inside the warehouse and in surroundings.
The instructions given to the participants (see topic 3.10, page 31) assure, when correctly followed, the following rooms route:
1 – Meeting room; 2 – Laboratory;
3 – Food processing zone; 4 – Warehouse.
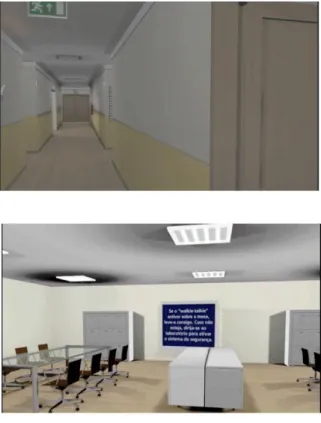
Figure 3 – Starting Point
Figure 4- Meeting room
Figure 5- Laboratory
3.9. Warnings, posted signs and exit signs used:
The warnings used in this study are presented below.
Figure 7- Warnings used in Virtual Environment
The posted signs used were the following ones.
The exit signs used were this:
Figure 9- Exit sign used in virtual environment
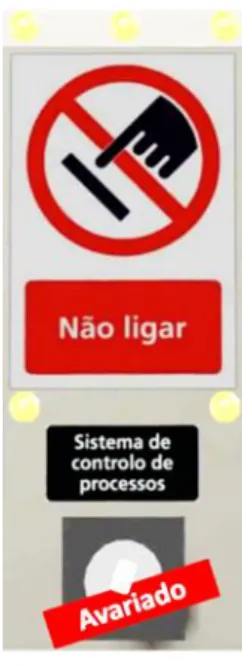
3.9.1. Ambiguous sign
In the real world nothing is linear and sometimes we face situations different from ours expectations and have to make decisions to solve the problem in hand. For this reason, in our study, we decided to place an ambiguous sign.
The sign, named “process control “had an “Out of order” label which configures a potentially ambiguous situation in reference to what is considered as compliance.
This sign wasn´t taken into consideration for the results but prior research reported that ambigous warning messages have worse compliance than non- ambigous warnings (Duarte, Rebelo, Teles & Noriega, 2012).
3.10. Instructions presented in VE
During the task the following instructions were presented.
Figure 11- Instructions
3.11. Procedure
The procedure was divided in three parts: 1) Training session
2) Experimental session 3) Questionnaire answering
Prior to the beginning of the training session, a brief explanation about the study was given to the participants whom, after this, were asked to read and sign an
informed consent form. After the training session the narrative was presented and the experimental session began. When the experiment was finished the questionnaire was presented for answering.
If after 4:30 min the participant steel in the room area, the audio message stopand the fire start at the corridor.
4. Results
The compliance assessment was accomplished in two separate, but subsequent, stages of the simulation – prior to the fire and following the fire.
4.1. Behavioural compliance
The first stage, which was intended to evaluate compliance with warnings/posted signs, took place when participants were requested to perform the routine security check. The data collected during this fase was collected by ErgoVR and presented in the following scores: (100% success = 3 pressed buttons).
4.1.2 Global compliance
Global compliance: is computed by combining the two compliance scores (“With Pressure” and “No Pressure”). It was measured by the number of times the participants pressed the buttons, as directed by the warnings and posted signs present in the rooms area of the VE (100% success = 6 pressed buttons).
Chart 1- Behavioural compliance for warnings and posted signs 0 10 20 30 40 50 60 70 80 90 100 No Pressure Pressure
As can be observed in
Chart 1 global compliance was higher in the “no Pressure Time Group” reaching 84.78% against 70.98% reached by “Pressure time“group.
To evalute if there was a significant difference between compliance, the Mann- Whitney U test - a non-parametric test for independent samples - was applied. Chart 1 presents the p-values. The black values are the significant ones. The p value for global compliance was 0.031 wich means there is a significant diference between the two experimental conditions. The p-value for warnings almost achieves significant diference - 0.058. The p value for Posted signs was 0.101 wich means there is no significant difference.
Table 1- Mann Whitney U results for warnings and posted signs
A X2 was applied to evaluate if there is a significant effect between each posted
signs and warnings. Individually considered, there was no significative difference in any one of them (p>0.05).
Chi-Square W1 W2 W3 PS1 PS2 PS3
χ2 2.853 2.339 0.206 1.624 2.362 0.869
p 0.091 0.126 0.65 0.203 0.124 0.351
Table 2- Chi-Square results for warnings and posted signs
Mann-Whitney U Global Warnings Posted
z -2.153 -1.894 -1.639
4.1.3 Compliance with warnings
Compliance with warnings: Is indicated by the number of times the participants pressed the buttons as directed by the three warnings presented (Fire detector; disinfection system; air extractor) in the simulation (100% success = 3 pressed buttons);
As can be observed in Chart 1 compliance with warnings was higher in the “no Pressure Time Group” reaching 81.15% against 64.43% reached by the “Pressure time “group.
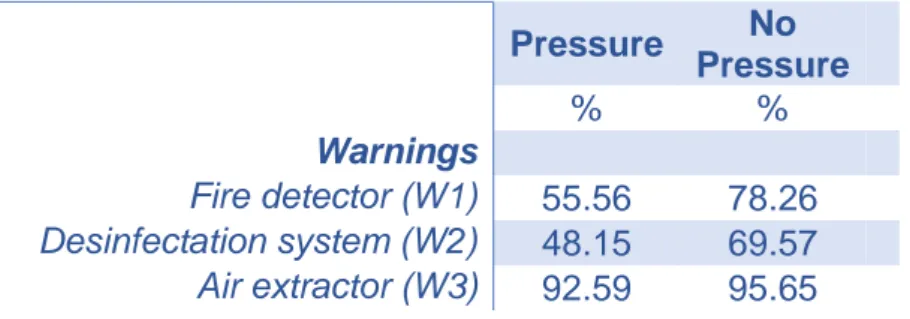
About compliance with warnings, presented in the Table 3 we can observe that in
the two first warnings, the percentage of compliance is much lower in pressure condition. Only in the third warning the percentages are very close (92.6% for pressure and 95.6% for no pressure) the reasons why this happen will be discussed in the next chaper.
Pressure No Pressure % % Warnings Fire detector (W1) 55.56 78.26 Desinfectation system (W2) 48.15 69.57 Air extractor (W3) 92.59 95.65
Table 3- Pressed Buttons by experimental conditions for warnings (%)
4.1.2 Compliance with Posted signs
Compliance with posted signs: is the number of times the participants pressed the buttons (security system; gas; energy), as directed by the three posted signs presented in the simulation (100% success = 3 pressed buttons);
As can be observed in Chart 1 compliance with posted signs was higher in the “No Pressure”group reaching 88.40% against 76.54% reached by “Pressure time“group.
About compliance with posted signs, presented in the
Table 4 we can observe that in the first posted sign (Security system), the percentage of compliance is lower in both conditions and in “pressure Time” it is only 51.85%. The last Posted Sign - Energy off button - the compliance is very high with 96.30% for “pressure time” condition and 100% “no pressure time”.
Table 4- Pressed Buttons by experimental conditions for posted signs (%)
4.1.2 Compliance with Exit Signs
The second stage, intended to evaluate compliance with exit signs, was made after the hazardous situation happened and was collected by the researcher, who watched the route choice decisions, through the observation of the recorded videos and are present in the following score.
Compliance with exit signs: Is the number of correct turns made after seeing the exit signal. This could be an indicator that the exit signs are being detected, recognized, and understood by participants.
As can be observed in Chart 2 global compliance with exit signs was slight higher
in the “no pressure time” conditional (100%) then in the “pressure time” condition
Pressure No Pressure % % Posted signs Security System (P1) 51.85 69.57 Gas Valve (P2) 81.48 95.65 Energy (P3) 96.30 100.00
To evalute if there is a significant difference between compliance the Mann-
Whitney U test was again applied. Table 5 presents the p-values. The p value for
global exit compliance was 0.187 wich means there is no significant diference
Chart 2- Compliance for Exit Signs
Table 5- Mann Whitney U for compliance with exit signs
A X2 was applied to evaluate if there is significant effect between in each posted
signs and warnings. Individually considered, there was no significative difference in any one of them (p>0.05).
Chi-Square Exit A Exit B Exit C Exit D Exit E
χ2 1.775 0.869 0.869 0.869 0.869
p 0.183 0.351 0.351 0.351 0.351
Table 6- Chi-Square results for exit signs 0 10 20 30 40 50 60 70 80 90 100 Global Exit
ExitA ExitB ExitC ExitD ExitE
No Pressure Pressure
Mann-Whitney U
z -1.319
4.2. Time
4.2.1 Time Spent
Task time “encompasses the period of time between the participants’ first displacement in the VE to the end of the simulation. The simulation ended when a participant reached the exit/end point or when it was aborted by the researcher (around 20 minutes after the beginning without getting close to the exit point); the total time of participants took to accomplish the task was also evaluated.” (Duarte, 2010, p. 132)
Average time for all participants was 355.88 seconds.
The mean time for the “Time Pressure “group was 365. 28 seconds and for the “No Pressure” group was 344. 85 seconds. A t-test for independent samples was made and no statistically significant difference was observed (t=0.755; p>0.1). The observation of chart 3, confirms that there is no difference between times for two groups, however the variability of the time results for the time pressure group is higher.
Chart 3- Boxplot for time spent
In Table 7 we can observe that minimum time to acomplish the task was achieved in “Pressure” condition (108.41 s) against 253.56s.
Pressure No pressure Max 564.10 526.84 Min 189.41 253.56 SD 108.99 71.05 Mean 365.28 344.85 Median 372.21 334.84
Table 7- Summary statistics of the time spent in the simulation (in seconds) by condition
4.2.2. Task time
Time pressure condition Chart 4- Boxplot time for task time
The mean time for the “Time Pressure “group was 243.43 seconds and for the “No Pressure” group was 249.20 seconds. A t-test for independent samples was made and no statistically significant difference was observed (t= 0.267; p>0.1). The observation of chart 4, confirms that there is no difference between times for two groups, however the variability of the time results for the time pressure group is higher.
In Table 8 we can observe that minimum time to acomplish the task was achieved in “Pressure” condition (82.21s) against 85.5s.
Pressure No pressure Max 404,16 383,04 Min 82,21 85,58 SD 83,08 64,71 Mean 243,43 249,21 Median 246,11 263,01
4.2.3. Egress time
Egress time is the time elapsed after entering in the escape routes area, encompasses the period of time the participants spent in the escape routes area.
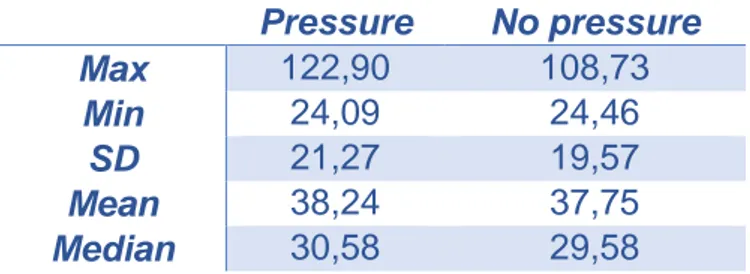
The mean time for the “Time Pressure “group was 38.24 seconds and for the “No Pressure” group was 37.75 seconds. A t-test for independent samples was made and no statistically significant difference was observed (t= 0.08; p>0.1). The observation of chart 5, confirms that there is no difference between times for two groups, however the variability of the time results for the time pressure group is higher.
In Table 9 we can observe that minimum time to acomplish the task was achieved in “Pressure” condition (82.21s) against 85.58s.
Table 9- Summary statistics of the egress time (in seconds) by condition
Pressure No pressure Max 122,90 108,73 Min 24,09 24,46 SD 21,27 19,57 Mean 38,24 37,75 Median 30,58 29,58
5. Discussion
The results confirmed hypothesis H1. H2 hypothesis is refuted by the results as participants with no pressure had a mean time lower than participants with pressure time. Time pressure affects negativly the compliance with warnings-. In general in a “no pressure” condition the participants had a better compliance with de warnings/posted sign.
Differences in compliance by experimental condition
In Table 1 it is observable that only global compliance presented statistical significative difference between time pressure condition and no time pressure conditions (z=-2.153; p<0.05).
As expected, the global condition was higher in the “no pressure” condition than in the “pressure condition”.
Differences in compliance with warnings, by experimental condition
In warnings compliance, the observable difference is almost significative (p=0.058). Maybe with a higher sample we could achieve a significant difference. Also, as the third warning - “Air Extractor” - by its nature, has a very high probability of compliance, whatever the experimental condition it is presented in. It is possible that a dilution of the differences in warning compliance could be obtained by measuring the three warnings.
Differences in compliance with posted signs, by experimental condition In
Chart 1 it is observable that in both experimental conditions the compliance with posted signs is higher than with warnings. This was excpectable accordind to Duarte’s results (Duarte, 2010) that show that in an unclutered environment dynamic posted signs have higher compliance than warnings The author concludes that warnings are more effective in a clutered environment.
Differences in compliance with exit signs, by experimental condition
The compliance with exit signs had almost the same level of compliance between
the experimental conditions, as we can observe in Chart 2. In the “no pressure
time” condition the compliance was always 100% and in the “pressure time” condition the lowest compliance was 92.59%. These high values probably could indicate that people in an emergency situation expect to see these signs.
Differences in time spent with warnings, by experimental condition
Participants with no pressure had a mean time lower than participants with pressure time.
The mean time for the “Time Pressure “group was 365.28 seconds, for “no
Pressure” group was 344.85s and for all the participants was 355.88s. Comparing the mean for all participants with the values of (Duarte, 2010) wich for DUC conditions was 458.4, it is observed that, even on a pressure time condition, the mean time to acomplish the task was lower.
The minimum time achived in the “pressure condition”, 189.41s, is much higher than the one achived in Duarte’s work (2010) (48.6s), but the maximium, 564.10s, achived in the “pressure condition” was lower than the one found in Duarte’s study (2010) (804.4s).
Differences in task time with warnings, by experimental condition
Participants with pressure had a mean time lower than participants with no pressure time.
The mean time for the “Time Pressure “group was 243,43s seconds, for “no Pressure” group was 249.21s.
The minimum time achived in the “pressure condition”, 82.21s, is much lower than the one achived in Duarte’s work (2010) (152.63s), but the maximium, 404.16, achived in the “pressure condition” was lower than the one found in
Differences in egress time with warnings, by experimental condition
Participants with no pressure had a mean time lower than participants with pressure time.
The mean time for the “Time Pressure “group was 38.24s seconds, for “no Pressure” group was 37.75s.
The minimum time achived in the “no pressure condition”, 24.46s, is much lower than the one achived in Duarte’s work (2010) (43.99s), and the maximium, 122.90, achived in the “pressure condition” was lower than the one found in Duarte’s study (2010) (319.74s).
Comparing the results obtained in this work with the results of Duarte’s work (2010) it is observed that the no pressure group has the same behaviou as the dinamic uncluttered used by Duarte and the pressure time group as a similar behaviour to the dinamic cluttered.
6. Conclusion
In the future it would be interesting to study if VR is a good help to test hazard perception.
Historically, VR technology has been expensive, available to few and mostly sought out by researchers and gaming technicians (Tomasz Mazuryk, 1996). The current state of VR as a tool for many different fields like pain managment, (Li, Montaño, Chen, & Gold, 2011) and for the treatment of anxiety disorders
(Gershon J, 2004), for example, proovedVR is valuable because it alows to study
situations that in real world can´t be studied due to ethical conditions.
New, cheaper and better gears are being developed, which can increase the immersivity in VE (Samsung, 2015) but also raises new questions in how these improvements affect human health and interaction.
The results of this study are important because they allow us to show that, in a time pressure situation, even well designed warnings/posted signs have a decreased compliance. Time pressure situations occur in everyday life - in work for example - and not only in emergency situations.
Other important result was in a time pressure situation the advantage of usind techonology is lost. This must be taken in consideration for the design of new enchanced warnings.
As a future research, it can be assessed whether the training in virtual reality, increases compliance with warnings.
In future it may interesting study the influence of workload and anxietty in behavioural compliance with warnings and how time pressure afects the compliance with warnings in cluttered and uncluttered enviromments.
With this work, another important step was given on studying the use of VR applications in emergency situations, being developed at the Ergonomics Laboratory of FMH.
7. References
Adams, A., Bochner, S. & Bilik, L. (1998). The effectiveness of warning signs in
hazardous work places: cognitive and social determinants. Applied ergonomics, 247-254.
Bostrom,Ann; Fischhoff, B. & Morgan, M. G. (1992). Characterizing Mental Models of Hazardous Processes: A Methodology and an Application to Randon. Journal of Social Issues, 48, 85-100.
Bandura, A. (1971). Social Learning Theory. New York City: General Leraning Press. Conzola, V. C. & Wogalter, M. (2001). A comunication- Human Information Processing
(C-HIP) approach to warning effectiveness in the workplace. Journal of Risk Research, 309-322.
DeJoy, D. M. (1989). Consumer product warnings review and analysis of effectiveness research. Proceedings of the 3rd Annual Meeting of the Human Factors Society (pp. 936-939). Santa Monica, CA, USA: Human Factors and Ergonomics Society.
Floyd, Donna L.;.D, S.P. & Rogers, R. W. (2000). A Meta-Analysis of Research on Protection Motivation Theory. Journal of Applied Social Psychology, 30, 407-429.
Duarte, E.; Rebelo, F. & Wogalter, M. S. (2010). Virtual Reality and its potential for evaluating warning compliance. Human Factors and Ergonomics in
Manufacturing & Service Industries, 20, 526-537.
Duarte, E., Rebelo, F.; Teles, J. & Noriega (2012). What should I do? – A study about conflicting and ambiguous warning messages. Work, 3633-3640 .
Duarte, M. E. (2010). Using virtual reality to assess behavioral compliance with warnings.
Vilar,E.; Rebelo, F.; Noriega, P.; Duarte, E. & Mayhorn, C. (2014). Effects of competing environmental variables and signage on route-choices in simulated everyday and emergency wayfinding situations. Ergonomics, 511-524.
Gershon J, A. P. (2004). Virtual reality exposure therapy in the treatment of anxiety disorders. Clinical psychology review, 259-281.
base-Haas, A. C. & Erp, J. B. (2014). Multimodal warnings to enhance risk communication and safety. Safety Science, 61, 29-35.
Hu, Y., Wang, D., Pang, K., Xu, G., & Guo, J. (2015). The effect of emotion and time pressure on risk decision-making. Journal of Risk Research, 637-650.
Waldemar Karwowski. (2006). International Encyclopedia of Ergonomics and Human Factors, Second Edition - 3 Volume Set. CRC Press.
Isenberg, D. J. (1981). Some effects of time-pressure on vertical structure and
decision-making accuracy in small groups. Organizational Behavior and Human Performance, 119-134.
Karau, S. & Kelly, J. (1992). The effects of time scarcity and time abundance on group performance quality and. Journal of Experimental Social Psychology,, 542-571. Laughery, K. (2006). Safety communications: Warnings. Applied Ergonomics, 37,
467-478.
Li, A.; Montaño, Z.; Chen, V. J. & Gold, a. J. (2011). Virtual reality and pain
management: current trends and future directions. Pain Management, 147-157. Madana, C. R.; Spetch, M. L., & Ludvig, E. A. (n.d.). Rapid makes risky: Time pressure
increases risk seeking in decisions from experience. Journal of Cognitive Psychology.
Montgomery, R. W. (2015, July 01). Compliance Training Techniques. Woodstock, GA, USA. Retrieved from behavior-consultant.
Moore, D. A. & Tenney, E. R. (2012). Time Pressure, Performance, and Productivity. In M. A. Neale, & E. A. Mannix, Looking Back, Moving Forward: A Review of Group and Team-Based Research (pp. 305-326). Emerald Group Publishing Limited.
Paul, B. K. & Stimers, M. (2012). Exploring probable reasons for record fatalities:the case of 2011 Joplin, Missouri, Tornado. Natural Hazards, 1511-1526.
Rastegary, H. & J.F., L. (1993). The Interactions among time urgency, uncertainty, and time pressure. In O. S. A. John Maule, Time Pressure and Stress in Human
Judgment and Decision Making (pp. 217–239). New York: SPRINGER
SCIENCE+BUSINESS MEDIA, LLC.
Riley, D. (2014). Mental models in warnings message design: A review and two case studies. Safety science, 61, 11-20.
Samsung. (2015, June 30). gear VR. Retrieved from oculus: https://www.oculus.com/en-us/gear-vr/
Svenson, O. & Maule, A. J. (1993). Time pressure and stress in human judgment and decision making. Springer US.
Teixeira, L.; Rebelo, F. & Filgueiras, E. (2010). Human Interaction Data Acquisition Software for Virtual Reality: A User- Centered Design Approach. In Advances in Cognitive Ergonomics (pp. 793-801). CRC Press.
Tomasz Mazuryk, M. G. (1996). Virtual Reality - History, Applications, Technology and Future . Vienna: Institute of Computer Graphics and Algorithms.
Vilar, E.; Rebelo, F.; Noriega, P.; Teles, J. & Mayhor, C. (2013). The influence of environmental features on route selection in an emergency situation. Applied Ergonomics, 618-627.
Visscherst, V. H.; Rutter, R. A.; Kools, M. & Meertenst, R. M. (2004). The effects of warnings and an educational brochure on computer working posture: a test of the C-HIP model in the context of RSI-relevant behaviour. Ergonomics, 1484-1498.
Wigfield, A. (1994). Expectancy-Value Theory of Achievement Motivation: A Developmental Perspective. Educational Pschology Review, 6, 49-78.
Wogalter, M. S. & Mayhorn, C. B. (2005). Providing cognitive support withtechnology-based warning systems. Ergonomics, 48, 522-533.
Wogalter, M. S.; Conzola, V. C. & Smith-Jackson, T. L. (2002). Research-based guidelines for warning design and evaluation. Applied Ergonomics, 219-230. Wogalter, M. S.; Dejoy, D. M. & Laughery, K. R. (1999). Organizing
theoreticalframework: a consolidated communication-human information processing (C-HIP). In M. S. Wogalter, D. M. Dejoy, & K. R. Laughery, Warnings and Risk Communication (pp. 15-23). London: Taylor &Francis. Zakay, D. & Wooler, S. (1984). Time pressure, training and decision effectiveness.
Cover Story: “No Time Pressure “Group
Are you ready to begin the simulation?
For your safety, I will be always present in the room, near you. No conversation between us can happen, thus, even if you talk with me I will not answer your questions. However, if you want to quit the simulation at any moment you just need to say so and I will stop the procedure. Please imagine the following situation:
You work as a security officer since one week ago at the “Company X” and you are in a trial period. Your supervisor requested you to replace a co-worker who had fallen sick. Thus, today, you are in a section of the building that is new to you, and which is composed by a number of rooms. Your supervisor will evaluate your work at the final of the trial period. According to the evaluation, you will continue working or your contract finishes.
We are at the end of the afternoon, the building is empty, and your task is to perform an end-of-day routine security check before closing down the work place for the night period.
To help you, your colleague left some written instructions, present in every room, posted on boards that will guide you and let you know the specific goals you are supposed to accomplish during the task. You need to understand the instructions because they will indicate you what to do and not to do.
To start the task you should go directly to the meeting room.
Can you, please, repeat which is your task and which is your first action? Do you realize what you are supposed to do?
Are you ready to start?
Cover Story: “Time Pressure “Group
Are you ready to begin the simulation?
For your safety, I will be always present in the room, near you. No conversation between us can happen, thus, even if you talk with me I will not answer your questions. However, if you want to quit the simulation at any moment you just need to say so and I will stop the procedure. Please imagine the following situation:
You work as a security officer since one week ago at the “Company X” and you are in a trial period. Your supervisor requested you to replace a co-worker who had fallen sick. Thus, today, you are in a section of the building that is new to you, and which is composed by a number of rooms. Your supervisor will evaluate your work at the final of the trial period. According to the evaluation, you will continue working or your contract finishes.
We are at the end of the afternoon, the building is empty, and your task is to perform an end-of-day routine security check before closing down the work place for the night period.
You have very limited time to do the routine security check.
In order to be able to keep your job, you have to accomplish the task in less time than other employees.
A beep will be heard every 30 seconds to inform you of the time.
To help you, your colleague left some written instructions, present in every room, posted on boards that will guide you and let you knowthe specific goals you are supposed to accomplish during the task. You need to understand the instructions because they will indicate you what to do and not to do.
To start the task you should go directly to the meeting room.
Can you, please, repeat which is your task and which is your first action? Do you realize what you are supposed to do?
Remember, the time is very important for your success. Are you ready to start?
The VE Layout