Roberto Sosa
Guillermo Artana
[email protected] Laboratorio de Fluidodinámica Universidad de Buenos Aires Buenos Aires, 1063 Argentina
Eric Moreau
Gérard Touchard
Laboratoire d’Etudes Aerodynamiques UMR 6609 CNRS University of Poitiers Futuroscope Cedex, 86022 France
Flow Control With EHD Actuators in
Middle Post Stall Regime
We analyze the modifications of the flow around a NACA 0015 airfoil when the flow is perturbed with an electrohydrodynamic (EHD) actuator. The device used consists of two bare electrodes flush mounted on the surface of the model operated in a discharge regime characterized by the formation of a plasma sheet contouring the body in the interelectrode space. In this study, we analyze the influence on the aerodynamic performance of the airfoil in the middle post stall regime (angle of attack≈20º). The analysis is undertaken with measurements of the surface pressure distribution and of the flow fields with Particle Image Velocimetry technique. The experiments indicate that at moderate Reynolds numbers (150,000<Re<333,000), the actuator enables a reattachment of the flow and reveals an important sensitivity of the middle post stall regime to periodic excitation.
Keywords: Flow control, EHD actuators, airfoil
Introduction
The separation of boundary layers of aerodynamic bodies like airfoils produces energy and lift losses. Flow control in this area has focused on the mitigation of these effects trying to prevent or to postpone the stall using either steady or periodic actuations.1
When using steady actuations, the purpose has been to impart additional momentum to the retarded fluid within the boundary layer and thus delay separation. The periodic actuations propose a cyclic momentum addition to fluid layers close to the airfoil surface. The actuation is performed taking into account the receptivity of the flow to excitations of its inherent instabilities (Huerre and Monkewitz, 1990), usually those of the separated shear layer (Kelvin-Helmholtz type). The objective is then to exploit the natural amplification of the periodic small perturbations in order to promote the entrainment of high speed fluid of the freestream to the regions of low velocity of the separated flow.
In this context, actuators with slots provided of internally mounted speakers/acoustic drivers, pistons, oscillatory-flow valve systems or piezoelectric based diaphragms and surface mounted actuators such as ribbons, fliperons, piezo-based benders and electromagnetic force actuators have been proposed and referenced in a recent thorough review (Greenblatt and Wygnanski, 2000).
The use of electrohydrodynamic (EHD) actuators has been proposed from some years ago. They produce an ionization of the flowing air and add localized momentum to the flow by the collisions process of migrating charged particles with the neutral species. Their name is based on the fact that currents involved are so low that the intensities of the magnetic forces are negligible compared to the electric ones. The main advantages of these actuators are that they have no moving part, a very short response time (delays in the establishment of a discharge are theoretically of the order of nanoseconds) and a relative good efficiency to transform electrical to mechanical energy (D’Adamo et al., 2002).
EHD actuators may be divided in three large groups: coronas based devices, dielectric barrier discharge devices and plasma sheet devices.
Presented at ETT 2004 – 4th Spring School on Transition and Turbulence September 27th
- October 1st
, 2004, Porto Alegre, RS, Brazil. Paper accepted: May, 2005. Technical Editor: Aristeu da Silveira Neto.
Coronas based devices use a self sustaining discharge based on an electric field configuration of strong inhomogeneity.
They comprise the use of at least one electrode having a very low radius of curvature that generally is a needle or a very thin wire. The electric field configuration sustained confines the ionization process to regions close to the high-field electrodes.
Thus, in this phenomenon there are active electrodes, surrounded by ionization regions where free charges are created and low-field regions where charged particles drift and react in their movement towards the passive electrodes of opposite sign.
These kinds of actuators may be effective to modify different flows (Bushnell 1983; Malik et al., 1983; Colver and El-Khabiry, 1999; Noger et al., 1997), but in general require important power consumption compared to other type of EHD actuators.
The devices with dielectric barrier use periodically excited electrodes, one exposed to the air while the other is encapsulated by a dielectric material (Roth and Sherman, 2000; Wilkinson 2003). The dielectric barrier interposed between both electrodes enables to stabilize the discharge avoiding the impact of the ions on the cathode and thus preventing the heating of it and the formation of new avalanches or breakdown from the electron secondary emission. Usual configurations consist on planar electrodes separated by a thin dielectric film disposed in an arrangement parallel to the spanwise direction of an aerodynamic surface. Excitations are in general in the range of some kHz and a diffuse light indicating an ionization process occurs at close vicinity of the air exposed electrode.
Plasma sheet devices use both electrodes air exposed mounted on an insulating surface. They are disposed flush mounted on the surface of a dielectric body with an interelectrode distance of some centimeters. The electrodes may be excited with a DC or with a periodic potential difference. The stabilization of the discharge is achieved by means of a careful finishing of electrodes (to impede the formation of spurious electric field concentration) and by means of the airflow that inhibit thermal instabilities that could lead to filamentation or arcs (Kunhardt 2000). In some cases also a third electrode may be added to the system to ameliorate the stability of the discharge (Louste et al., 2005).
The device produces a homogeneous luminescence that occupies the whole interelectrode space along the span and in this region the surface looks contoured by a thin film of ionized air (Artana et al., 2003).
airfoil is increased the actuation gives as result different flow configurations. In a previous article (Sosa et al., 2004) we have proposed to gather them in three groups or regimes: near post stall, middle post stall and deep post stall regimes.
In the intermediate regime (middle post stall) the fully separated flow when actuated changes to a flow configuration that may give rise to a separation bubble. The objective in this work is to compare for this regime the improvement of the aerodynamic performance of the airfoil when steady and cyclic actuations with a plasma sheet are considered. Our study is based on the analysis of flow fields obtained by Particle Image Velocimetry technique and on surface pressure distributions.
The airfoil NACA0015 considered has been selected in order to obtain results that facilitate the comparisons of the aerodynamic performance achieved with the EHD actuation with other kind of actuations extensively studied (Greenblatt and Wygnanski, 2000; Seifert et al., 1996).
Experimental Setup
Wind Tunnel and Models
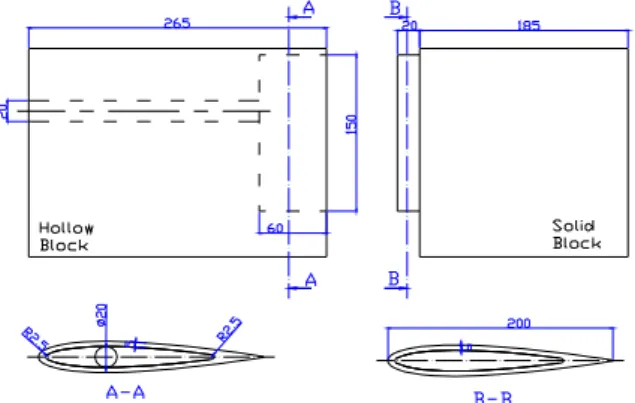
The measurements have been done in a wind tunnel loop of rectangular cross section (0.50 x 0.50 m2) that enables testing at flow velocities up to 30 m/s. The airfoil model was a NACA 0015 section shape of Polymethyl metacrylate (PMMA) (Figure (1)). The chord dimension (c) was 200 mm and the spanwise dimension was 450 mm. The airfoil has been fabricated in two separate parts (male and female) matched to obtain a hollow body. The fixation of the airfoil was performed on both ends through pieces of electrical insulating material (Nylon). In the test section, the angle of attack was manually varied and recorded in digital photographs to establish its value with accuracy better than 0.1°.
Larger descriptions of the wind tunnel characteristics and of the models may be found in previous reports (Artana et al. 2003). We have undertaken experiments in a velocity range of 10-25 m/s with an associated Reynolds number (Re=U0c/
ν
) comprised in the interval 1.3.105 < Re < 3.3 105. The airfoil was disposed with
different angles of attack corresponding to the middle post stall regimes (α ≈ 20º). At the flow conditions of our experiments
separation without reattachment and without hysteresis was observed for angles higher than 15º. The blockage ratio in the wind tunnel loop was about 8.6 and no correction for blockage effects has been applied to the data obtained.
EHD Excitation
Two plane parallel electrodes, consisting on strips of 3.5 mm width of thin aluminum foil (50 µm thick), were disposed flush mounted on the surface of the airfoil covering 85 % of the span. One of them was located at the leading edge position (x/c = 0) while the second one was at x/c = 0.18 on the suction side (extrados) of the airfoil. The ends of both electrodes were rounded to avoid large field concentrations in this region.
Figure 1. Scheme of the NACA0015 Airfoil Model. Model is made in PMMA.
Steady Excitation
For this kind of excitation two D.C. high voltage (HV) power supply (±40kV, 3.75 mA) of different polarity were considered. The positive one was connected to the electrode placed on the leading edge meanwhile the negative one imposed the voltage to the electrode placed downstream. The potential difference and the mean value of the discharge current were indicated by the HV power supplies with a precision of 0.1 kV and 10 µA respectively.
Periodic Excitation
In this case a high voltage power amplifier (0 to ±20 kV, ±20 mA , 20 kHz bandwidth) and a signal generator were used to impose a positive high voltage (HV) step function in the leading edge electrode while the potential of the downstream electrode was fixed by a negative DC high voltage power supply (-40kV, 3.75 mA). A HV probe enables the monitoring of the signal delivered by the sources.
The discharge current was measured with the help of an AC current transformer (20 mA, precision lower than 3 µA, bandwidth of 10 kHz) connected to an oscilloscope. The current transformer is of the inductive type and consists on a toroidal sensor with inner diameter of 28 mm placed around the AC HV cable.
Power and Momentum Addition to the Flow
The power added to the flow as a consequence of actuation may be expressed by mean of the non dimensional power coefficient or reduced power coefficient CW defined by
c L b U 5 . 0
W
C 3 ele
0 W
δ ρ
= (1)
where Lele is the inter-electrode distance, b the electrode length, δ
the thickness of the plasma sheet, U0 the free-stream velocity and c
the airfoil cord. The parameter W is the power of the discharge and may be easily calculated as the product of the discharge current I and the applied voltage difference between electrodes ∆V.
Other researchers (Greenblatt and Wygnanski, 2000) have preferred an analysis based on momentum addition coefficients that for this kind of actuator may be estimated with a non dimensional parameter C defined as
c U 5 . 0
L
C 2
0 ele el ρ τ
where τel is the electric force per unit area produced by the
discharge. Previous research (D’Adamo et al., 2002) undertaken with steady actuations of flows around flat plates has indicated that typical values of C were about 0.015 but a dependency of these values on the velocity of the airtsream over the discharge has also been observed. In this estimation the alterations of fluid properties by ionization of the gas has been disregarded. The determination of this coefficient cannot be directly extrapolated to situations under periodic excitation and is at present under study.
Velocity Field Measurements
The velocity field was measured using a Particle Image Velocimetry (PIV) technique. The tracers were produced by a smoke generator producing droplets of a pure cosmetic grade oil of a mean size about 0.3 m. The system was illuminated with a laser sheet produced by a Yag laser of 200 mJ. Each pulse had duration of 0.01 microseconds and the time between the pair of pulses was, depending on the experiment, in the range of 20-50 s. A progressive scan interline camera capable of producing images of 1,280 pixels × 1,024 pixels was used.
PIV Data Processing
Treatment of the recorded images was undertaken with commercial PIV software enabling the use of an adaptive correlation technique to obtain the vector fields. In this treatment we have considered 2 refinement steps and the final interrogation area size was of (16 x 16) pixels2 with an overlap of 50%.
Each velocity field was filtered with both, a peak-validation and a range validation filter. Peak validation filter is based on the detectability criterion (Keane and Adrian, 1992) that validates vectors with a ratio of the highest peak to the second highest peak in the correlation plane larger than a fixed value (1.2 in our case). The range validation filter enables to establish the range admitted for the modulus of the velocity vectors. In our case, we have considered a maximum value of 3 times of the flow velocity U0 as the upper
limit.
Six hundred pairs of digital images taken at pairs every 0.1 s were examined in each experiment. The mean velocity fields of the airflow use in the next paragraphs were obtained by averaging the six hundred instantaneous flow fields. Convergence of the time averaged values towards the mean value has been tested considering lower intervals and is largely assured with our experimental conditions.
Particle Tracking
In PIV experiments the velocity of the tracers and those of the fluid particles surrounding them must agree. If slipping occurs, then the seeding particles “swim” in the moving media and the information obtained must then be carefully examined. In our experiments, the seeding was produced with the smoke generator operated to obtain a cloud with a mean particle diameter of 0.3 µm. As analyzed in a previous article (Artana et al., 2002) the influence of coulombian forces on tracers trajectories, when using seeding particles of this size, can be disregarded without introducing a significant error.
Uncertainty of Flow Field Measurements
The system resolution for distances can be estimated as the product of the pixel resolution (a very conservative values is 1/4 pix) and the pixel size. In that way, the resolution of the velocity field can be estimated dividing the latter value by the time between
the pair of pulses (∆ t = 20 s). In our case the pixel size (ps) varied
from about 0.09 10-3 to 0.2 10-3 m/pixel, leading to a very conservative value of uncertainty for the velocity (∆ v) of:
s / m 125 . 1 (sec) t 1 ) pixel / m ( ps ) pixel ( 4 1
v≤ ⋅ ≅
∆
∆ (3)
Pressure Measurements
To undertake surface pressure distribution experiments 30 pressure ports were drilled at the half of the span location of the airfoil. The pressure tapping hole diameter was of 1.5 mm. Electrical insulating tubes of Tygon (internal diameter = 0.5 mm) carried the pressure from the ports to a set of 30 independent solid state sensors (ion-implanted piezoresistive strain gage) whose output was connected to a data acquisition system. The tubings were inserted in the holes, passed through the hollow of the airfoil and came out through the support of one end of the model.
The free stream velocity U0 was measured with a Pitot tube
positioned at the entrance of the test section and connected to a micromanometer. The static pressure from this probe was also used as a reference pressure P0 of the free air stream. In this work we will
make use of a coefficient Cp defined as
2 0 0 i U . 5 . 0 P P Cp ρ − = (4)
being Pi the surface pressure at station i and ρ the gas density.
Uncertainty Analysis of Pressure Measurements
When separation takes place, the surface pressure at the different ports is non steady and the pressure detected by the sensor is not the real surface pressure as this magnitude is dampened by the system of pressure transmission (Bergh and Tijdeman 1965). In general, to obtain the effective instantaneous value of the surface pressure from the measured value, a reconstruction of the signal considering the gain for the different frequencies of the tube-transducer system is required. The mean value of the pressure may however be easily obtained without any reconstruction by the direct measurement of the fluctuating surface pressure and considering an adequate time of integration. If the interval T of measurement is much longer than the characteristic time of the flow fluctuations the convergence to the mean value is assured. In our case, the characteristic time may be roughly estimated considering a Strouhal number (defined as: St = (f.c)/U0 , with f the vortex shedding
frequency) about a value of 0.2 (Roshko 1954). Our experiments have been performed by acquiring the surface pressure at times larger than seconds, a lapse that in the more adverse situations exceeded in more than one order of magnitude those characterizing the dynamics of vortex shedding.
The Coefficients of Lift and of Drag Pressure
The coefficient of lift Cl and drag pressure CDp are estimated by
integration of the CP distributions around the airfoil.
dl . sen . ) , t , l ( C c 1 ) , t (
Cl α = ∫ p α θ (5)
dl . cos . ) , t , l ( C c 1 ) , t (
CDp α = ∫ p α θ (6)
the free stream flow direction and α is the angle of attack of the airfoil.
In this work, the time averaged value of the coefficient Cp has also been estimated with the same considerations about the time of integration T than those for surface pressure:
= T∫ 0
p Cp(l,t, )dt T
1 ) , l (
C α α (7)
In next sections we make also use of the coefficients Cl (α) and
CDp(α) defined by
C (l, ).sen .dl c
1 ) (
Cl α = ∫ p α θ (8)
( )
C (l, ).cos .dl c1
CDpα = ∫ p α θ (9)
where these integrals are calculated with the time averaged values of Cp
Uncertainty Analysis of Lift and Drag Pressure Coefficients
The equivalence between Cl(α) and the time averaged values
) (
Cl α and of the coefficient CDp(α) with CDP(α)
= T∫
0 l
l C(t, )dt
T 1 ) (
C α α (10)
∫
= T
0 Dp
DP C (t, )dt
T 1 ) (
C α α (11)
is assured only if a concordance of phase between the pressures values at the different measurement points is verified. Such concordance (temporal problem) was not tested in the present report. Also as a consequence of the geometry of the model there is a region towards the trailing edge (x/c >0.78) where it was not possible to dispose pressure probes and the pressure distribution there remains undetermined. Owing to this spatial problem, the coefficients Cl(α) and CDp(α) may be calculated only with integral
over coordinates that ignore the fluid dynamics of regions that are quite close to the trailing edges. For these two reasons (spatial and temporal problems) it is not adequate to directly extrapolate values of the mean lift force and drag pressure force experienced by the airfoil from the parameters Cl(α) and CDp(α) of our tests. However,
these coefficients may give a fruitful data and result a useful tool to compare the aerodynamic performance of the airfoil in the presence or in absence of the discharge.
Experimental Results
Surface Pressure Distributions and Time Averaged Flow Fields
We analyze in this paragraph results of the mean pressure distribution on the surface and of the time averaged values of the flow fields in the absence or in the presence of the actuation. As a reference for the analysis of the experimental results, the experimental data are represented in graphs accompanied by the pressure distribution corresponding to a theoretical inviscid flow obtained from the formulation of Theodersen (1934).
Steady Excitation
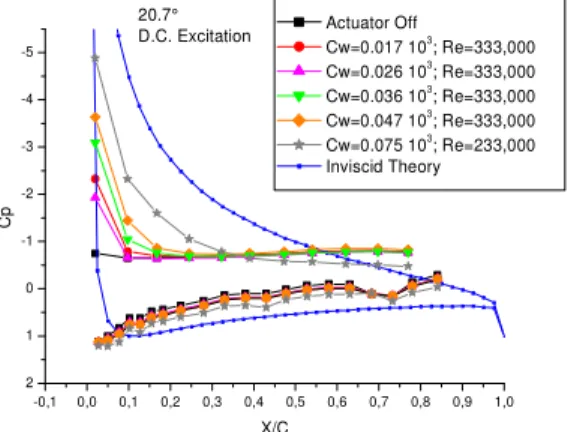
We observe results concerning pressure distributions at different Reynolds number and with different non-dimensional power coefficients in Fig. (2).
With no actuation the airfoil is in a stall regime and a wake is produced. The figure 2 reveals that actuation produces changes in the intrados and extrados pressure.
The mass flowing through a plane normal to the flow direction of the free airstream placed at the trailing edge is in any case the same for a fixed fan velocity.
The velocity profile in this section is non uniform, and if by any cause a zone of retarded or accelerated flow develops in the velocity profile a redistribution of velocities in this section occurs to compensate the deficit or excess of mass flow produced. The new velocity distribution alters the velocity field not only in this section but also in regions upstream and downstream it.
When a wake develops in correspondence with the wake region the velocity profile is retarded compared to the condition with absence of wake: The deficit of velocity produced is compensated by an increase of the velocity of other regions out of the wake and the flow redistribution produced alters also upstream regions as those of the lower part of the airfoil. When the flow becomes fully (or partially) reattached, the wake disappears (or diminishes its wideness) and the flow in regions, like the intrados, has lower velocities as the retarded zone has disappeared (or diminished its size).
Our results indicate that on the intrados the actuation increases at all points the value of the pressure. These results indicate a decrease of the velocity on this side and that when the flow is actuated a postponement of separation occurs. However, the effect of an increase of actuation power for the same flow is not quite clear on this side (actuated curves for Re = 3.33 105 are almost coincident).
If we analyze the extrados, we observe that there exists a constant pressure region of pressure corresponding to a fully separated flow when actuation is absent. This constant pressure region may change drastically when actuation is activated. An important suction towards the leading edge can be observed which indicates that separation is postponed in agreement with lower surface pressure analysis.
The upper side pressure distribution is more explicit about the influence of the power than the lower one. As the coefficient CWis
increased higher suction peaks are observed. Moreover at the highest values of CW, the pressure recovery towards the trailing edge
and the gradual recovery indicate that the separation line has moved towards the trailing edge as the pressure distribution corresponds to an almost fully attached flow.
-0,1 0,0 0,1 0,2 0,3 0,4 0,5 0,6 0,7 0,8 0,9 1,0 2
1 0 -1 -2 -3 -4 -5
20.7° D.C. Excitation
C
p
X/C
Actuator Off Cw=0.017 103
; Re=333,000 Cw=0.026 103
; Re=333,000 Cw=0.036 103
; Re=333,000 Cw=0.047 103
; Re=333,000 Cw=0.075 103
; Re=233,000 Inviscid Theory
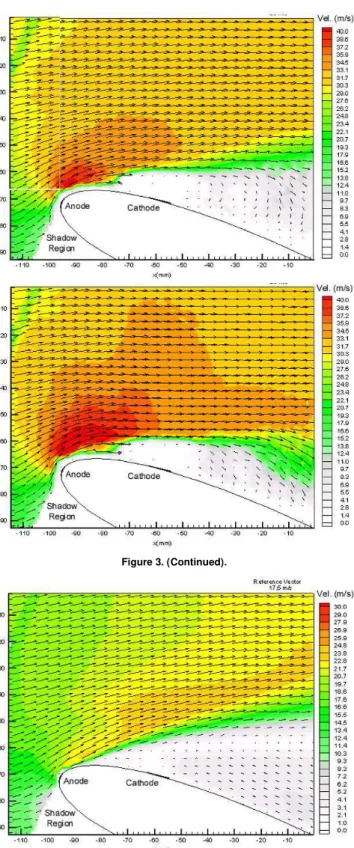
The time averaged flow fields and the contour plot of its module are shown in Fig. (3) and Fig. (4).
For the case actuation off (Fig. (3a)-Fig. (4a)) the flow is fully separated from the leading edge. As actuation is applied the flow separation is postponed and a perturbed zone in the region close to the downstream electrode (cathode) appears.
The flow contours this perturbed region, which is in some sense similar to a separation bubble, and then reattaches downstream.
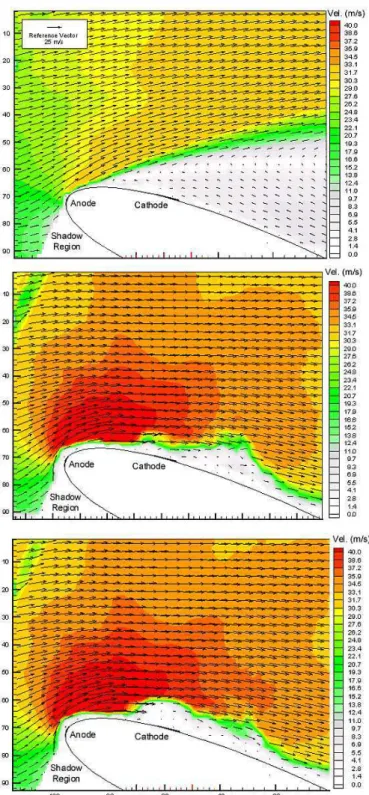
The size of this zone becomes more reduced as the reduced power increases and for very large values of the reduced power (Figure 4b) this region is no longer detectable.
Figure 3. Time averaged flow fields with associated contour plots. Steady actuation, Angle of attack 20.7º, Re= 3.33 105, Figure 3a (top left ): Actuator off, CW =0.0, Figure 3b (top right): CW =0.026 10
3
, Figure 3c (bottom left): CW =0.036 103, Figure 3d (bottom right): CW =0.047 103.
Figure 3. (Continued).
Figure 4. Time averaged flow fields with associated contour plots. Steady actuation, Angle of attack 20,7º, Re= 2.3 105 . Figure 4a (top left): Actuator off, CW =0.0, Figure 4b (top right): Actuator on, CW =0.075 10
Figure 4. (Continued).
Periodic Excitation
Previous research works with other kind of actuators (Wygnanski 1997), indicate that the effect of cyclic actuation is more clearly manifested for low levels of actuation. As a consequence the periodic excitation tests were conducted with low values of the reduced power (CW < 10) and the effect of the
frequency of actuation (fexc) on the flow is analyzed in terms of a
reduced frequency F+
0 exc U c f
F+= (12)
Figure (5) brings out the difference of behavior of the actuated flow. If we consider the intrados pressure distribution, we observe that excitation with frequencies in the lower range (F+<1) enable to
increase the values of pressure on this side where curves have a more marked trend to the inviscid behavior. This, as in steady excitation, is associated to a reduction of the deficit of velocity downstream the body.
The adjustment of the value of the frequency of excitation also produces changes in the upper surface pressure distribution. Excitations in the low frequency range produce a pressure recovery in agreement with a highly attached flow. However, for the high frequencies range the actuator seems to be less effective to improve the pressure recovery towards the trailing edge.
0,0 0,2 0,4 0,6 0,8 1,0
2 1 0 -1 -2 -3 -4 -5
Periodic Excitation 20.7° 25.0m/s
C
p
x/C
Actuator off (Baseline)
F+
=0.008 F+
=0.04 F+
=0.8 F+
=1.6 Inviscid Theory
Figure 5. Surface Pressure Distribution. Periodic Excitation, Angle of attack 20.7º, Re= 3.33 105, CW = 8.9.
The time averaged flow fields and the contour plot of its module are shown in Fig. (6).The non-actuated flow is drastically altered by actuation. The actuated flow shows a perturbed zone in the region close to the downstream electrode (cathode) followed by a reattachment downstream. The size of the perturbed zone becomes ampler for the high frequency range but it does not produce an alteration of the flow capable of being detected by the pressure distribution tests.
Figure 6. Time averaged flow fields with associated contour plots.Periodic actuation. Angle of attack 20.7º, Re= 3.33 105, Figure 6a (top): Actuator off, CW=0.0, Figure 6b: Actuator on, CW =8.9, F+=0.008, Figure 6c: CW=8.9, F+=0.08, Figure 6d (bottom): CW =8.9, F
Figure 6. (Continued).
Discussion
Lift and Drag Pressure Coefficients
In previous sections we have observed that there exists an influence of the reduced power and of the reduced frequency on the reattachment process. The analysis of the lift and drag pressure coefficients as a function of these parameters enable in some sense to better highlight this dependency and this is the purpose of this section.
The discussion is proposed by mean of the analysis of the lift coefficient differences Cl (actuation on minus actuation off) and of
the difference of the ratio (Cl/CDp) (actuation on minus actuation
off). This analysis enables also a global comparison of the effectiveness of the steady and periodic excitation of the flow.
Steady Excitation
Table 1 makes evident the influence of the reduced power in the aerodynamic performance of the airfoil, where increases of lift coefficient and improvement of the ratio Cl/CDp take place keeping
constant the Reynolds number and modifying the power of the actuator. This may be associated to the fact that the EHD actuation produce a flow situation with a perturbed region in the proximity of the surface (separation bubble) followed by a reattachment of the
flow when actuation is operated. The size of this region is diminished as the reduced power of actuation is increased and even at high enough values of CW an almost full reattachment of the flow
is achieved, having the important consequences on the values of Cl
and Cl/CDp observed.
Periodic Excitation
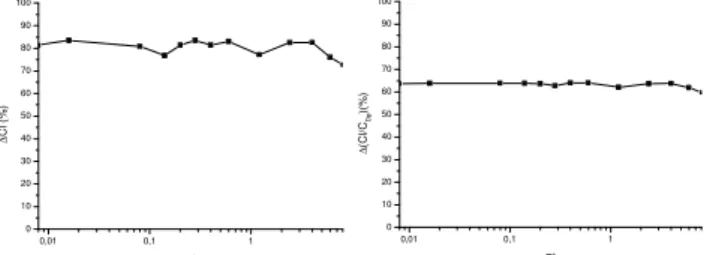
The behavior with this excitation is illustrated in Fig (7). The cyclic excitation highly improves the lift coefficient and the ratio Cl/CDp with a slight degradation of this effect towards the larger
reduced frequencies. The PIV tests have shown that the size of the bubble increases as the frequency of excitation approaches the higher values. This bubble could modify substantially the airfoil performance, but only a slight degradation of the airfoil performance is observed for this range of frequencies probably as a consequence that in all cases the periodic excitations give rise to bubbles of reduced size. A comparison with steady excitations clarifies the sensitivity of this regime to periodic excitation. The values of Table 1 indicates that the periodic excitation actuator performance (which improvements regarding the Cl and Cl/CDp
coefficients are showed in Figure 7) are not achieved by steady excitation even supplying values of power one order of magnitude larger than the one supplied in the periodic actuation tests. For similar values of Cw the sizes attained by the bubbles on the actuated
flow with steady excitation are larger than those of periodic excitation (compare Figures 3 with Figures 6).
The detrimental effect of this bubble reveals for steady excitation but with periodic excitation does not attain a size significant enough to finally diminish the airfoil performance.
0,01 0,1 1
0 10 20 30 40 50 60 70 80 90 100
20.7º Re=333.000 Cw=0.009
∆
C
l
(%
)
F+
0,01 0,1 1
0 10 20 30 40 50 60 70 80 90 100
20.7º Re=333.000 Cw=0.009
∆
(C
l/
CDp
)(
%
)
F+
Figure 7. Difference on coefficients of aerodynamic performance as a consequence of actuation at different frequencies of excitation. Angle of attack 20.7º, Re=3.33 105, CW=8.9. Figure 7a (top): Difference of the coefficients Cl, Figure 7b (bottom): Difference of the ratio Cl/CDp, For the cases actuator off the values of the coefficients (Cl;Cl/CDp) are(0.65;2.33).
Table 1. Difference on coefficients of aerodynamic performance as a consequence of actuation with a DC excitation.
α
(º) Re 10-5
CW 10
-3
(Cl)off
✁
Cl ✁
Cl (%) (Cl/CDp)off
✁
(Cl/CDp)
✁
(Cl/CDp)(%)
20.7 3.33 0.017 0.65 0.08 19.0 2.33 0.38 16.3
20.7 3.33 0.026 0.65 0.13 11.6 2.33 0.27 11.8
20.7 3.33 0.036 0.65 0.19 28.6 2.33 0.60 25.8
20.7 3.33 0.047 0.65 0.28 42.5 2.33 0.75 32.2
20.7 2.30 0.075 0.60 0.40 68.8 2.29 1.06 48.6
Conclusions
We showed in this article that with EHD actuation it is possible to prevent or postpone stall in an airfoil in flows with Re≈105 and angles of attack overcoming the steady stall angle in about 6º.
In the flow regime considered the actuation postpones stall but may give rise to a flow configuration with a perturbed region, similar to a recirculation bubble. The size of this perturbed region
may be altered by a suitable adjustment of the frequency of excitation or of the power supplied to the actuator.
In general, for a fixed value of power the high frequency range (F+>2) proofed to be slightly less effective to improve the aerodynamic performance of the airfoil than the low range (F+<1).
These results encourage the study of periodic excitation as a mean of improving efficiency in actuation with EHD in flows with separation.
Acknowledgments
This research has been done with grants UBACYT I003 and PICT 12-09482 of the Argentine government. We thank the University of Poitiers for inviting Prof. G. Artana to the Laboratoire d’Etudes Aerodynamiques during January and February of 2003 when experiments were performed.
References
Artana G., D'adamo J., Leger L., Moreau E., Touchard G., 2002, Flow control with electrohydrodynamic actuators, AIAA Journal, Vol.40, n.9, pp 1773-1779.
Artana G.; Sosa R., Moreau E.; Touchard G., 2003, “Control of the near wake flow around a circular cylinder with electrohydrodynamic actuators”, Experiments in Fluids, Vol. 36, n.6, pp 580-588.
Bergh H., Tijdeman H., 1965, “Theoretical and experimental results for the dynamic response of pressure measuring systems”, National Aero and Astronautical Research Institute, Amsterdam, NLR report F.238.
Bushnell D., 1983, “Turbulent Drag Reduction for External Flows”, AIAA paper No 83-0227.
Colver G. and El-Khabiry S., 1999, “Modeling of DC Corona Discharge Along an Electrically Conductive Flat Plate with Gas Flow”, IEEE Trans on Industry Appl., Vol. 35, n. 2, pp. 387-394.
D’Adamo J., Artana G., Moreau E., Touchard G., 2002, ”Control of the airflow close to a flat plate with electrohydrodynamic actuators”, ASME Paper Nº 2002-31041.
Greenblatt D., Wygnanski I., 2000, “The control of flow separation by periodic excitation”, Progr. Aerosp. Sci., Vol. 36, pp 487-545.
Huerre P. and Monkewitz P., 1990, “Local and global instabilities in spatially developing flows”, Annu. Rev. Fluid Mech. Vol. 22, pp 473-537.
Keane R. and Adrian R., 1992, “Theory of Cross Correlation Analysis of PIV Images”, Applied Scientific Research, Vol. 49, pp. 191-215.
Kunhardt E., 2000, Generation of large volume atmospheric pressure non –equilibrium plasmas, IEEE Transactions on Instrumentation and measurements, Vol.28, n.1, pp 189-200.
Louste C., Artana G., Moreau E., Touchard G., 2005, “Sliding discharge in air at atmospheric pressure : electrical properties”, J. of Electrostatics, Vol.63, pp 615-620.
Malik M., Weinstein L., Hussaini M., 1983, “Ion Wind Drag Reduction”, AIAA paper No 83-0231.
Noger C., Chang J. S., Touchard G., 1997, “Active Controls of Electrohydrodynamically Induced Secondary Flow in Corona Discharge Reactor” Proc. 2nd Int’l Symp Plasma Techn. Polution Cont, Bahia, pp.136-141.
Roshko A., 1954, “On the drag and shedding frequencies of two dimensional bluff bodies”, NACA TM 3169, 61, 118.
Roth J. R. and Sherman D., 2000, “Electrohydrodynamic flow control with a glow discharge surface plasma”, AIAA Journal, Vol.38, n.7, pp 1166-1178.
Seifert A., Darabi A., Wygnanski I., 1996, “Delay of airfoil stall by periodic excitation”, Journal of Aircraft, Vol.33, n.4, pp 691-698.
Sosa R., Moreau E., Touchard G, Artana G., 2004, “Stall control of airfoils at high angle of attack with periodically excited EHD actuators”, AIAA Paper Nº 2004-2738.
Theodersen T., 1934, “General potential theory of arbitrary wing sections”, NACA R-452.
Wilkinson S. P., 2003, “Investigation of an Oscillating Surface Plasma for Turbulent Drag Reduction”,. AIAA Paper Nº 2003-1023.