“main” — 2012/8/30 — 18:43 — page 147 — #1
Revista Brasileira de Geof´ısica (2012) 30(2): 147-157 © 2012 Sociedade Brasileira de Geof´ısica ISSN 0102-261X
www.scielo.br/rbg
COMBINING NOISE-ADJUSTED PRINCIPAL COMPONENTS TRANSFORM
AND MEDIAN FILTER TECHNIQUES FOR DENOISING MODIS TEMPORAL SIGNATURES
Osmar Ab´ılio de Carvalho J´unior
1, Nilton Correia da Silva
2, Ana Paula Ferreira de Carvalho
1,
Antˆonio Felipe Couto J´unior
1, Cristiano Rosa Silva
1, Yosio Edemir Shimabukuro
3,
Renato Fontes Guimar˜aes
1and Roberto Arnaldo Trancoso Gomes
1Recebido em 18 outubro, 2010 / Aceito em 8 maio, 2012 Received on October 18, 2010 / Accepted on May 8, 2012
ABSTRACT.Consistent multi-temporal images are necessary for accurate landscape change detection and temporal signatures analysis. Orbital images have a difficulty to maintain a temporal information precision due to several interferences that generate missing data. In this paper is developed a program in C++language for denoising
MODIS temporal signatures considering two-phase scheme for removing impulse and white noise. In the first phase, the median filter is used to identify impulse noise. In the second phase, the Noise-Adjusted Principal Components (NAPC) transform is applied to eliminate white noise. Because they are two complementary methods, there is high performance in removing noise. The restored NDVI (Normalized Difference Vegetation Index) signatures showed a significant improvement providing a time series dataset that can be used to identify and classify the vegetation physiognomic types.
Keywords: NDVI temporal signature, MODIS, digital image processing, noise, MNF.
RESUMO.Imagens multitemporais consistentes s˜ao necess´arias para uma acurada detecc¸˜ao de mudanc¸a e an´alise de assinaturas temporais. Imagens orbitais apresentam dificuldades para manter a precis˜ao das informac¸˜oes temporais devido a v´arias interferˆencias que geram perda de dados. Neste trabalho ´e desenvolvido um programa na linguagem C++considerando duas etapas para a remoc¸˜ao do ru´ıdo de impulso e branco. Na primeira etapa, um filtro de mediana ´e usado para identificar
o ru´ıdo de impulso. Na segunda etapa, a transformac¸˜ao NAPC (Noise-Adjusted Principal Components) ´e aplicada para eliminar o ru´ıdo branco. Por serem os dois m´etodos complementares observa-se um alto desempenho na remoc¸˜ao de ru´ıdo. As assinaturas temporais NDVI (Normalized Difference Vegetation Index) restauradas mostraram uma melhoria significativa, fornecendo um conjunto de dados de s´eries temporais que podem ser usadas para identificar e classificar os tipos fisionˆomicos da vegetac¸˜ao.
Palavras-chave: assinatura temporal NDVI, MODIS, processamento digital de imagem, ru´ıdo, MNF.
1Laborat´orio de Sistemas de Informac¸˜oes Espaciais (LSIE), Universidade de Bras´ılia (UnB), Campus Universit´ario Darcy Ribeiro, Asa Norte, Bloco A, Sala ASS 660/10, 70910-900 Bras´ılia, DF, Brazil. Phone: +55 (61) 3307-2474 – E-mails: [email protected]; [email protected]; [email protected]; [email protected]; [email protected]; [email protected]
2Departamento de Ciˆencia da Computac¸˜ao, Centro Universit´ario de An´apolis (Unievang´elica), Avenida Universit´aria km 3.5, Cidade Universit´aria, 75070-290 An´apolis, GO, Brazil. Phone: +55 (62) 3315-6658 – E-mail: [email protected]
3Divis˜ao de Sensoriamento Remoto (DSR), Instituto Nacional de Pesquisas Espaciais (INPE), Avenida dos Astronautas, 1.758, Jd. Granja, 12227-010 S˜ao Jos´e dos Campos, SP, Brazil. Phone: +55 (12) 3945-6483; Fax: +55 (12) 3945-6488 – E-mail: [email protected]
INTRODUCTION
Images acquired on the same area at different times represent a valuable source of information for a regular monitoring of the Earth’s surface that enables to describe the land-cover evolution, vegetation phenology, hazard events, human-induced changes, among others. Thus, a large number of multitemporal techniques using images have been developed during the last years. These techniques differ widely in refinement, robustness and complex-ity. There are two types of temporal remote sensing data com-monly employed in large-scale vegetation studies: (a) discrete snapshots of the same region over time to analyze spatial changes in land cover; and (b) continuous time series of optical mea-surements to infer trends and dynamics of vegetation phenology (Asner, 2004).
The continuous time series of Normalized Difference Vege-tation Index (NDVI) images are most applied in climate and phe-nological studies. Several time series analysis have demonstrated strong relationships between NDVI temporal signature and precip-itation for different geographic areas and ecosystems (Nicholson et al., 1990; Grist et al., 1997). Other studies have used temporal signatures to classify the vegetation based on observation pheno-logical patterns (Reed et al., 1994).
Then a consistent data acquisition interval among multi-temporal images is necessary to accurate multi-temporal-series signa-tures. However temporal precision in orbital images is difficult to be maintained due to different factors: atmosphere interferences (aerosols, clouds and shadows effects), bidirectional reflectance distribution factors, radiometric variation (sensor oscillation, so-lar illumination angle, among others) or noises, common features in remote sensing images (Hall et al., 1991; Du et al., 2001; La-torre et al., 2007). These effects cause serious problems for differ-ent applications like detection. For this reason, it is necessary for a perfect multitemporal analysis to remove these noises, clouds and their shadows effects (Cihlar et al., 1997).
This paper aims to develop a noise elimination method of temporal signatures combining the Median Filter and Minimum Noise Fraction (MNF) techniques. This work evaluates the NDVI MODIS time series over Cerrado vegetation types.
STUDY AREA
Savannas represent a significant global biome covering a vast area of the African, American, Australian and Asian continents. The vegetation of savannas can be described as discontinuous upper layer of trees above a continuous layer of grasses. In Central Brazil a complex of neotropical savannas is locally known as “Cerrado”. The strong seasonal distribution of rainfall combined with
dys-trophic soils with high Al and Fe contents as well as fire occur-rence determined a wide range of adaptive, phenological strate-gies and biodiversity of these ecosystems (Sarmiento, 1984).
The Cerrado has a typical phenology, with a high dependence in availability of nutrients and water, associated to the seasonal climate, water table depth and fire (Coutinho, 1990). Thus, the savanna region of the Central Brazil shows vegetation patterns at-tributed for underlying variations in soils and soil-moisture of dif-ferent geomorphology and lithology. According to the K¨oeppen classification the climate in Cerrado domain is Aw type and dry winters and rainy summers characterize it. Average precipitation is 1600 mm, mostly concentrated in the wet season (from October to March) (Ad´amoli et al., 1987).
The Cerrado biome has special ecological conditions where savanna vegetation is predominant, interspersed with riparian forests, patches of semideciduous forest, swamp and/or marshes. The “Cerrado Sensu Lato” includes physiognomies varying as “Campo Limpo” (a grassland type), through “Campo Sujo”, “Campo Cerrado”, and “Cerrado Sensu Stricto” (savannic inter-mediary formations), to “Cerrad˜ao” (a forest type). The principal characteristic for differentiation is the density of woody individu-als (trees and shrubs) (Goodland, 1971; Ruggiero et al., 2002).
Moreover, the land cover dynamics in these vegetation types show an intensification of agriculture systems, wood extraction and land degradation processes. The peculiar physical conditions and severe historical anthropogenic pressure have caused exten-sive natural vegetation losses, increasing soil erosion, burned area and biological diversity reduction. Thus, the lack of appro-priate public policies in the land management compromises the environmental condition.
Bras´ılia National Park was created in 1961 with approxi-mately 30,000 hectares located between 15◦3400S and 15◦4800S
of latitude and 47◦5200W and 48◦0600W of longitude coordinates
(Fig. 1). Soils are usually well drained, strongly acidic, dystrophic (Oxisols) and with high Al and Fe contents (Haridasan, 2001). In the Bras´ılia National Park there are the riparian forest, cerrado and grassland.
MATERIAL AND METHODOLOGY MODIS Data
The Moderate Resolution Imaging Spectroradiometer (MODIS) is an Earth Observing System (EOS) sensor designed to measure daily biological and physical processes in global scale in order to understand the dynamics and processes occurring on the Earth’s surface and in the lower atmosphere (Huete et al., 2002). The first sensor was mounted on NASA’s Terra platform, which was
“main” — 2012/8/30 — 18:43 — page 149 — #3
CARVALHO J´UNIOR OA, SILVA NC, CARVALHO APF, COUTO J ´UNIOR AF, SILVA CR, SHIMABUKURO YE, GUIMAR˜AES RF & GOMES RAT
149
launched on December 18, 1999 and began to provide MODIS products since 2000. The second sensor was launched on May 4, 2002 onboard the NASA’s Aqua platform.
Beyond the spectral bands, MODIS Science Team developed data products using specific algorithms planned for EOS/MODIS to supply the needs of global change research (Justice et al., 1998). In this work we used the NDVI products, important tool for monitoring of the Earth’s vegetation. The normalized difference vegetation index (NDVI) is characterized to be sensitive to chloro-phyll content. Thus, the MODIS VI product has offered a time series for a precise monitoring of the seasonal, interannual and long-term variations of vegetation phenological and biophysical parameters. For this study the NDVI images were acquired along 2000-2006 time period with 250-m spatial resolution and 16-day composite interval data.
Elaboration of Images Cube Composed by NDVI Temporal Series
Representation of this NDVI set can be obtained by building the cube of temporal series images (Carvalho J´unior et al., 2006, 2008, 2009; Santana et al., 2010). The cube is formed by co-registered multitemporal images with its three dimensions: x, y andz (temporal NDVI profile) acquired in the same geographi-cal area at different times. The header file of the multitemporal images must contain its respective geographical coordinates and acquisition dates. Figure 2 shows a cube image with the temporal spectrum in a perspective view.
Median Filter
Noise is very common in multitemporal images and hinders the identification and quantification of targets. Consequently, the noise elimination is necessary to acquire a high-quality spectrum. For this purpose, the present paper applies the combination of the two techniques Median Filter and Minimum Noise Fraction (MNF) for eliminating image noises.
Turkey (1977) introduced the median filter operation in sig-nal processing. The method became one of most popular and simple digital technique used for signal smoothing and entropy reduction, because of its good denoising power (Astola & Kuos-manen, 1997) and computational efficiency (Huang et al., 1979). This nonlinear smoothing technique is known for preserving sig-nal edges or monotonic changes in trend and for being partic-ularly effective in removing impulse noise of short duration that cannot be achieved with linear algorithms (Ataman et al., 1981). An impulse noise is composed by fewer points whose values are different from the surrounding regions. Thus, in these respects,
the median smoother is better than the linear filter. Median fil-ters have been applied to various types of data and have achieved some very interesting results in areas of digital signal process-ing, which include image enhancement (Pratt, 2007) and speech processing (Rabiner et al., 1975).
The median is a particular case of the ithorder statistic (or rank statistic) of a finite set of real numbers. The median filter performs a window moving over temporal signature and obtains the median value that is taken as the output. Arranging all the observations from lowest to highest value, the median value of a window is the middle one. Considering an order statistic ofN real numbers (x(i) . . . , x(N)), where N is window digital filter, the minimum is thenx(1), the maximum x(N), and the median
X((N + 1)/2). Thus, the implementation of a median filter
re-quires a very simple digital nonlinear operation.
Normally in the majority of noise cases, a median filter of lengthN = 3 completely eliminates all impulse. However, when the cloud and shadow are present simultaneously in successive images, the median filters cannot eliminate impulse noise com-pletely, i.e., the expected value of the impulse amplitude at the output is not zero. For this case a larger windows filter can be used.
However the median filter presents difficulty to eliminating non-constant signal structures, such as the white noise. Kuhlman & Wise (1981) investigated the output spectrum of a median filter for white noise input points with several different distributions. These authors found that the spectral shape of output is virtu-ally independent of the input distribution. Nodes & Gallagher Jr. (1984) observed that the average filter is better than the median filter for eliminating the Gaussian noise. But, when impulse or double exponential noise is present, the median filter is better than the average filter. This is due to the ability of the median filter to eliminate low probability high power impulses, which cannot be done with linear systems.
A specific median filter module for time series image process-ing was developed in C++language. In this program, the User
establishes a NDVI time series cube. For an accurate filtering it is required a continuous time series with a same time interval.
Minimum Noise Fraction (MNF) and Noise-Adjusted Principal Components (NAPC)
Initially the Minimum Noise Fraction (MNF) and Noise-Adjusted Principal Components (NAPC) were developed for hyperspectral image processing. However, these methods are also adequate to eliminate noise interferences of larger amount of data, such as aerial gamma-ray survey (Dickson & Taylor, 1988).
“main” — 2012/8/30 — 18:43 — page 151 — #5
CARVALHO J´UNIOR OA, SILVA NC, CARVALHO APF, COUTO J ´UNIOR AF, SILVA CR, SHIMABUKURO YE, GUIMAR˜AES RF & GOMES RAT
151
Figure 2 – The concept of NDVI time series cube is shown, where a temporal spectrum can be measured for each spatial element in an image.
MNF is a transformation similar to Principal Component Analysis (PCA) (Green et al., 1988). PCA transformation can be divided into three steps (Richards, 1984):
(a) Derivation of the variance-covariance matrix (V C M) for
N-band of the time series data;
(b) Computation of orthonormalized eigenvectors ofV C M, denoted byU, and of its eigenvalues, represented by A; and
(c) Linear transformation of the data set (x) for the principal components (Z) from the equation Z = UT(x − m), wherem is the mean of the pixels for each band. The MNF transform adopts similar arguments to derivate its components. This method is a linear transformation that max-imizes the signal-to-noise ratio to order images, considering, therefore, the image quality (Green et al., 1988). The MNF can be subdivided into four stages (Fig. 3):
(a) Acquisition of a noise sample and calculation of the variance-covariance matrix of the noise (V C MN); (b) Calculation of the noise fraction index (N F I), by
multiplying the variance-covariance matrix of the noise
(V C MN) and the inverse variance-covariance matrix of the data set (V C M−1), so N F I = V C MN ∗ V C M−1;
(c) From N F I compute its orthonormalized eigenvectors (K) and implement a linear transformation function Z =
K T (x −m), where x is the individual pixel and m is the
mean of the pixels for each band; and
(d) MNF inversion considering only signal information. Sub-sequent retransformation results in cleaned images and spectrum with little signal loss.
Therefore, the MNF calculates a noise fraction index (N F I), instead of PCA, which uses a variance-covariance matrix of the data set (V C M). Consequently, the MNF components will show steadily increasing image quality, unlike the usual ordering of principal components.
NAPC transform is mathematically equivalent to MNF trans-form, but the former transform can be implemented using standard principal components algorithm, without the need for matrix in-version and eigenanalysis of a nonsymmetric matrix (Lee et al., 1990). NAPC transform consists of a sequence of two-cascaded
Figure 3 – MNF transformation procedures in the temporal NDVI cube. The NDVI filtered cube can be converted in MNF space, where the signal is separated from
noise. The subsequent retransformation from signal set results in cleaned images and spectrum with little signal loss.
principal component transforms: noise and transformed data set. In detail, the NAPC transform consists of the following stages (Roger, 1994):
(a) FromV C MN compute its orthonormalized eigenvector matrix (En)and the diagonal matrix of its eigenvalues (An), thenEnTV C MNE = An;
(b) Construct a renormalization matrix F = E A−1/2n , for whichFTV C MNF = I and FTF = A−1/2
n , where
I is the identity matrix;
(c) Transform the data covariance matrix (V C M) by
F to give the noise-adjusted data covariance matrix, V C Madj = FTV C M F;
(d) FromV C Madj, compute its eigenvector matrix (G); and (e) Linear transformation of the dataset (x) for the NAPC com-ponents (Z) by following equation Z = HT (x − m), whereH is described by H = FG = E A−1/2n G. The application of NAPC transform requires knowledge of the noise covariance matrix of the data. Thus, the key problem is to find out which kind of noise we want to eliminate (Carvalho J´unior et al., 2002). The noise reference can be obtained from externally or internally of the images.
External noise reference is obtained from the dark references during the flight and used to evaluate the instrumental noise. This procedure is not applied for time series images being adequate for multispectral and hyperspectral images.
Internal noise reference is obtained from the images by using the statistic techniques that enables to discriminate noise frac-tion from signal. Maximum Autocorrelafrac-tion Factor (MAF) can be used to this purpose (Switzer & Green, 1984). Spatial covariance (V C MD)is defined as the covariance matrix between the origi-nal image, represented byI (x), and the same image I (x + D)
shifted by an mountD. The noise covariance matrix (V C MN) can be to estimate using the following equation:
V C MN = 1/2V C MD (1)
where
V C MD = (I (x) − I (x + D))(I (x) − I (x + D))−1 (2)
In this algorithm was used aD equal to 1. The V C MDcan be calculated considering shifts from one of eight neighbor direc-tions or by the average of two to eight direcdirec-tions given by the User, according to Equation (3).
V C MD= MV C M = (6V C Mi)/n (3) where,MV C M is an average spatial covariance of directions selected;i is the direction of nearest neighbors (1-8); and n is the number of the direction chosen by the User. Thus, theV C MD matrix is obtained and applied in the steps of the NAPC transform. However, noise removal is only performed with the inversing
N APC transform. During the inversion is necessary to
elim-inate noisy bands using only signal bands. This procedure re-duces noise in the original data space. For the inversion opera-tion is need to use as input bothN APC images as statistical file containing the mean of the original bands (M) and matrix HT. Smoothed images (SI) are obtained by the following expression:
SIi = N APCi(HT)−1+ Mi (4) In order to apply MNF method, it is necessary to separate noise in three types, according to its variance and correlation char-acteristics: (a) uncorrelated noise with equal variance in all bands (white noise), (b) high correlation noise, and (c) noise with struc-ture of unknown covariance.
The uncorrelated noise presents a spherical distribution around the data mean. In this case, MNF provides an optimal or-dering of image quality and its elimination. The existence of high correlation noise as aYi(x) function allows the concentration of noise in a single MNF component.
“main” — 2012/8/30 — 18:43 — page 153 — #7
CARVALHO J´UNIOR OA, SILVA NC, CARVALHO APF, COUTO J ´UNIOR AF, SILVA CR, SHIMABUKURO YE, GUIMAR˜AES RF & GOMES RAT
153
However, MNF from two-cascaded principal componenttransformation is not efficient for elimination of noise with un-known covariance structure, such as cloud and shadow. This noise is confined into a single band, although it can be extended for two or three channels. Complementarily the median filter is extremely efficient in this noise elimination.
RESULTS Software
Specific software for denoising MODIS temporal signatures were developed in C++ language. The program has the following
modules: (a) median filter, (b) NAPC transform, and (c) Inverse NAPC transform. In this program and the User establishes an im-ages set at different times. The procedure requires input imim-ages the following characteristics: (a) co-registered multitemporal im-ages with its three dimensionsx, y and z (reflectance profile); (b) resized images with the same dimension (line and column); and (c) preferably images with radiometric normalization that minimizes radiometric differences among multitemporal spectra caused by inconsistencies of acquisition conditions rather than changes in surface reflectance.
In median filter module, the User defines the temporal im-ages and the window size. The result obtained by filtering is again processed by MNF transformation. As input in MNF transforma-tion is requesting the temporal image and the selectransforma-tion of direc-tions used in the MAF calculation. Considering a window size 3×3 pixels the User can choose from the surrounding central pixel the directions that will be used to estimate the spatial co-variance (V C MD) by pressing the directional buttons (Fig. 4). Therefore, the autocorrelation estimation adopts 1 pixel as dis-tance. TheV C MDis calculated considering the average of di-rections chosen.
Figure 4 – User interface containing the directions window for the spatial
co-variance calculation.
The final processing required is inverse MNF transform, which uses as input the images and statistical data generated by MNF transformation. This procedure involves noisy elimination
of the MNF bands in order to reduce noise in the original data space. The selection process of band signal can be done interac-tively, where the User before performing the inversion can see the result for a spectrum image.
Noise Removal
The sequential procedures of the median filter and MNF transform enabled to eliminate different kinds of noise from the time series. The first stage of the median filter is performed to segregate isolated noises originated by cloud, shadow and instruments. In NDVI spectra, the median filter keeps undisturbed the constant neighborhoods and edges, while eliminates isolated noise.
Edges are abrupt changes where the set of points that in-crease or dein-crease surrounded on both sides by constant neigh-borhoods. In NDVI spectrum of the natural vegetation, the edges do not appear prominence, only when there are burning events or anthropic alterations. Normally the vegetation time series present a sinusoidal pattern with gradual variation from composition ratio between nonphotosynthetic vegetation (NPV) and photosynthetic vegetation (PV) along the year.
The filtering over isolated noise induces occasional forma-tion of the narrow plateau composed by two points consecutive with same values. Rarely, the evidence of remained noise given by noise predominance in window filter is noted. In this case a filter with larger size windows can be applied.
The second stage is the MNF transformation that is used to eliminate uncorrelated noise with equal variance in all bands as the narrow plateau. This transformation must be always used on bands free of impulse interference. The resulting spectra show a smoother form, with removal of the narrow plateau and remained noise (Fig. 5).
Thus, the combined techniques enabled to develop a fast and accurate method for multitemporal image correction. Besides, the method generates continuous spectra for each pixel.
The procedure is adequate not only in temporal signatures correction, but also in spatial correction by improving visual im-age quality. Despite the proposed method not acting in the spa-tial dimension, being restricted in temporal dimension, the results obtained in the present investigation also indicated important con-tribution in image correction (Fig. 6).
Vegetation Signatures
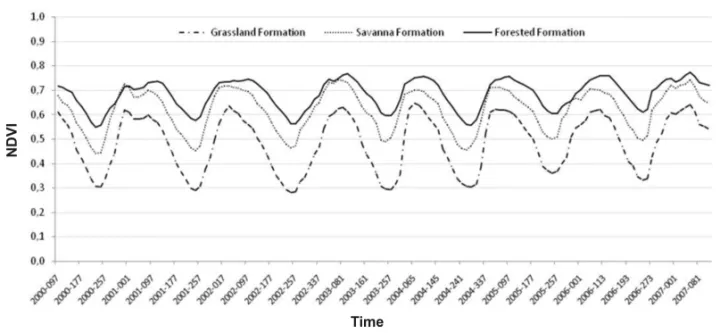
All MODIS temporal vegetation signatures oscillate in an approx-imately sinusoidal pattern, for the period of one-year (Fig. 7). These interannual cycles of greenness correlate with vegetation phenological cycle and large-scale precipitation patterns. The NDVI signatures of the vegetation types present a high linear
cor-Figure 5 – Spectra results of different stages: (a) primary spectrum, (b) median filter with a window width of 3 × 3 pixels and (c) median filter plus MNF transform.
Figure 6 – Two images of same date, one corresponding to the original image (a) and other the corrected image from the use of Median
Filter and MNF combined transform (b). In this case, where there are extensive areas with noise, the use of the spatial filter does not get results as consistent as the temporal correction.
relation due to the similar sinusoidal pattern. The main differences among vegetation types are in the intensity and range values.
The Figure 7 shows the typical temporal signatures for the grassland, savanna and forest types. The NDVI signatures of the
forest type present the highest values for every year. Moreover, the forest type describes the lowest ranges produced by subtraction between the maximum and minimum values. The grassland type shows a distinct behavior with lesser values and highest ranges.
“main” — 2012/8/30 — 18:43 — page 155 — #9
CARVALHO J´UNIOR OA, SILVA NC, CARVALHO APF, COUTO J ´UNIOR AF, SILVA CR, SHIMABUKURO YE, GUIMAR˜AES RF & GOMES RAT
155
Figure 7 – Typical temporal signatures for the grassland, savanna and forest types.
The savanna vegetation type presents an intermediary behavior between grassland and forest types. Thus, NDVI signatures ap-pear to be very useful to discriminate among these vegetation classes. This will be subject for further research work.
CONCLUSIONS
The sequential procedure of Median Filter and MNF enabled to eliminate different kinds of noise from the image. This procedure uses a continuous time series with same time interval. Median Filter segregates impulse noises and MNF transform considered the uncorrelated noises with equal variance in all bands and the high correlation noise. The combined techniques method enabled to reduce the noise by a smoothing process. Thus, the method provides the necessary information to support vegetation classi-fication based on temporal signatures.
ACKNOWLEDGEMENTS
This study was funded through a project grant “Integrated model for monitoring and sustainable development of the S˜ao Francisco basin” from Conselho Nacional de Desenvolvimento Cient´ıfico e Tecnol´ogico (CNPq). The authors are thankful to the financial support from CNPq fellowship (Osmar Ab´ılio de Carvalho J´unior, Yosio Edemir Shimabukuro, Renato Fontes Guimar˜aes e Roberto Arnaldo Trancoso Gomes). Special thanks are given Financiadora de Estudos e Projetos (FINEP) for additional support.
REFERENCES
AD´AMOLI J, MACEDO J, AZEVEDO LG & NETTO JM. 1987. Solos dos Cerrados: tecnologias e estrat´egias de manejo. In: GOEDERT WJ (Ed.). Solos dos Cerrados: tecnologias e estrat´egias de manejo. Nobel, S˜ao Paulo. p. 33–98.
ASNER GP. 2004. Biophysical Remote Sensing Signatures of Arid and Semiarid Ecosystems. In: USTIN S (Ed.). Remote sensing for natural re-sources management and environmental monitoring: manual of remote sensing. John Wiley & Sons. ch. 2. p. 53–109.
ASTOLA J & KUOSMANEN P. 1997. Fundamentals of Nonlinear Digital Filtering. CRC-Press, Boca Raton. 276 pp.
ATAMAN E, AATRE VK & WONG KM. 1981. Some statistical properties of median filters. IEEE Transactions on Acoustics, Speech, and Signal Processing, 29(5): 1073–1075.
CARVALHO J´UNIOR OA, CARVALHO APF, MENESES PR & GUIMAR˜AES RF. 2002. Classificac¸˜ao e eliminac¸˜ao dos ru´ıdos em imagens hiper-espectrais pela an´alise seq¨uencial da transformac¸˜ao por frac¸˜ao de ru´ıdo m´ınima. Revista Brasileira de Geof´ısica, 20(1): 31–41.
CARVALHO J´UNIOR OA, HERMUCHE PM & GUIMAR˜AES RF. 2006. Identificac¸˜ao regional da floresta estacional decidual na bacia do rio Paran˜a a partir da an´alise multitemporal de imagens MODIS. Revista Brasileira de Geof´ısica, 24(3): 319–332.
CARVALHO J´UNIOR OA, SAMPAIO CS, SILVA NC, COUTO J ´UNIOR AF, GOMES RAT, CARVALHO APF & SHIMABUKURO YE. 2008. Classificac¸˜ao de padr˜oes de savana usando assinaturas temporais NDVI do sensor MODIS no Parque Nacional Chapada dos Veadeiros. Revista Brasileira de Geof´ısica, 26(4): 505–517.
CARVALHO J´UNIOR OA, COUTO J´UNIOR AF, SILVA NC, MARTINS ES, CARVALHO APF & GOMES RAT. 2009. Avaliac¸˜ao dos classificadores espectrais de m´ınima distˆancia euclidiana e Spectral Correlation Map-per em s´eries temporais NDVI-MODIS no Campo de Instruc¸˜ao Militar de Formosa (GO). Revista Brasileira de Cartografia, 61(4): 399–412. CIHLAR J, LY H, LI Z, CHEN J, POKRANT H & HUANG F. 1997. Multitem-poral, multichannel AVHRR data sets for land biosphere studies: artifacts and corrections. Remote Sensing of Environment, 60(1): 35–57.
COUTINHO LM. 1990. Fire in the ecology of the Brazilian Cerrado. In: GOLDAMMER JG (Ed.). Fire in the tropical biota ecosystem processes and global challenges (Ecological studies). Springer-Verlag, Berlin. p. 82–105.
DICKSON B & TAYLOR G. 1988. Noise reduction of aerial gamma-ray survey. Exploration Geophysics, 29: 324–329.
DU Y, CIHLAR J, BEAUBIEN J & LATIFOVIC R. 2001. Radiometric nor-malization, composition, and quality control for satellite high resolution image mosaics over large areas. IEEE Transactions on Geoscience and Remote Sensing, 39(3): 623–634.
GOODLAND R. 1971. A physiognomic analysis of the ‘cerrado’ vegetation of Central Brazil. Journal of Ecology, 59(2): 411–419.
GREEN AA, BERMAN M, SWITZER P & CRAIG MD. 1988. A transforma-tion for ordering multispectral data in terms of images quality with impli-cations for noise removal. IEEE Transactions on Geoscience and Remote Sensing, 26(1): 65–74.
GRIST J, NICHOLSON SE & MPOLOKANG A. 1997. On the use of NDVI for estimating rainfall fields in the Kalahari of Botswana. Journal of Arid Environments, 35(2): 195–214.
HALL FG, STREBEL DE, NICKESON JE & GOETZ SJ. 1991. Radiometric rectification: toward a common radiometric response among multidate, multisensor images. Remote Sensing of Environment, 35(1): 11–27. HARIDASAN M. 2001. Nutrient cycling as a function of landscape and biotic characteristics in the Cerrados of Central Brazil. In: McCLAIN ME, VICTORIA RL & RICHEY JE (Eds.). The Biogeochemistry of the Amazon basin and its role in a changing world. Oxford University Press, New York. p. 68–83.
HUANG TS, YANG GJ & TANG GY. 1979. Fast two-dimensional median filtering algorithm. IEEE Transactions on Acoustics, Speech, and Signal Processing, 1(1): 13–18.
HUETE AR, DIDAN K, MIURA T, RODRIGUEZ EP, GAO X & FERREIRA LG. 2002. Overview of the radiometric and biophysical performance of the MODIS vegetation indices. Remote Sensing of Environment, 83(1-2): 195–213.
JUSTICE DH, SALOMONSON V, PRIVETTE J, RIGGS G, STRAHLER A, LUCHT R, MYNENI R, KNJAZIHHIN Y, RUNNING S, NEMANI R, VER-MOTE E, TOWNSHEND J, DEFRIES R, ROY D, WAN Z, HUETE AR, VAN LEEUWEN R, WOLFE R, GIGLIO L, MULLER JP, LEWIS P & BARNSLEY M. 1998. The Moderate Resolution Imaging Spectroradiometer (MODIS): land remote sensing for global change research. IEEE Transactions on Geoscience and Remote Sensing, 36(4): 1228–1249.
KUHLMAN F & WISE GL. 1981. On second moment of median filtered sequences of independent data. IEEE Transactions on Communications, 29(9): 1374–1379.
LATORRE ML, CARVALHO J´UNIOR OA, SANTOS JR & SHIMABUKURO YE. 2007. Integrac¸˜ao de dados de sensoriamento remoto multi reso-luc¸˜oes para a representac¸˜ao da cobertura da terra utilizando campos cont´ınuos de vegetac¸˜ao e classificac¸˜ao por ´arvores de decis˜ao. Revista Brasileira de Geof´ısica, 25(1): 63–74.
LEE JB, WOODYATT AS & BERMAN M. 1990. Enhancement of High Spectral Resolution Remote Sensing Data by a Noise-Adjusted Principal Components Transform. IEEE Transactions on Geoscience and Remote Sensing, 28(3): 295–304.
NICHOLSON SE, DAVENPORT ML & MALO AR. 1990. A comparison of the vegetation response to rainfall in the Sahel and East Africa, us-ing normalized difference vegetation index from NOAA AVHRR. Climatic Change, 17(2-3): 209–241.
NODES TA & GALLAGHER JR NC. 1984. The Output Distribution of Median Type Filters. IEEE Transactions on Communications, 32(5): 532–541.
PRATT WK. 2007. Digital Image Processing: PIKS Scientific Inside. 4th ed. Wiley-Interscience, Hoboken, New Jersey. 812 pp.
RABINER LR, SAMBUR MR & SCHMIDT CE. 1975. Applications of a nonlinear smoothing algorithm to speech processing. IEEE Transactions on Acoustics, Speech, and Signal Processing, 23(6): 552–557. REED BC, BROWN JF, VANDERZEE D, LOVELAND TR, MERCHANT JW & OHLEN DO. 1994. Measuring phenological variability from satellite imagery. Journal of Vegetation Science, 5(5): 703–714.
RICHARDS JA. 1984. Thematic mapping from multitemporal image data using the principal components transformation. Remote Sensing of Environment, 16: 35–46.
ROGER RE. 1994. A Faster Way to Compute the Noise-Adjusted Princi-pal Components Transform Matrix. IEEE Transactions on Geoscience and Remote Sensing, 32(6): 1194–1196.
RUGGIERO PGC, BATALHA MA, PIVELLO VR & MEIRELLES ST. 2002. Soil-vegetation relationships in Cerrado (Brazilian savanna) and semide-ciduous forest, Southeastern Brazil. Plant Ecology, 160(2): 1–16. SANTANA OA, CARVALHO J´UNIOR OA, PIMENTEL CMM, GOMES RAT & OLIVEIRA SN. 2010. Modelagem de espectros temporais NDVI-MODIS, no per´ıodo de 2000 a 2008, na Bacia do Rio Paracatu, Brasil. Revista Brasileira de Geof´ısica, 28(1): 47–60.
SARMIENTO G. 1984. The ecology of neotropical savannas. Harvard University Press, Cambridge. 256 pp.
SWITZER P & GREEN AA. 1984. Min/Max autocorrelation factors for multivariate spatial imaging. Technical Report No. 6, Department of Statistics, Stanford University, Stanford, CA. 14 pp.
TURKEY JW. 1977. Exploratory Data Analysis. Menlo Park Addison-Wesley. 688 pp.
“main” — 2012/8/30 — 18:43 — page 157 — #11
CARVALHO J´UNIOR OA, SILVA NC, CARVALHO APF, COUTO J ´UNIOR AF, SILVA CR, SHIMABUKURO YE, GUIMAR˜AES RF & GOMES RAT
157
NOTES ABOUT THE AUTHORSOsmar Ab´ılio de Carvalho J´unior received his B.Sc., M.Sc. and Dr. in Geology from Universidade de Bras´ılia, Federal District, in 1980, 1982, and 1985, respectively.
From 2002 to 2004, was a researcher at Instituto Nacional de Pesquisas Espaciais (INPE), S˜ao Jos´e dos Campos. Since 2004, has been a professor at Universidade de Bras´ılia and research fellow of CNPq, where conducts research on the digital image processing.
Nilton Correia da Silva received his B.Sc. in Data Processing Technology from Universidade Estadual de Goi´as in 1994, M.Sc. in Computer Science from
Universidade de Bras´ılia in 1999 and Dr. in Data Processing and Environmental Analysis from Institute of Geosciences, Universidade de Bras´ılia in 2003. Has been a professor in the M.Sc. program in Society, Technology and Environment, Centro Universit´ario de An´apolis. His research interests include remote sensing image processing, image database, artificial neural networks and evolutionary computation.
Ana Paula Ferreira de Carvalho received her B.Sc. in Agronomy from Universidade de Bras´ılia in 1992, M.Sc. and Dr. degrees in Ecology from the Universidade
de Bras´ılia in 1998 and 2003, respectively. Her main research interests include remote sensing, spectral analysis and ecological models.
Antˆonio Felipe Couto J´unior received his B.Sc. and M.Sc. degrees in Forest Engineering from Universidade de Bras´ılia in 2003 and 2007, respectively. Professor
in the Environmental Management at Universidade de Bras´ılia. Currently is working toward the Dr. degree in Geoscience at Universidade de Bras´ılia. His main research interests include remote sensing and geographic information systems.
Cristiano Rosa Silva received his B.Sc. in Computer Science from Centro Universit´ario de An´apolis in 2009. Currently is a researcher at the Laborat´orio de
Sistemas de Informac¸˜oes Espaciais, Universidade de Bras´ılia, where conducted studies on digital image processing.
Yosio Edemir Shimabukuro received his B.Sc. in Forest Engineering from Universidade Federal Rural do Rio de Janeiro in 1972, M.Sc. in Remote Sensing
from Instituto Nacional de Pesquisas Espaciais (INPE) in 1977, Ph.D. in Remote Sensing from Colorado State University (EUA) in 1987 and Postdoctoral in Remote Sensing at NASA/GSFC from 1992 to 1994. Currently is a researcher at INPE and research fellow of CNPq.
Renato Fontes Guimar˜aes received his B.Sc. in Cartographic Engineering from Universidade do Estado do Rio de Janeiro in 1987, M.Sc. in Geophysics
from Universidade de Bras´ılia in 1991 and Dr. in Geology from Universidade Federal do Rio de Janeiro in 2000. Currently is a professor in the Department of Geography, Universidade de Bras´ılia and research fellow of CNPq. His main research interests include remote sensing, geographic information systems, cartogra-phy and mathematical modeling.
Roberto Arnaldo Trancoso Gomes received his B.Sc., M.Sc. and Dr. degrees in Geography from Universidade Federal do Rio de Janeiro, in 1999, 2002,
and 2005, respectively. Professor in the Department of Geography, Universidade de Bras´ılia, and research fellow of CNPq. His main research interests include land-cover change detection and integration of remote sensing data in GIS.