BJRS
RADIATION SCIENCES
07-2A (2019) 01-09ISSN: 2319-0612 Accepted: 2018-12-10
Application of bias correction methods to improve U
3Si
2sample preparation for quantitative analysis by WDXRF
M. A. Scapin
a; S. N. Guilhen
a; L. C. Azevedo
a; M. E.B. Cotrin
a; M. A. F. Pires
aa
Instituto de Pesquisas Energéticas e Nucleares /IPEN/CNEN- SP/CQMA,05508-000, São Paulo, SP, Brasil
ABSTRACT
The determination of silicon (Si), total uranium (U) and impurities in uranium-silicide (U3Si2) samples by wavelength
dispersion X-ray fluorescence technique (WDXRF) has been already validated and is currently implemented at IPEN’s X-Ray Fluorescence Laboratory (IPEN-CNEN/SP) in São Paulo, Brazil. Sample preparation requires the use of approx-imately 3 g of H3BO3 as sample holder and 1.8 g of U3Si2. However, because boron is a neutron absorber, this
proce-dure precludes the recovery of U3Si2 from the samples, preventing its use as nuclear fuel. Consequently, a significant
amount of uranium is wasted in this process. An estimated average of 15 samples per month is expected to be analyzed by WDXRF, resulting in approx. 320 g of U3Si2 that wouldn’t return to the nuclear fuel cycle. The purpose of this paper
is to present a new preparation method, replacing H3BO3 by cellulose acetate {[C6H7O2(OH)3-m(OOCCH3)m], m =
0~3}, thus enabling the recovery of the boron-free U3Si2 from the samples. The results demonstrate that the suggested
sample preparation approach is statistically satisfactory, allowing the optimization of the procedure.
1. INTRODUCTION
The determination of Si, total U and inorganic impurities in low enriched uranium silicide (U3Si2, 19.9% of 235U) powder samples by wavelength dispersion X-ray fluorescence (WDXRF) is carried out by a validated procedure at IPEN’s X-Ray Fluorescence Laboratory (IPEN-CNEN/SP) in São Paulo, Brazil [1,2]. WDXRF is able to perform non-destructive simultaneous multielement determi-nations with good precision and accuracy [3], thus preserving the original sample. Since routine analyses are to be required for the qualification of the U3Si2 fuel samples, a potential recovery could represent the reduction of radioactive solid wastes generation by the reincorporation of the compound to the fuel cycle.
IPEN’s Nuclear Fuel Center (CCN-IPEN/SP) is responsible for the yearly production of 60 nuclear fuel elements for the Brazilian Multipurpose Reactor (“Reator Multipropósito”, RMB) [4]. The ex-pected amount of U3Si2 samples to undergo fluorescence analysis could then reach 324 g per year, once each reading is performed in triplicate to ensure the reliability of the results.
The current sample preparation method requires an amount of 1.8 g of U3Si2, which is supported by an approx. 3 g of H3BO3, used as sample holder. This step is used to facilitate sample’s handling [2]. However, boron (10B) is a neutron absorber (neutron poison) because of its high neutron capture cross section, thus disabling sample’s recovery after the analysis, since boron contamination may impair the fuel’s performance in the nuclear reactor.
Within this context, this study proposed a new preparation method for the determination of Si, total U and inorganic impurities in U3Si2 powder samples by WDXRF, replacing boric acid (H3BO3) by cellulose acetate {[C6H7O2(OH)3-m(OOCCH3)m], m = 0~3}. Systematic errors were evaluated in order to demonstrate that the proposed method presents no significant analytical impact.
2.1. Sample preparation
A candidate sample for reference material containing 12 g of U3Si2 powder was supplied by the Nuclear Fuel Center (CCN) at IPEN (CNEN/SP). Sampling was performed in order to obtain 6 sub-fractions of 2.0 g each. 3 of these sub-sub-fractions were prepared using H3BO3 as sample holder and the other 3 were prepared using cellulose acetate. For each single sample, the following procedure it was used: 1.8 g of U3Si2 and 0.2 g of wax (Hoechst wax C micro powder, Merck Millipore, MA, USA) were transferred to a polyethylene flask (approx. 5 cm3) and homogenized in a mechanical mixer for 5 min (Spex CertiPrep, NJ, USA). The mixture was compacted in a hydraulic press (Her-zog, Osnabruck, Germany) employing a 2 kN pressure. A pressed pellet of 25.01 ± 0.01 mm of di-ameter and 5.0 ± 0.2 mm of thickness was obtained for each sub-fraction.
2.2. Instrumental parameters
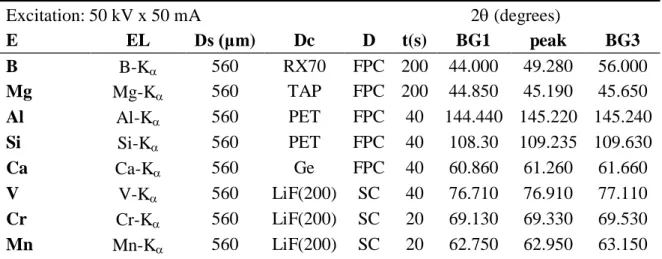
The experiments were carried out using a WDXRF spectrometer (RIGAKU Co., Tokyo, Japan), model RIX 3000, comprising the following primary devices: one 3 kW (Rh target) X-ray tube, 6 positions sample, 8 crystal analyzers and 2 detectors (scintillation and flow-proportional counters). Analytical program parameters such as excitation, emission line (EL), divergence slit (Ds), diffract-ing crystal (Dc), detector (D), fixed countdiffract-ing time (t) and Bragg’s positions (2) - peak and back-ground (BG1 and BG3) readings -for B, Mg, Al, Si, Ca, V, Cr, Mn, Fe, Co, Ni, Cu, Zn, Mo, Cd, Sn, Ba, Pb and U are shown in Tab. 1 [5].
Table 1: Analytical program measurements conditions of WDXRF spectrometer
Excitation: 50 kV x 50 mA 2(degrees) E EL Ds (μm) Dc D t(s) BG1 peak BG3 B B-K 560 RX70 FPC 200 44.000 49.280 56.000 Mg Mg-K 560 TAP FPC 200 44.850 45.190 45.650 Al Al-K 560 PET FPC 40 144.440 145.220 145.240 Si Si-K 560 PET FPC 40 108.30 109.235 109.630 Ca Ca-K 560 Ge FPC 40 60.860 61.260 61.660 V V-K 560 LiF(200) SC 40 76.710 76.910 77.110 Cr Cr-K 560 LiF(200) SC 20 69.130 69.330 69.530 Mn Mn-K 560 LiF(200) SC 20 62.750 62.950 63.150
Fe Fe-K 160 LiF(200) SC 20 57.300 57.505 57.700 Co Co-K 560 LiF(200) SC 20 52.570 52.770 52.970 Ni Ni-K 160 LiF(200) SC 20 48.450 48.650 48.850 Cu Cu-K 560 LiF(200) SC 20 44.810 45.010 45.210 Zn Zn-K 160 LiF(200) SC 20 41.580 41.780 41.980 Mo Mo-K 560 LiF(200) SC 20 20.120 20.320 20.250 Cd (F-Zr) Cd-K 560 LiF(200) SC 20 15.110 15.300 15.500 Sn Sn-K 160 LiF(200) SC 20 13.830 14.030 14.230 Ba Ba-L 560 LiF(200) SC 20 86.930 87.130 87.330 Pb Pb-L 560 LiF(200) SC 20 33.710 33.915 34.111 U U-L1-2nd 560 LiF(200) SC 20 53.560 53.765 53.960
TAP: Thallium Acid Phtalate – PET: Pentaerythritol - LiF: Lithium Fluoride – Ge: Germanium SC: Scintillation Detector - NaI/Tl - FPC: Flow-Proportional Counter
F-Zr: Zr primary X-ray filter.
2.3. Systematic error coefficient (SEC)
Systematic errors, which affect the accuracy of the results, have identifiable causes and can be elim-inated [6]. In X-ray fluorescence spectrometry, systematic errors are usually related to sample prep-aration. For instance, metallic samples require surface treatment using abrasives. Abrasive change, or even the employment of a new batch, may lead to systematically divergent results (above or un-der the results obtained for the original abrasive). Consiun-dering pressed pellets, the substitution of the binder or support base, as described in this study, may also conduct to systematically divergent re-sults.
Because of this, X-ray fluorescence spectrometers’ manufacturers provide mathematical tools, ena-bling the correction of the systematic errors through the calculation of these coefficients. This is a very valuable tool, since these coefficients allow the analysis of samples prepared by different pro-cedures using a calibration curve obtained by a determined procedure. In this study, Eq. 1, available in the software Simultix 14 of the Rigaku spectrometer, was employed [7].
(1)
2.4. Methodology evaluation
Samples were divided into 2 sub-groups: “Group A”, prepared using the cellulose acetate as holder, and “Group B”, using H3BO3. Each sample was randomly analyzed 3 times under the established instrumental conditions, resulting in a set of 18 measurements for each element and the data were evaluated statistically [2]. The Fisher-Snedecor F-test was applied to compare the variances of groups A and B at a 95% confidence level. When the calculated values of F were below their criti-cal value (0.05), the hypothesis of different variances was accepted. The Student t-test was applied to compare the average values (means), assuming different variances for a 95% confidence level. For calculated values of “t” below their critical value (2.13), the difference between the mean val-ues can be assumed as statistically insignificant. Both tests were performed using the Software Mi-crosoft Excel (2013 version).
3. RESULTS AND DISCUSSION
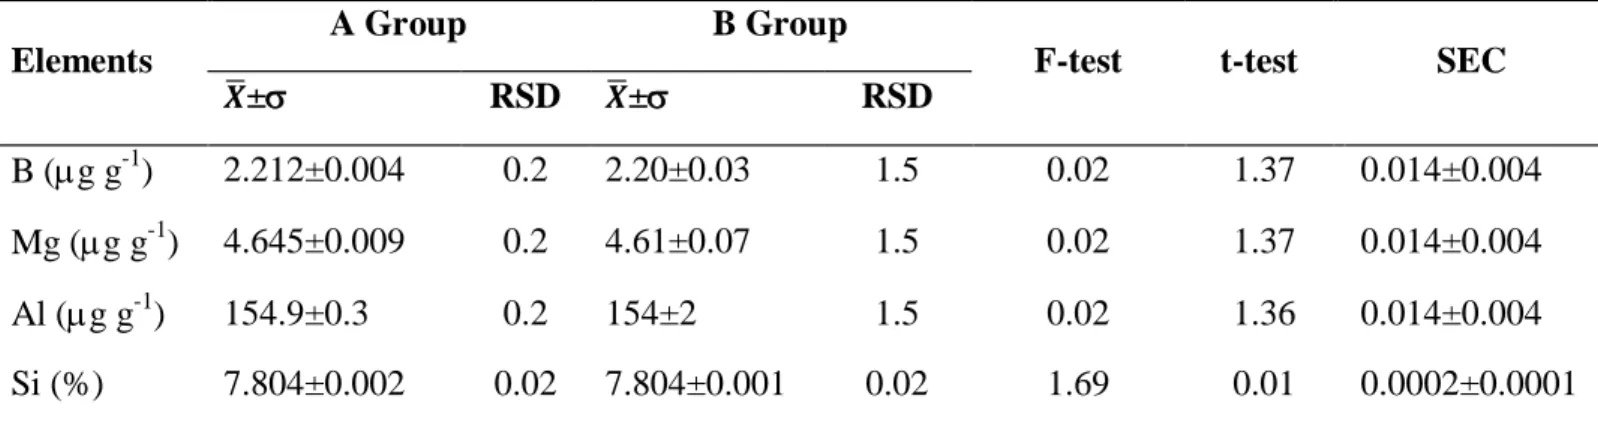
The results for “Group A” and “Group B” are presented in Tab. 2 comprising elemental contents and standard deviations ( ±), followed by the relative standard deviations (RSD), calculated val-ues of F and t, both for a 95% confidence level, and systematic error coefficients (SEC) calculated according Eq. 1.
Table 2: WDXRF analysis results for “Group A” and “Group B” samples
Elements
A Group B Group
F-test t-test SEC
± RSD ± RSD
B (g g-1) 2.212±0.004 0.2 2.20±0.03 1.5 0.02 1.37 0.014±0.004
Mg (g g-1) 4.645±0.009 0.2 4.61±0.07 1.5 0.02 1.37 0.014±0.004
Al (g g-1) 154.9±0.3 0.2 154±2 1.5 0.02 1.36 0.014±0.004
Ca (g g-1) 8.63±0.02 0.2 8.6±0.1 1.5 0.02 1.36 0.014±0.004 V (g g-1) 0.332±0.001 0.2 0.329±0.005 1.5 0.02 1.37 0.014±0.004 Cr (g g-1) 13.16±0.02 0.2 13.1±0.2 1.5 0.02 1.37 0.014±0.004 Mn (g g-1) 189.4±0.4 0.2 188±3 1.5 0.02 1.37 0.014±0.004 Fe (g g-1) 204.8±0.4 0.2 203±3 1.5 0.02 1.37 0.014±0.004 Co (g g-1) 0.332±0.001 0.2 0.329±0.005 1.5 0.02 1.37 0.014±0.004 Ni (g g-1) 10.73±0.02 0.2 10.7±0.2 1.5 0.02 1.37 0.014±0.004 Cu (g g-1) 21.01±0.04 0.2 20.9±0.3 1.5 0.02 1.37 0.014±0.004 Zn (g g-1) 7.08±0.01 0.2 7.0±0.1 1.5 0.02 1.37 0.014±0.004 Mo (g g-1) 2.76±0.01 0.2 2.75±0.04 1.5 0.02 1.37 0.014±0.004 Cd (g g-1) 0.2212±0.0004 0.2 0.220±0.003 1.5 0.02 1.37 0.014±0.004 Ba (g g-1) 0.2212±0.0004 0.2 0.220±0.003 1.5 0.02 1.37 0.014±0.004 Sn (g g-1) 8.18±0.02 0.2 8.1±0.1 1.5 0.02 1.37 0.014±0.004 Pb (g g-1) 5.53±0.01 0.2 5.49±0.08 1.5 0.02 1.37 0.014±0.004 U (%) 91.17±0.01 0.01 91.16±0.02 0.02 0.62 0.14 0.0002±0.0001 F-critical = 0.05 – t-critical = 2.13
The results showed that all elements were quantified for both procedures. The calculated values of F were lower than the critical value (F-critical = 0.05) for all elements, demonstrating that the differ-ence between the variances of Groups “A” and “B” are statistically insignificant, except for Si (1.69) and U (0.62). The relative standard deviation (RSD) values were significantly lower for the samples of “Group A” (0.2 %) compared to those of “Group B” (1.5 %). Thus, the repeatability of the overall results for the samples prepared with cellulose acetate was more satisfactory than for the samples prepared with H3BO3.
The calculated values for the “t” Student test (“t-test”) for all the elements were lower than the criti-cal values (2.13), demonstrating that there are no statisticriti-cally significant difference between the samples of “Group A” and “Group B”.
For Si and U, the systematic error coefficients (SEC) showed that the influence of the major con-stituents were lower (0.0002±0.0001) when compared to the other elements (0.014±0.004). Howev-er, the SEC values can be disregarded for all the elements, when the correction is applied, because
the variation in the concentration values is smaller than the standard deviation. Thus, the hypothesis can be accepted, that there are no statistically significant differences between both methods.
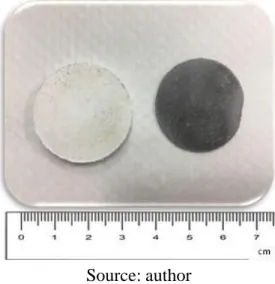
It was visually evident that the 3 samples prepared with cellulose acetate were easily removable from its base after the analysis (Fig. 1), thus ensuring boron-free U3Si2 pellets. The probable hy-pothesis for this is that the cellulose acetate had undergone some sort of decomposition after the irradiation in the spectrometer, favoring the detachment of the sample from its base.
Figure 1: Cellulose base (left) and clear detached U3Si2 sample.
Source: author
4. CONCLUSION
The results allowed concluding that the substitution of boric acid for cellulose acetate in the prepa-ration of pressed pellets for elemental analysis by WDXRF can be applied, since statistically equiv-alent results are achieved in both cases. Indeed, the cellulose acetate proved to be more suitable than the H3BO3, because it allowed an effortless recovery of the sample. Thus, the aim of this study was achieved, as an effective alternative preparation procedure for U3Si2 analysis by WDXRF was pro-posed. In addition, using cellulose acetate as support base allows a simple and complete recovery of the U3Si2 samples.
1. M. A. SCAPIN, V. L. R. SALVADOR, M. E. B. COTRIM, M. A. F. PIRES. Uncertainty measurement evaluation of WDXRF and EDXRF techniques for the Si and Utotal determination in U3Si2 nuclear fuel. J Radioanal Nucl Chem, DOI: 10.1007/s10967-010-0897-6, 2011.
2. M. A. SCAPIN, M. B. E. COTRIM, C. P. SILVA, M. A. F. PIRES, Application of multivari-ate calibration for simultaneous determination of major and minor constituents in U3Si2 by WDXRF technique. J. Radioanal. Nucl. Chem., DOI 10.1007/s10967-014-3332-6, 2014.
3. WEST, M.; ELLIS, A. T.; POTTS, P. J.; STRELI. C.; VANHOOF, C.; WOBRAUSCHEK, P. 2015 Atomic Spectrometry Update – a review of advances in X-ray fluorescence spectrometry and their applications. J. Anal. At. Spectrom, DOI 10.1039/C5JA90033F, 2015.
4. IPEN - Instituto de Pesquisas Energéticas e Nucleares. CCN se adequa para atender demanda do
RMB. São Paulo, Brasil, 2015. Available at:
<https://www.ipen.br/portal_por/portal/interna.php?secao_id=38&campo=1977>Last accessed: 17 Nov. 2017.
5. M. A. SCAPIN, M. B. E. COTRIM, C. P. SILVA, M. A. F. PIRES, Application of multivari-ate calibration for simultaneous determination of major and minor constituents in U3Si2 by WDXRF technique. In: INTERNATIONAL NUCLEAR ATLANTIC CONFERENCE, 2013,
Recife, Annals… Available at:
<http://www.iaea.org/inis/collection/NCLCollectionStore/_Public/46/021/46021415.pdf>. Last ac-cessed: 17 Nov. 2017.
6. D. W. PRESTON; E. R. DIETZ, The art of experimental physics, Nova York: John Wiley & Sons, 1991.
7. RIGAKU CORPORATION. Rigaku multi-element simultaneous X-ray fluorescence