Danilo Barbosa Cardoso1, Ednilton Tavares de Andrade2, Renso Alfredo Aragón Calderón3,
Mariane Helena Sanches Rabelo4, Camila de Almeida Dias5, Isabela Ávila Lemos6 (Received: June 25, 2018; accepted: September 26, 2018)
ABSTRACT: The aim in this study was to determine the main thermal properties of the granular mass of coffee (specific heat, thermal conductivity, and thermal diffusivity) for different degrees of roasting, as well as to model and simulate thermal conductivity at different degrees of roasting. For determination of specific heat, the mixing method was used, and for thermal conductivity, the theoretically infinite cylinder method with a central heating source. Thermal diffusivity was simulated algebraically using the results of the properties cited above and of the apparent specific mass of the product. Thermal conductivity was also simulated and optimized through finite element analysis software. As results, at darker roasting there was an increase in specific heat and a reduction in thermal conductivity and thermal diffusivity. Comparing thermal conductivity determined in relation to simulated and optimized conductivity, the mean relative error was 1.02%, on average.
Index terms: Specific heat, thermal conductivity, thermal diffusivity.
DETERMINAÇÃO DAS PROPRIEDADES TÉRMICAS DE GRÃOS DE CAFÉ EM DIFERENTES PONTOS DE TORRA
RESUMO: Este trabalho teve como objetivo determinar as principais propriedades térmicas da massa granular de café (calor específico, condutividade e difusividade térmica), para diferentes pontos de torra bem como modelar e simular a condutividade térmica em diferentes graus de torração. Para a determinação do calor específico utilizou-se o método das misturas e para a condutividade térmica o método do cilindro teoricamente infinito com fonte de aquecimento central. A difusividade térmica foi simulada algebricamente utilizando-se os resultados das propriedades citadas anteriormente e da massa específica aparente do produto. Condutividade térmica foi, também, simulada e otimizada através do software de análise por elementos finitos. Como resultado foi observado que em torras mais escuras houve um aumento do calor específico e uma diminuição de condutividade e difusividade térmica. Através da comparação entre a condutividade térmica determinada e a condutividade simulada e otimizada verificou-se que o erro médio relativo, em média, foi de 1,02%.
Termos para indexação: Calor específico, difusividade térmica, condutividade térmica. 1 INTRODUCTION
Brazil is leader in the world market for production and export of green coffee beans. In postharvest, these green coffee beans pass through some steps until reaching at a very important phase of processing, the roasting. According to the International Coffee Organization – ICO (2017), the world consumption of coffee was 9368 million of Kg in 2017. The roasting is a highly important step in coffee processing because it is responsible for expressive modification of the raw material. During roasting, the coffee bean dehydrates and goes through physical-chemical transformations that provide the final product with the characteristics offered for its consumption (color, aroma, and flavor) through the formation of various volatile compounds (BOTTAZZI et al., 2012; HERNÁNDEZ; HEYD; TRYSTRAM, 2008).
1,2,3,4,5,6 Universidade Federal de Lavras/UFLA - Departamento de Engenharia/DEG - Cx. P. 3037 - 37.200-000 - Lavras - MG
[email protected], [email protected], [email protected], [email protected], [email protected], [email protected]
Throughout production process, coffee beans are subjected to changes in temperature and moisture, and to ensure a quality product in the end of process, it is necessary to know how these changes occur. In this sense, the knowing properties such as specific heat, thermal conductivity, and thermal diffusivity are relevant for studies of heat and mass transfer in agricultural seed grains (BORÉM et al., 2002).
The specific heat, by definition, is the amount of heat necessary to raise the temperature of a body by 1°C per unit of mass without change in state. It is essential to know this for determination of the amount of energy required for heating or cooling a food product. The thermal conductivity of a material is the measure of its conduct heat capacity (MOHSENIN, 1980).
According to Mohsenin (1980), numerical values of thermal conductivity of solid, granular, and porous materials can to vary according to chemical composition, fluid material content,
The apparent specific mass of the coffee beans was analyzed using a GEHAKA brand kit, following manufacturer’s instructions for determination of the hectoliter weight of coffee beans (BOTELHO et al., 2016). The test was performed in four replications for each roasting degree and for the green coffee bean. The results were expressed in kg.m-3.
The color of the roasted coffee was determined using the colorimeter Konica Minolta CR-300. This equipment was used in the configuration of D65 illuminant and calibrated with the white plate with a value determined corresponding to L*, a*, b*. The color of the beans was expressed in parameters of the system CIE L*, a*, b* and also of the system CIE L* c* h°. The L* coordinate indicates lightness, which ranges from 0 (black) to 100 (white). The other parameters, a* and b* (chromaticity coordinates), indicate the colors directions of the roasted beans, in which +a* indicates red color, -a* green, +b* yellow, and –b* blue. Three readings were made for composition of the mean value.
The cylindrical coordinates c* or chroma, which provides a measurement of intensity or saturation of the color, and h°, which corresponds to the hue angle, were simulated from equations (2) and (3), respectively.
The specific heat of the coffee beans for the different roasting degrees and for the green coffee bean was determined by the mixing method. In this method, the product with known mass (100 g) and temperature (25°C) was placed in a calorimeter (Figure 1) of known thermal capacity (0.048 kJ.°C-1), which contains water at a temperature (40°C) and mass (400 g) that are also known. When the thermal equilibrium of the mixture is reached, the specific heat of the product can be simulated, using the equation (4) (MOHSENIN, 1980).
in which Cp is the specific heat of the product in kJ.kg-1.°C-1; C
w is the specific heat of the water in kJ.kg-1.°C-1; C is the heat capacity of the calorimeter in kJ.°C-1; M
p is mass of the product in kg; Mw is mass of water in kg; Tp is temperature of the product in °C; Tw is temperature of water in °C; Te is temperature of equilibrium in °C.
physical structure, state, density, temperature, and moisture content. According to the same author, for biological materials, thermal conductivity depends more on cell structure, density, and moisture content than on temperature.
For heat to be diffused in the grain mass, for example in a mass of roasted coffee beans, there is dependence on the thermal properties of the product, among which is thermal diffusivity, and on the temperature gradient within the body and between the surface and the environment.
Thus, the aim in this study was to determine variations in specific heat, thermal conductivity, and thermal diffusivity of coffee beans at different degrees of roasting, analyze the correlation of these thermal properties with the lightness colorimetric parameter (L*) and apparent specific mass, and simulate and optimize thermal conductivity through finite element analysis software.
2 MATERIALS AND METHODS This study was developed at the Agricultural Product Processing Laboratory (LPPA) of the Universidade Federal de Lavras (UFLA) in Lavras, MG, Brazil.
Coffee (Coffea arabica L.) beans were used, with an average moisture content of 0.123 dry basis (10.94% wet basis), which was determined by the laboratory oven method at 105±1°C for 16±0.5 hours, according to the standard method of ISO 6673 (INTERNATIONAL ORGANIzATION FOR STANDARDIZATION - ISO, 1999). The coffee was hulled and the beans were separated according to shape and size. Only the conventional flat coffee beans from sieve size 16 to 18/64 inches were used for roasting, eliminating the flat beans retained in the 19/64 inch sieve and the peaberries retained in the sieve with an oblong screen of 11 x ¾ inch. The beans were then roasted to 5 different levels in an Atilla 5 Kg Gold Plus coffee roaster.
A caliper rule was used for determination of the dimensions of 40 coffee beans from each treatment; and coffee bean volume was calculated through equation (1), approximating the coffee bean shape to the shape of a semi-ellipsoid (BUSTOS-VANEGAS et al., 2018)
in which V is volume in mm3; a is bean length in mm; b is bean width in mm; and c is bean thickness in mm.
(1)
(2)
(3)
For the thermal conductivity determination and analysis of transient heat flow through the product granular mass by the theoretically infinite cylinder method (Figure 2), the equation (5) was used to describe heat flow in a linear source (MOHSENIN, 1980).
in which T is temperature in ºC; t is the sample heating time in s; α is thermal diffusivity in m2.s–1; and r is radial distance of the heat source in m. This method consists of use of an aluminum cylinder with pre-determined diameter and length, with a nickel-chrome varnished conductor wire in the center, through which a low intensity electric current flowed (1 A and 1.8 V). Temperature was obtained by means of three sets equidistant thermocouples (120°) placed at mid-height of the cylinder. Each set was composed of 6 thermocouples at a distance of 1 cm from each other along the radius of the center of the tube (Figure 2). The coffee beans thermal conductivity was obtained on transient regime by cylindrical coordinates through the equation (6).
in which k is thermal conductivity in W.m-1.°C-1; Q is heat provided to the conductor wire in W; t is time in s; T(t) is temperature at time t in °C; and t0 is the correction factor in s.
FIGURE 1 - Schematic drawing of the experimental equipment for determination of specific heat.
(5)
(6)
According to Chang (1986), the correction factor t0 can be calculated as a logarithm function of the values of time and of the differences among the temperatures observed over time and the initial temperature of the system.
The theoretically infinite cylinder is an idealization that allows adoption of the hypothesis of one-dimensional conduction in the radial direction, which is considered a reasonable approximation if the ratio between the length and the radius of the cylinder is greater than or equal to 10 (BERGMAN et al., 2011).
Thermal diffusivity of the granular mass of green and roasted coffee beans was determined using equation (7), after specific heat, thermal conductivity, and apparent specific mass were determined experimentally.
in which is thermal diffusivity in m2.s-1; and ρ is apparent specific mass in kg.m-3. The equation that governs transient transfer of heat in an infinite cylinder when considering (a) generation of heat coming from a central infinite source of zero diameter and constant wattage; (b) infinite and homogeneous medium; and (c) initial conditions of the medium that is isothermal and in equilibrium with the environment, can be expressed as (BERGMAN et al., 2011):
(7)
FIGURE 2 - Schematic drawing of the experimental device for determination of thermal conductivity.
in which T is temperature in ºC; t is time for heating the sample in s; α is thermal diffusivity in m2 s-1; r is the radius of localization of the thermocouple in m; and q is power dissipated in the source in W m-1 per unit of volumetric heat capacity (ρC-J m-3 ºC-1). The approximate solution of equation (8) was obtained using the finite element technique. Initially the system was divided into 2925 two-dimensional asymmetric elements of the PLANE77 type, for a total of 9196 nodes.
In the finite element technique, one of the procedures for analyzing equation (8) is by means of the weighted residual method (SEGERLIND, 1984). In this method, the volume integral for an element “e” is given by equation (9).
in which {R(e)} is residual integral;
[ ]
W T is weightfunction; k is thermal conductivity; A is area of the element; and dA is elemental area.
The equation (9) is evaluated with respect to the spatial coordinates for a fixed moment of time. Once integrated, equation (9) can be expressed in matrix form as:
in which
[ ]
te
C is the thermal capacitance matrix;
[ ]
tb eK is the conductivity matrix;
[ ]
Ketc is theconvection matrix on the element surface;
{ }
c eQ is the vector of heat flow on the element surface;
{ }
g eQ is heat generation; and { }Fe is the element force vector.
The equation (11) is the general (or global) form of the equation (10) that can be apply to the system set of elements. Thus, the solution of equation (9) produces a linear differential equations system of first order in time.
in which [C] is the global capacitance matrix; [K] is the global rigidity matrix; and {F} is the global force vector.
The discretization of the equation (10) in time can be performed with the aid of approximations by finite differences in the time domain (SEGERLIND, 1984). The result of discretization has the form:
in which θ is the parameter of transient integration;
n
n t
t t= −
∆ +1 is the time interval = 2 h; {T}n is the temperature at time tn; {T}n+1 is the temperature at time tn+1; {F}n is the global force vector at time tn; and {F}n+1 is the global force vector at time tn+1.
The equation (12) provides the nodal values of the temperatures at moment tn+1 as a function of the known values of the temperatures at moment tn and of forces at moments tn and tn+1 and the transient integration parameter
θ
.(9)
(10)
(11)
The nodal temperatures values at different times were obtained by solving the equations system represented by equation (12) (SEGERLIND, 1984). So, the computational program of finite element analysis ANSYS 14.2 was used.
For implementation of the finite element method, it is necessary to introduce parameters, some related to the product properties, which were determined experimentally, and others relevant to the initial conditions and boundary conditions imposed on the system (Figure 3).
3 RESULTS AND DISCUSSION
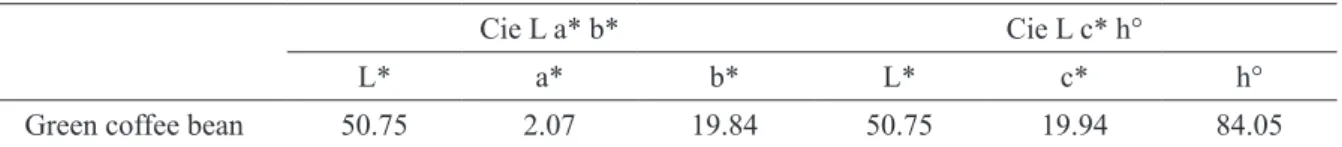
The mean values of color parameters obtained experimentally for green coffee beans that were used for roasting are present in Table 1.
These data reveal that it occurred in the darkening of the sample because the colorimetric parameter (L *) was of 50.75 for green coffee and 23.85 for roasted coffee in mean.
The mean values obtained experimentally for apparent specific mass and length, width, and thickness of green coffee beans are presented in Table 2.
The apparent specific mass obtained in the present study for hulled coffee was 666.75 kg.m -3 for grains with moisture content of 0.123 dry basis (10.94% w.b.) (Table 2). This result is lower than that obtained by Oliveira et al. (2015), that found data for apparent specific mass from 751 to 758 kg.m-3 for moisture content of 11% (w.b.), but above that found by Giomo, Nakagawa and Gallo (2008), which on average found a value of 498.4 kg.m-3 for mean moisture content of 33.35% w.b, and also above that found by Olukunle and Akinnuli (2012), that found values from 588.2 to 609.8 kg.m-3 for moisture content of 10,7 % d.b.
The experimental values of the thermal properties determined for green coffee beans are expressed in Table 3.
FIGURE 3 - (a) Boundary conditions applied from discretization of the system in elements; (b) Temperature distribution in the system with coffee beans.
TABLE 1 - Color parameters for green coffee beans used for roasting.
Cie L a* b* Cie L c* h°
L* a* b* L* c* h°
Green coffee bean 50.75 2.07 19.84 50.75 19.94 84.05
TABLE 2 - Mean dimensions of 40 coffee beans and apparent specific mass of green coffee beans. Length
(mm) Width (mm) Thickness (mm) Specific mass (kg.m-3)
8.91 6.59 3.62 666.75
TABLE 3 - Thermal properties for green coffee beans. Thermal property
Specific heat (kJ.kg-1.°C-1) 1.929
Thermal conductivity (W.m-1.ºC-1) 0.182
The values of specific heat and thermal conductivity for green coffee beans in the present study were 1.929 kJ.kg -1.°C -1 and 0.182 W.m-1. ºC-1, respectively. These values are near those obtained by Borém et al. (2002), which studied five varieties of pulped coffee and obtained specific heat between 1.00 and 3.00 kJ.kg-1.ºC-1, and thermal conductivity between 0.10 and 0.20 W.m-1.ºC-1, with moisture contents that ranged from 0.1 to 0.95 (d.b.), but different from values found by Fabbri et al. (2011), that found 1.256 kJ.kg-1.ºC-1 for specific heat and 0.131 W.m-1.ºC-1 for thermal conductivity. Burmester and Eggers (2010) found thermal conductivity values for semi-washed coffee from 0.20 to 0.34 W.m-1.ºC -1, determined through the stationary plate method (Eurotechnica GmbH, Bargteheide, Germany).
The diffusivity value of hulled green coffee in the present study was 1.42x10⁻⁷ m2.s-1 ; which is within the interval of values found by Borém et al. (2002), which was from 1.0x10⁻⁷ to 3.0x10 -7 m2.s-1 for all the varieties of pulped coffee, and moisture contents from 0.1 to 0.95 (d.b.) but with the difference that, in the 2002 study, the coffee analyzed had parchment. Fabbri et al. (2011) used the equipment Thermal Analyzer KD2 (Decagon Device Inc., Pullman, USA) and found a thermal diffusivity value of 0.9x10⁻⁷ m2.s-1. These differences of values found occur due to different varieties of coffee, product moisture contents, and methods for determination of these properties.
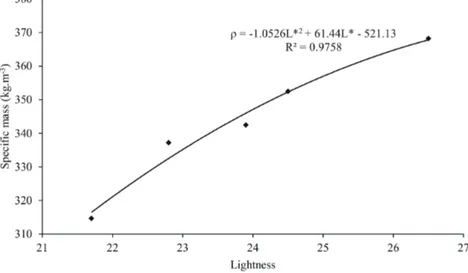
The mean experimental values of apparent specific mass as a function of the roasting degree, which is represented by the lightness (L*) colorimetric parameter, are present in Figure 4. The results indicate that with a reduction in lightness, there is a reduction in specific mass, which can be explained through the occurrence of an increase in volume the darker the roast is, as present in Table 4.
The mean values obtained experimentally for apparent specific mass and the measurements of the coffee beans for length, width, and thickness of the coffee samples at different roasting degrees are present in Table 4. Degree 1 is considered the lightest roasting degree and degree 5 the darkest, as present in Figure 4.
The apparent specific mass values are in agreement with the values found by Bicho et al. (2012), which were 400 to 300 kg.m-3, and by Oliveira et al. (2014), which were 359.4 to 342.26 kg.m-3. They are also near the results obtained by Mendonça, Franca and Oliveira (2009) that were 465 to 349 kg.m-3, but lower than the values 530 to 370 kg.m-3, found by Jokanović et al. (2012).
The mean values of color parameters obtained experimentally for coffee beans at different degrees of roasting are present in Table 5.
Baggenstoss, Perren and Escher (2008) found values of the lightness colorimetric parameter (L*) from 23.5 to 22.6, which are similar to those found in this study.
Considering that the second degree polynomial is a simple model and satisfactorily explains the variations in the thermal properties studied as a function of the roasting degree, the criterion of highest adjusted coefficient of determination (R2) was used as the choice for the equation to be adopted.
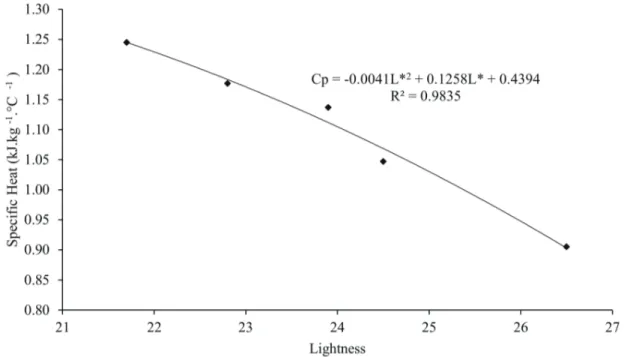
Figures 5, 6, and 7 exhibit the experimental values of specific heat, thermal conductivity, and thermal diffusivity for coffee beans roasted as a function of the lightness colorimetric parameter (L*) and constitutes a scale between black and white, in which values near 20 indicate dark roasting and values near 30 indicate light roasting. The results reveal that there was an increase in specific heat and a reduction in thermal conductivity and diffusivity with darker roasting,
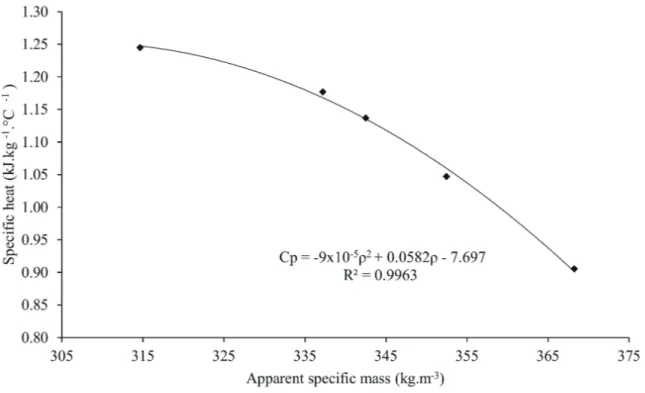
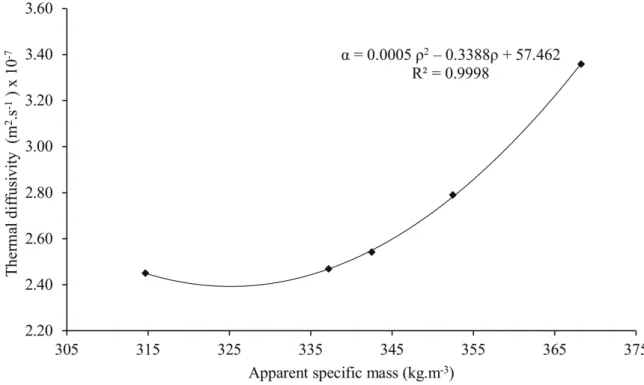
The Figures 8, 9, and 10 present the experimental values of specific heat, thermal conductivity, and thermal diffusivity for coffee beans roasted as a function of apparent specific mass. These figures present that these properties of roasted coffee had a higher adjusted coefficient of determination (R2) compared to the figures related to the lightness colorimetric parameter (L*). With reduction in specific mass from roasting, there was reduction in thermal conductivity and thermal diffusivity, but an increase in specific heat.
The Table 6 presents the physical properties of green and roasted coffee of the present study.
In the present study of roasted coffee, the values of specific heat ranged from 905.46 to 1245.08 J.kg-1.°C-1, values of thermal diffusivity ranged from 3.35x10⁻⁷ to 2.45x10⁻⁷ m2.s-1, and values of thermal conductivity ranged from 0.112 to 0.096 W.m-1.ºC-1.Fabbri et al. (2011) found values of specific heat for roasted coffee from 1256 to 1648 J.kg-1.°C-1, values of thermal diffusivity from 0.09x10⁻⁷ a 0.82x10⁻⁷ m2.s-1, and values of thermal conductivity from 0.131 to 0.075 W.m-1.ºC-1. Hammerschmidt and Abid (2016) found a value of specific heat of 1593 J.kg-1.°C-1 for 0ºC for roasted coffee. As observed in figures 5, 6, 7, 8, 9 and 10, there was an effect of the roast on all analyzed thermo-physical properties.
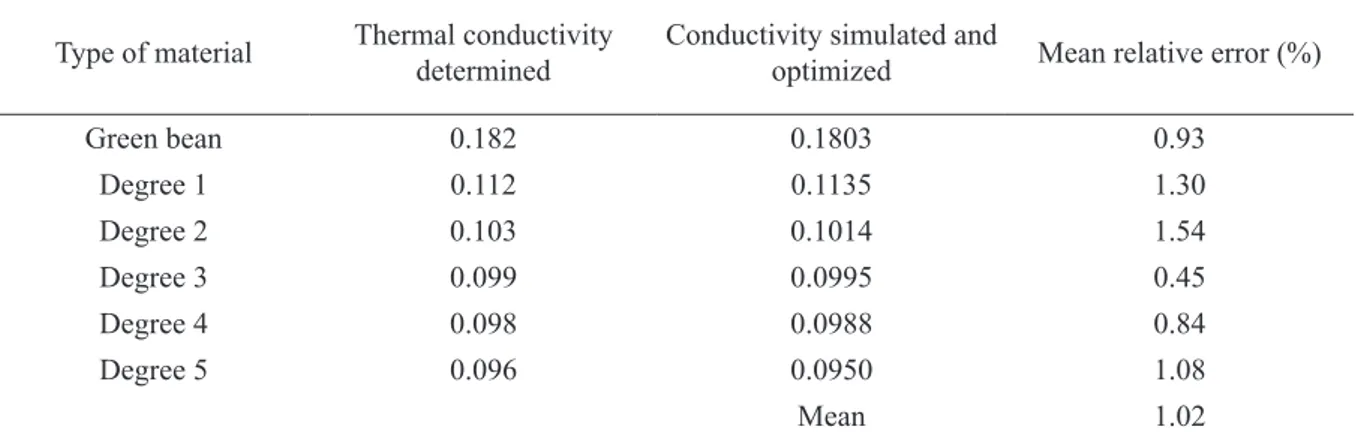
The Table 7 presents the data of the property thermal conductivity obtained experimentally and by computational simulation and optimization, and the mean relative error between the two methods studied.
For the suitability of certain models in
TABLE 4 - Mean dimensions of 40 coffee beans and apparent specific mass at different roasting degrees Length
(mm) Width (mm) Thickness (mm) Volume(mm3) Apparent specific mass(kg.m-3)
Degree 1 9.81 a 7.67 a 3.97 a 157.25 a 368.40 a Degree 2 9.93 a 7.73 a 3.99 a 161.16 a 352.48 b Degree 3 10.14 b 7.83 b 4.05 a 168.91 b 342.36 c Degree 4 10.23 b 7.86 b 4.07 a 171.88 b 336.96 d Degree 5 10.54 c 7.99 c 4.19 a 187.04 c 314.43 e CV (%) 5.38 3.23 5.37 10.45 0.39
Mean values followed by the same letter in the column belong to the same cluster by the Scott-Knott test at 5% probability.
FIGURE 4 - Experimental values of coffee beans specific mass as a function of roasting degree (lightness colorimetric parameter).
the description of a phenomenon, according to Mohapatra and Rao (2005), values lower than 10% mean relative error (P) indicate good fit for practical purposes. The error obtained was acceptable, confirming the results, and, thus, the model developed can be used in other applications.
TABLE 5 - Color parameters for different degrees of roasting.
Cie L a* b* Cie L c* h° L* a* b* L* c* h° Degree 1 26.47 9.66 16.98 26.47 19.53 60.37 Degree 2 24.46 8.65 17.30 24.46 19.34 63.44 Degree 3 23.88 8.89 16.84 23.88 19.04 62.18 Degree 4 22.76 7.91 13.22 22.76 15.41 59.12 Degree 5 21.66 8.69 13.71 21.66 16.23 57.63
FIGURE 5 - Experimental values of specific heat of coffee beans as a function of roasting degree (lightness colorimetric parameter).
FIGURE 6 - Experimental values of thermal conductivity of coffee beans as a function of the roasting degree (lightness colorimetric parameter).
FIGURE 7 - Experimental values of thermal diffusivity of coffee beans as a function of degree of roasting (lightness colorimetric parameter).
FIGURE 9 - Experimental values of thermal conductivity of roasted coffee beans as a function of apparent specific mass.
4 CONCLUSIONS
According to the results obtained can be concluded that:
1. The thermal properties of roasted coffee bean samples has a correlation with the lightness colorimetric parameter (L*) and apparent specific mass;
2. The specific heat of roasted coffee ranged from 905.46 to 1245.08 J.kg -1.°C -1.
3. The thermal conductivity of roasted coffee ranged from 0.112 to 0.096 W.m-1.ºC-1.
4. The thermal diffusivity of the roasted coffee ranged from 3.35x10⁻⁷ m2.s-1 to 2.35x10⁻⁷ m2.s-1.
5. The thermal properties of roasted coffee had greater adjusted coefficients of determination (R2) in relation to apparent specific mass compared to the lightness colorimetric parameter (L*).
6. With darker roasting, there was an increase in specific heat and a reduction in thermal conductivity and diffusivity.
TABLE 6 - Physical properties of green and roasted coffee.
Type of material Specific mass(kg.m-3) Specific heat(J.kg-1.°C-1) Thermal diffusivity(x10-7 m2.s-1) Thermal conductivity determined
Conductivity simulated and optimized Green bean 666.75 1929.30 1.4148 0.182 0.18029 Degree 1 368.25 905.46 3.3590 0.112 0.11347 Degree 2 352.48 1047.27 2.7903 0.103 0.10643 Degree 3 342.50 1137.05 2.5421 0.099 0.09945 Degree 4 337.20 1177.00 2.4692 0.098 0.09883 Degree 5 314.65 1245.08 2.4505 0.096 0.09498
TABLE 7 - Data of the property thermal conductivity obtained experimentally and by computational simulation and optimization.
Type of material Thermal conductivity determined Conductivity simulated and optimized Mean relative error (%)
Green bean 0.182 0.1803 0.93 Degree 1 0.112 0.1135 1.30 Degree 2 0.103 0.1014 1.54 Degree 3 0.099 0.0995 0.45 Degree 4 0.098 0.0988 0.84 Degree 5 0.096 0.0950 1.08 Mean 1.02
7. With reduction in specific mass after roasting, there was a reduction in thermal conductivity and thermal diffusivity, but an increase in specific heat.
8. Comparing the thermal conductivity that was determined in relation to that simulated and optimized by a computational program of finite element analysis, mean relative error was 1.02%, on average.
5 REFERENCES
BAGGENSTOSS, J.; PERREN, R.; ESCHER, F. Water content of roasted coffee: impact on grinding behaviour, extraction, and aroma retention. European Food Research and Technology, v. 227, n. 5, p. 1357-1365, Sept. 2008.
BERGMAN, T. L. et al. Fundamentals of Heat and Mass Transfer. 7th Edition. John Wiley & Sons, Inc, 2011. 1072 p. ISBN 978-0-470-91323-9.
BICHO, N. C. et al. Use of colour parameters for roasted coffee assessment. Food Science and Technology, Campinas, v. 32, n. 3, p. 436-442, July./Sept. 2012.
BORÉM, F. M. et al. Propriedades térmicas de cinco variedades de café cereja descascado. Revista Brasileira de Engenharia Agrícola e Ambiental - Agriambi, Campina Grande, v. 6, n. 3, p. 475-480, Sept./Dec. 2002.
BOTELHO, F. M. et al. Physical properties of robusta coffee berries during drying: Determination and modelling. Coffee Science, Lavras, v. 11, n. 1, p. 65-75, Jan./Mar. 2016.
BOTTAZZI, D. et al. A numerical approach for the analysis of the coffee roasting process. Journal of Food Engineering, v. 112, n. 3, p. 243-252, Oct. 2012. BURMESTER, K.; EGGERS, R. Heat and mass transfer during the coffee drying process. Journal of Food Engineering, v. 99, n. 4, p. 430-436, Aug. 2010. BUSTOS-VANEGAS, J. D. et al. Developing predictive models for determining physical properties of coffee beans during the roasting process. Industrial Crops and Products, v. 112, p. 839-845, Feb. 2018. CHANG, C. S. Thermal conductivity of wheat, corn, and grain sorghum as affected by bulk density and moisture content. Transactions of the ASAE, St. Joseph, v. 29, n. 5, p. 1447-1450, Sept./Oct. 1986. FABBRI, A. et al. Numerical modeling of heat and mass transfer during coffee roasting process. Journal of Food Engineering, v. 105, n. 2, p. 264-269, July. 2011. GIOMO, G. S.; NAKAGAWA, J.; GALLO, P. B. Beneficiamento de sementes de café e efeitos na qualidade física. Bragantia, Campinas, v. 67, n. 4, p. 997-1010, Oct./Dec. 2008.
HAMMERSCHMIDT, U.; ABID, M. Thermophysical properties of a single coffee bean, a single peanut and an IC-Package. International Journal of Thermal Sciences, v. 100, p. 20-28, Feb. 2016.
HERNÁNDEz, J. A.; HEYD, B.; TRYSTRAM, G. Prediction of brightness and surface area kinetics during coffee roasting. Journal of Food Engineering, v. 89, n. 2, p. 156-163, Nov. 2008.
INTERNATIONAL COFFEE ORGANIzATION - ICO. Trade statistics tables, 2017. Available a t : < / / h t t p : / / w w w. i c o . o rg / t r a d e _ s t a t i s t i c s . asp?section=Statistics>. Accessed on: 20 Dec. 2017.
INTERNATIONAL ORGANIzATION FOR
STANDARDIZATION. Green coffee: determination of loss mass at 105°C: ISO 6673:2003. Geneva, 1999. 4 p. JOKANOVIĆ, M. R. et al. Changes of physical properties of coffee beans during roasting. Acta Periodica Technologica, n. 43, p. 21-31, 2012. MENDONÇA, J. C. F.; FRANCA, A. S.; OLIVEIRA, L. S. Physical characterization of non-defective and defective Arabica and Robusta coffees before and after roasting. Journal of Food Engineering, v. 92, n. 4, p. 474-479, June. 2009.
MOHAPATRA, D. RAO, O. S. A thin layer drying model of parboiled wheat. Journal of Food Engineering, v. 66, n. 4, p. 513-518, Feb. 2005.
MOHSENIN, N. N. Thermal properties of foods and agricultural materials. New York: Gordon and Breach Science Publishers, 1980. 407 p. ISBN 0677054505. OLIVEIRA, A. P. L. R. et al. Comparative Study of the Physical and Chemical Characteristics of Coffee and Sensorial Analysis by Principal Components. Food Analytical Methods, v. 8, n. 5, p. 1303-1314, May. 2015. OLIVEIRA, G. H. H. D. et al. Physical characterization of coffee after roasting and grinding. Semina: Ciências Agrárias, v. 35, n. 4, p. 1813-1828, 2014.
OLUKUNLE, O. J.; AKINNULI, B. O. Investigating some engineering properties of coffee seeds and beans. Journal of Emerging Trends in Engineering and Applied Sciences, Centurion, v. 3, n. 5, p. 743-747, Sept./Oct. 2012.
SEGERLIND, Larry J. Applied finite element