Health-Related Inequalities in Life Satisfaction Among the 50+ Population in Europe: Evidence From SHARE
Valérie-Anne Ryser*, France Weaver**, and Judite Gonçalves***
Abstract: Based on the theory of Cumulative (Dis)Advantage over the life course, this study makes three contributions. Using the concentration index, it documents the extent to which life satisfaction (LS) is unequally distributed with respect to health status (HS) in the 50+ population of SHARE. It shows that HS, widowhood and adaptation processes are important factors that correlate significantly with these inequalities in all countries studied. Finally, this study reveals that the 50+ population across Europe experiences cumulative disadvantage, both in terms of HS and LS.
Keywords: health status, life satisfaction, inequalities, cumulative (dis)advantage, SHARE Gesundheitsbezogene Ungleichheiten bezüglich Lebenszufriedenheit in der Bevölkerung 50+ in Europa: Befunde auf der Basis von SHARE
Zusammenfassung: Basierend auf der Theorie der kumulativen Vor- und Nachteile leistet diese Studie drei Beiträge. Mittels des Konzentrations-Indexes dokumentiert sie, inwiefern die Lebens zufriedenheit (LZ) je nach Gesundheitszustand in der Stichprobe von Befragten mit Alter 50+ von SHARE ungleich verteilt ist. Gesundheit, Witwenschaft und Adaptationsprozesse sind wichtige Faktoren, die in allen untersuchten Ländern stark mit diesen Ungleichheiten korrelieren. Die Bevölkerung mit Alter 50+ in Europa weist damit einen kumulativen Nachteil auf, sowohl in Bezug auf die Gesundheit als auch auf die LZ.
Schlüsselwörter: Gesundheitszustand, Lebenszufriedenheit, Ungleichheiten, kumulative Vor- und Nachteile, SHARE
Inégalité de satisfaction avec la vie en fonction du statut de santé au sein de la population âgée de plus de 50 ans vivant en Europe : résultats basés sur l’enquête SHARE
Résumé : Basée sur le modèle théorique des Avantages Désavantages Cumulés, cette étude apporte trois contributions. Utilisant l’indice de concentration, elle documente dans quelle mesure la satisfaction avec la vie (SV) est inégalement distribuée en fonction du statut de santé au sein de la population de SHARE âgée de 50 ans et plus ; elle montre que la santé, le veuvage et les processus d’adaptation sont significativement corrélés à ces inégalités. Finalement elle révèle que cette population cumule des désavantages de santé et de SV.
Mots-clés : statut de santé, satisfaction de vie, inégalités, (dés)avantages cumulés, SHARE
* FORS – Swiss Centre of Expertise in Social Sciences, CH-1015 Lausanne, valerie-anne.ryser@fors.unil.ch.
** Xavier University, Department of Health Services Administration, US-45207 Ohio, weaverf@xavier.edu.
*** Nova Healthcare Initiative, Nova School of Business and Economics, Universidade Nova de Lisboa, PT-1099-032 Lisbon, judite.goncalves@novasbe.pt.
1 Introduction1
The ageing process is characterized by physical and cognitive slowdown (e. g., Cullati et al. 2014), and health issues correlate with and determine life satisfaction (LS) (e. g., Ferrer-i-Carbonell and Frijters 2004; Dolan et al. 2008; Graham 2008; Binder and Coad 2010; Hsu 2012; Gana et al. 2013). However, as individuals become older, health status is characterized by high heterogeneity (Chandola et al. 2007; Mitnitski et al. 2017). At the same age and level of comorbidity, people have different functional profiles, which in turn relate to their LS in various ways (Graham et al. 2011; Freedman et al. 2012; Binder and Coad 2013; van Campen and van Santvoort 2013). Taking into account a life course perspective, specifi-cally the theoretical framework of Cumulative Advantage and Disadvantage (CAD model) over the life course (Merton 1968; Dannefer 1987; Merton 1988; Dannefer 2003)2, the main aim of our study is to document the extent to which individuals who experience health disadvantages are also disadvantaged in terms of LS. Thus, we capture a cumulative double disadvantage in terms of both health status and LS, that is, what we refer to as health-related inequalities in LS. Decomposing these inequalities sheds light on the factors that are associated with them and helps identify vulnerable groups that should be the target of policy interventions aimed at reducing inequalities in Europe.
Using data from the Survey of Health, Ageing, and Retirement in Europe (SHARE), this article estimates the extent to which LS is unequally distributed by health status in the second half of life. These health-related inequalities in LS are based on the concentration index, a generalization of the Gini index. We then decompose these inequalities to show how health status itself as well as socio-economic, demographic, and psycho-social characteristics contribute to them. To our knowledge, this is the first study that addresses these issues.
2 Development and determinants of life satisfaction in the second half of life LS is a subjective process that captures the cognitive dimension of subjective well-being by asking individuals to evaluate their life in general or for specific domains
1 This research was funded by the Leenaards Foundation, grant number 34444/ss. The Swiss School of Public Health Plus and FORS at University of Lausanne provided additional support. The authors would like to thank Erwin Zimmermann for his support, as well as Adam (Zhuo) Chen, Tom van Ourti, and Guido Erreygers for their comments. This paper uses data from SHARE Wave 4 release 1.1.1, as of March 28th 2013 (DOI: 10.6103/SHARE.w4.111) and SHARE Waves 2 release 2.6.0, as of November 29th 2013 (DOI: 10.6103/SHARE.w1.260 and 10.6103/ SHARE.w2.260).
2 The theory of cumulative (dis)advantages introduced initially by Merton (1968; 1988) is defined as “a systematic tendency for interindividual divergence in a given characteristic (e. g. money, health, status) with the passage of time” (Dannefer 2003, 327).
(Diener et al. 1985). It implies a comparison of personal circumstances and a men-tal representation of what is thought to be an appropriate standard (Schwarz and Strack 1999). LS is broadly used in the literature because its validity and reliability are well documented in fields of research, e. g. psychology, sociology, gerontology, or health economics (e. g. Pavot and Diener 1993; Dolan et al. 2008; Krueger and Schkade 2008; Diener et al. 2013). It is particularly important to have a better understanding of the processes that lead to advantages or disadvantages in LS, because LS is a proxy for measuring the quality of the psychological adaptation to the ageing process and is a marker of successful ageing (Baltes and Baltes 1990). Overall, there is very little knowledge about the distribution of LS with respect to health status over the life course and especially at older age. Most of the literature shows the extent to which health is correlated with LS, but does not look at how the distribution of LS is related to health, which is the first aim of our study.
Based on cross-sectional or longitudinal studies, it has been documented that the evolution of LS over the life course is U-shaped (e. g., Blanchflower and Oswald 2008). Middle age (between about 45 and 65 years of age) is often linked to the lowest levels of LS. Then, an increase in LS is observed at older ages (Diener and Suh 1997). It has been shown that people in their sixties have high levels of LS. Finally, there is evidence that a decrease in LS tends to occur in the fourth age (e. g., Mroczek and Spiro 2005).
According to the CAD theoretical model (Dannefer 1987; 2003), LS results from cumulative processes over the life course. Exposure to poor or good circumstances earlier in life, or risk versus protective factors, influence the level of LS differently. Demographic characteristics, socioeconomic status, health status, social interactions and activities, as well as psychological characteristics explain the processes by which social advantages and disadvantages affect LS at different stages in life (Dolan et al. 2008; Stutzer and Frey 2010; Burton-Jeangros and Zimmermann-Sloutskis 2016). In middle age, individuals accumulate a dif-ferent level of constraints: e. g. at the individual level by the professional activity, at the family level by difficulties in combining work and family demands. These constraints impact LS negatively compared to older people who tend to have less constraints. At an older age, individuals who cumulate advantages, such as higher level of education, better physical, psychological and emotional health, or who benefit from social support, also tend to cumulate a higher level of LS (Hsu 2012). In addition, people compare themselves to others. They may have a good or poor self-evaluation using social comparison with their perceived peers (Festinger 1954). Thus, relative measures influence LS as well, in particular relative health or relative income (Clark and Oswald 1996; Kaplan and Baron-Epel 2003; Ferrer-i-Carbonell 2005; Carrieri 2012). Individuals who cumulate perception of better health or think that they are wealthier, compared to their peers, tend to express higher LS (Girardin et al. 2008). The opposite holds for individuals who perceive themselves as being
less healthy or less wealthy than their peers: they tend to cumulate disadvantages and have lower levels of LS.
3 Health during the second half of life and its implication on the distribution of life satisfaction among the older population
Health affects LS to various extent. Health is a generic term that encompasses many different facets, such as diagnoses, mortality risk, functional capacity, subjective health, and frailty3 (Johnson and Wolinsky 1993; Smith et al. 2002; Spini et al. 2007). Overall, the prevalence of chronic conditions and comorbidities – co-occurring disease such as diabetes, cardiovascular disease, osteoarthritis, dementia, or depres-sion – tend to be quite high among the 50+ population and persist at older ages (Barnett et al. 2012; WHO 2014; Weaver 2016).
People with low levels of education tend to cumulate negative outcomes and thus experience health deterioration earlier in their life course, compared to individu-als with higher levels of education (for a review Cullati 2015). The heterogeneity of health status during the ageing process has a gender dimension as well. Women tend to experience more serious health deterioration than their male counterparts. For example, life expectancy with severe disabilities after the age of 80 is twice longer for women that for men, in part because men reaching these ages are typically healthy (Romoren 2001; Romoren and Blekeseaune 2003). Yet, health trajectories are heterogeneous and dynamic: Some studies highlight a linear pattern of degradation (Cullati 2015) whereas others emphasize that health improvements are observed even among the oldest persons (e. g., Borrat-Besson et al. 2013).
The chronic and often irreversible nature of health deterioration impacts LS negatively and persistently (Gana et al. 2013). Typically, both objective and subjec-tive health indicators, such as self-assessed health, medical conditions, or disability, are correlates of LS (Ferrer‐i‐Carbonell and Frijters 2004; Binder and Coad 2010). Each of these measures relate differently to LS. However, all of them tend to de-crease LS when they deteriorate and inde-crease it when they improve. Yet, patterns of health deterioration and their impacts on LS may differ across individuals. This heterogeneity in health will therefore lead to an unequal distribution of LS with respect to health, namely the presence of health-related inequalities in LS. That means that individuals accumulate disadvantages in term of both health and LS.
3 Frailty is defined as a gradual process of cognitive and physical deterioration that affects the reserves in different physiological, sensorimotor and cognitive systems (Spini et al. 2007).
4 Health-related inequalities in life satisfaction: motivations
A large body of cross-sectional and longitudinal studies explored individual LS over time and with age. These LS trajectories reflect both within-person and between-person differences (e. g., Mroczek and Spiro 2005; Schilling 2006; Gerstorf et al. 2008; Berg et al. 2009). Most studies on individual LS are based on a correlative approach (Pinquart and Sörensen 2000), which provides adjusted (based on regres-sion analyses) or unadjusted mean correlations that are relevant only to the “average person” in each study. At the macro level, international comparisons are based mainly on mean estimations of LS by country (Blanchflower and Oswald 2004; Helliwell et al. 2013). Some studies assess the correlation between macro-level inequalities in income and individual LS (Alesina et al. 2004; Schwarze and Härpfer 2007; Rözer and Kraaykamp 2012).
To our knowledge, little attention has been paid to inequalities in LS. Most of the existing estimations concentrate solely on the overall inequalities in LS, that is, the degree to which LS is unequally distributed in the population. Two institutional reports compare inequalities in LS across countries (OECD 2011; Eurofound 2013). They rely on crude or univariate measures of inequalities: the differences in mean LS between the top and bottom percentiles/quintiles of the country distributions and the mean distance in LS between two individuals chosen at random (i. e., equivalent to the Gini index). Weaver and colleagues (2016) also estimate overall inequalities in LS, using a variant of the Gini index. These three studies find that Northern European countries tend to have the lowest inequalities, and Southern countries (e. g., Italy and Spain) have lower inequalities than Germany or Austria, for example. Stevenson and Wolfers (2008) look at the variance of LS across different sociodemographic groups in the United States. One study assesses income-related inequalities in LS, that is, the extent to which LS is unequally dis-tributed by income levels in some European countries (Weaver et al. 2015). So far, no studies have investigated how LS is distributed by health status in the population. The purpose of this study is to fill that gap. The first step is to estimate the extent to which LS is unequally distributed by health status in the ageing populations of twelve European countries. These health-related inequalities in LS are estimated using the concentration index, a generalization of the Gini index. The second step is to decompose these inequalities in order to explain the cumulative advantages or disadvantages of different determinants that contribute to these inequalities: health status itself, socioeconomic status, sociodemographic characteristics, social interac-tions and activities, and psychological characteristics.
This analytical strategy allows us to go beyond the simple variation in LS across individuals, by documenting the extent to which individuals who experience health disadvantages are also disadvantaged in terms of LS. Thus, we capture a double disadvantage in terms of both health status and LS. Decomposing these inequalities
allows identifying factors associated with them and helps detect vulnerable categories of individuals that should be the target of policy interventions aimed at reducing inequalities in Europe.
4.1 Data, sample and method
Our analysis is based on the non-institutionalized population aged 50+ living in the twelve countries participating in W2 and W44 of the Survey of Health, Ageing and Retirement in Europe – SHARE (Börsch-Supan et al. 2013). SHARE
is a multi disciplinary and multi-country panel survey composed of individuals aged 50+ and their spouses, regardless of age. For more information and details regarding the survey sampling design, methodology, and questionnaires refer to http://www.share-project.org.
The two waves are treated as two cross-sections. Only a few individuals are observed two times. This occurs because, to compensate for attrition at W4, refreshment samples were added for nine of the twelve countries participating at W2. Because SHARE is a household survey, in the analysis, the standard errors are adjusted for household-level clustering resulting from observing several individuals nested within households, including individuals observed twice.5 The calibrated cross-section weights are taken into account to obtain nationally representative results for each country.
The twelve countries included in the analyses, organized by type of welfare state (Arts and Gelissen 2002; Bambra 2007), are the following: The central conservative countries include Germany (DE), France (FR), and Switzerland (CH); the central social-democracies are Austria (AT), Belgium (BE), and The Netherlands (NL); the Northern countries comprise Denmark (DK) and Sweden (SE); the Southern ones are Spain (ES) and Italy (IT); and the Eastern European countries are the Czech Republic (CZ), and Poland (PL). Table 1 displays the descriptive statistics for each country. 5 Measures
5.1 Dependent variable
Life satisfaction (LS) is measured on a scale with 11 levels, based on the question:
“On a scale from 0 to 10, where 0 means completely dissatisfied and 10 means completely satisfied, how satisfied are you with your life?” This variable is rescaled to the 0–1 interval to facilitate interpretation (See the Analytical strategy section).
4 W1 does not contain a question on life satisfaction and W3 is a different survey, i. e. SHARELIFE. 5 This strategy is used to disentangle the intra and inter-households variability. This method
assumes that individuals living in the same household share more than individuals living in dif-ferent households.
5.2 Health measures
In order to have one comprehensive measure of health that captures the multiple aspects and dimensions of health, we rely on a continuous latent index (Bound et al. 1999; Jürges 2007; Bonsang 2009; Lindeboom and Kerkhofs 2009). For this latent index, objective and subjective health indicators are taken into account and are used to predict self-reported health6, by estimating an ordered probit model separately by country. These objective and subjective health indicators are:
1. Chronic conditions – long lasting or persistent health issues.
2. Limitations in the activities of daily living and instrumental activities of daily living – two scales that refer to people’s daily self-care activities that measure their functional status.
3. Diagnoses – medical identification of illnesses. 4. Symptoms of health issues.
5. Mental health – a measure or mental illness. 6. Cognition – a measure of mental processes.
7. Grip strength – a measure of the force applied by the hand to pull on or suspend from objects and is a specific part of hand strength.
8. A measure of lung capacity.
All variables have the expected signs and most of them are statistically different from zero (results of the probit model available on request). The latent health status index is standardized to vary between 0 (worst health) and 10 (perfect health).7 The main strengths of this comprehensive measure of health are to include both subjective and objective dimensions that both impact LS (Hilleras et al. 2001; Smith et al. 2002) and to adjust for possible cross-cultural bias across countries. Two binary indicators of Relative health are built: Low relative health and high relative health capture whether individual health is in the bottom or top deciles of the health distribution within the reference group for each individual. The reference group consists of individuals of the same gender, five-year age group, country, and wave.8
6 “Would you say your health is… Excellent; Very good; Good; Fair; Poor.”
7 According to Jürges (2007, p. 2) the basic assumption underlying the analysis is that “there is such thing as a ‘true’ and comparable health status. This implies that one must be willing not to accept the respondent’s own judgements as absolute […]. Conceptually, I consider true health as a continuous, latent (i. e., unobservable) variable. When respondents answer survey questions about their health, they assess their true health (possibly with measurement error […]) and project this value onto the scale provided. Equivalent econometric formulations are the ordered logit or probit models […]. Differences in language use that affect the relationship between true health and self-assessed health can be interpreted as differences in the so-called thresholds or cut points between adjacent health categories.”
8 Education level and region were also considered for creating the reference groups but resulted in some groups with too few observations. In addition, their inclusion did not significantly impact results.
5.3 Sociodemographic variables
Age is categorized in four groups: 50 to 59, 60 to 69, 70 to 79, and 80 and over.
These age groups are interacted with Gender to observe whether the demographic composition of the population explains differences in health-related inequalities in LS across countries (Males 50–59 constitute the reference group).
5.4 Family situation
Marital status is captured by a set of binary indicators of being widowed, divorced/
separated (or married but not living together, partnership dissolution), single, and married (or registered partnership; the reference group). The Number of children is measured by a continuous variable.
5.5 Socioeconomic status
Level of education is measured by an ordered categorical variable based on the
Inter-national Standard Classification of Education (ISCED). Primary education includes incomplete compulsory school, compulsory school, elementary vocational training, domestic science course, and one year school of commerce (reference category);
secondary education includes general training school and apprenticeships; tertiary education combines the higher levels of education up to university degrees. Employ-ment status distinguishes between individuals who are working, unemployed or retired
(the reference category). Income is the household equivalent income; the OCDE equivalence scale is used (www.oecd.org/els/soc/OECD-Note-EquivalenceScales. pdf). It is transformed into a natural logarithmic scale. As for health, we assess whether large differences between the person’s income and income of the reference group, as defined above, are associated with LS. Low relative income and high relative income are binary indicators that capture whether household income is in the bottom or top deciles of the reference group distribution.
5.6 Processes of adaptation
Religious activities is a dichotomous variable that takes value one if the individual
participates in the activities of a religious organization almost every week and zero otherwise.9 Social activities is also a dichotomous variable that takes value one if the individual participates in any of four social activities – volunteering, training courses, political/community-related, or sports-related – and zero otherwise.10 Trust 9 “How often in the past twelve months did you taken part in the activities of a religious organiza-tion (church, synagogue, mosque etc.)? Almost daily; Almost every week; Almost every month; Less often.”
10 “Which of the activities listed on this card – if any – have you done in the past twelve months? Done voluntary or charity work; Attended an educational or training course; Gone to a sports, social or other kind of club; Taken part in a political or community-related organization; Read books, magazines or newspapers; Did word or number games such as crossword puzzles or Sudoku; Played cards or games such as chess; None of these.”
is a continuous variable that measures the extent to which individuals express that most people can be trusted on a scale of 0 to 10.11
5.7 Region of residence
Lastly, we control for Region of residence using the Nomenclature of Territorial Units for Statistics (NUTS). NUTS is a geocode standard developed by the European Union to define the administrative divisions of countries. NUTS allow controlling for local differences, such as different living conditions, social, economic, cultural, and political environment (Arts and Gelissen 2002; Bambra 2007). The number of NUTS varies from 1 to 16 across countries.
5.8 Time trend
Because two waves of data are used, we control for time, using a binary indicator. 6 Analytical strategy
The analysis is conducted separately by country. The estimation procedure is bootstrapped in order to assess the standard errors on the contributions of health status and the other factors to the estimated inequalities (100 iterations). As stated above, the use of calibrated cross-sectional weights provides nationally representa-tive results. Because SHARE is a household survey and the analyses are based on W2 and W4, the standard errors are adjusted for household-level clustering. The analysis is conducted in two steps. First, the health-related inequalities in LS are determined. Second, these inequalities are decomposed to understand the pathways through which health influences them and to determine the overall contribution of health and other factors to the inequalities. The methods employed in this study are commonly used to estimate and decompose all kinds of inequalities (e. g. income-related inequalities in health, or in healthcare services use) (Tubeuf and Jusot 2011; Hajizadeh et al. 2014; Devaux 2015).
6.1 Estimation of health-related inequalities in life satisfaction
The concentration index (CI) is a generalization of the Gini index that provides bivariate measures of inequalities; in other words, the CI reveals the distribution of one variable in the population, according to another variable (Van Doorslaer and Van Ourti 2011; Van Ourti et al. 2014). Here, the CI relates the ranking of indi-viduals according to their health status to the corresponding cumulative distribution of LS in that country. The CI can potentially vary between –1 and 1. A positive
11 “Generally speaking, would you say that most people can be trusted or that you can’t be too careful in dealing with people? Please tell me on a scale from 0 to 10, where 0 means you can’t be too careful and 10 means that most people can be trusted.”
CI shows that higher LS is disproportionately concentrated among persons with better health status, which is what is expected in this study. In contrast, a negative CI would mean that higher LS is disproportionately concentrated among persons with worse health status. A CI = 0 would indicate that all individuals in a country express the same level of LS.12 The larger the absolute value of the CI is, the more pronounced the health-related inequalities in LS are.
As LS is a bounded variable that varies between [0, 1], we estimate the CI as proposed by Erreygers (2009). The CI measures the covariance between LS and the fractional rank13 resulting from ordering individuals from worst to best health status. The exact formula is presented in Weaver et al. (2015).
6.2 Decomposition and contributions
The decomposition of the CI provides two types of results: the pathways through which health status and other factors contribute to health-related inequalities in LS and the contributions of those factors to these inequalities, in percentages. Health and the other factors can influence the CI in two ways. The first pathway consists of the association between health status, the control variables, and LS. This associa-tion is obtained by estimating a linear model of LS as a funcassocia-tion of health status and the other variables presented above. The estimated coefficient on health status can be interpreted as the percentage point variation in LS when health changes by 10 percentage points.
The second pathway captures the overall inequalities in health and the health-related inequalities in each of the selected factors (Erreygers 2009). These inequalities are measured using the generalized concentration index (GCI), which relates the ranking of individuals by health status to the cumulative distributions of health status (GCI[health]) or the other factors. As for any CI, a non-zero GCI indicates that a given variable is unequally distributed across health status. Note that GCI(health) corresponds to the overall inequalities in health status, which is similar to the Gini index, because it relates the ranking of individuals by health status to the cumulative distribution of health status itself.
Once the two pathways are estimated, i. e. the coefficients in the LS model and the GCIs, they are combined to obtain the overall contributions of health status and the other factors to health-related inequalities in LS (for details on the methods refer to Weaver et al. 2016 or Erreygers 2009). These contributions are reported as percentages of the overall health-related inequalities in LS. A positive contribution means that the distribution of health or any other factor in a country exacerbates the
12 The CI also equals zero if the inequalities among the least healthy and the inequalities among the healthiest cancel out.
13 The fractional rank corresponds to an individual’s position in the national distribution of health status, with individuals ranked from the worst to the best health status.
health-related inequalities in LS in that country. A negative contribution indicates that the distribution of the considered factor alleviates those inequalities.
7 Results
7.1 Descriptive statistics
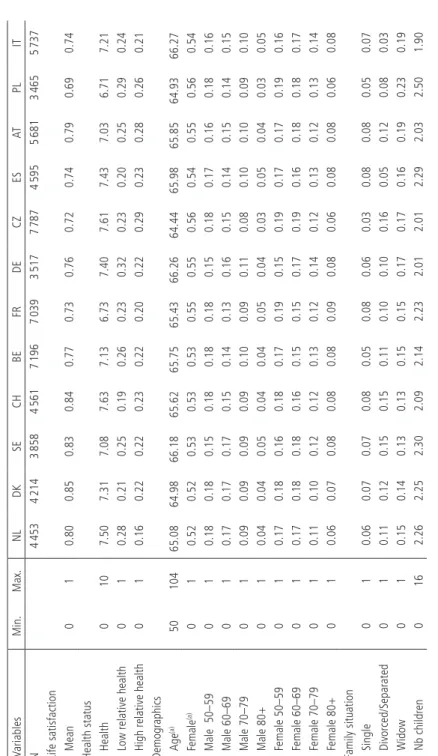
Descriptive statistics of LS and contributing factors are displayed in Table 1. Mean LS is the highest in the Northern countries and CH. Lower mean LS levels are found in the Eastern countries. The highest mean health status levels are found in CH and the CZ, and FR and PL have the worse levels of health status.
The demographic composition of the sample is fairly similar across the twelve countries. However, small differences can be observed in marital status: For example in the Southern countries (IT, ES), the proportion of divorced/separated is lower than in the other countries. Differences can also be observed in the distributions of education and working status. For instance, CH, CZ, ES, PL, and IT have the lowest proportions of individuals who have attained a tertiary level of education. PL is the country where the rate of unemployment among the 50+ individuals is the highest. The Eastern and Southern countries have lower average levels of income. PL is the country where people are the most involved in religious activities. The Eastern and Southern countries have the lowest levels of social participation. Finally, FR is the country where people tend to have the least trust in others.
7.2 Health-related inequalities in life satisfaction
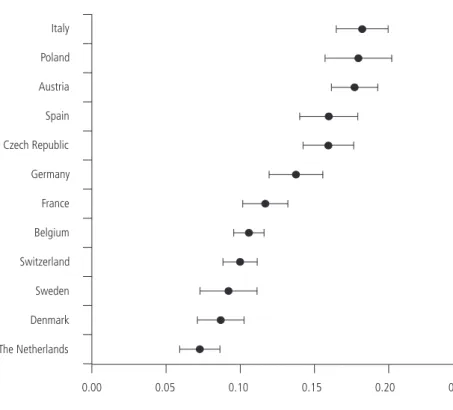
Figure 1 presents the estimated health-related inequalities in LS, ordered by increas-ing level of inequalities. The results reveal that health-related inequalities in LS are statistically significant in all countries. As expected, healthier individuals detain a more-than-proportional share of the total “stock” of LS in every country. The inequalities vary largely across countries: The NL has significantly lower health-related inequalities in LS than most other countries, except DK and SE. The highest health-related inequalities in LS are found in PL and IT.
With the exception of AT, most countries are grouped according to their type of welfare state: The Northern countries (DK, SE) and two of the central social-democracies (BE, NL) have among the lowest health-related inequalities in LS. The central conservative countries (CH, DE, and FR) are in the middle. The Southern countries (ES, IT), the Eastern European countries (CZ, PL), and AT (a central social-democratic country), have higher health-related inequalities.
Table 1
Descriptive statistics by country (SHARE
W2 and W4 combined) V ariables Min. Max. NL DK SE CH BE FR DE CZ ES AT PL IT N 4 453 4 214 3 858 4 561 7 196 7 039 3 517 7 787 4 595 5 681 3 465 5 737
Life satisfaction Mean
0 1 0.80 0.85 0.83 0.84 0.77 0.73 0.76 0.72 0.74 0.79 0.69 0.74
Health status Health
0 10 7.50 7.31 7.08 7.63 7.13 6.73 7.40 7.61 7.43 7.03 6.71 7.21
Low relative health
0 1 0.28 0.21 0.25 0.19 0.26 0.23 0.32 0.23 0.20 0.25 0.29 0.24
High relative health
0 1 0.16 0.22 0.22 0.23 0.22 0.20 0.22 0.29 0.23 0.28 0.26 0.21 Demogr aphics Age (a) 50 104 65.08 64.98 66.18 65.62 65.75 65.43 66.26 64.44 65.98 65.85 64.93 66.27 Female (a) 0 1 0.52 0.52 0.53 0.53 0.53 0.55 0.55 0.56 0.54 0.55 0.56 0.54 Male 50–59 0 1 0.18 0.18 0.15 0.18 0.18 0.18 0.15 0.18 0.17 0.16 0.18 0.16 Male 60–69 0 1 0.17 0.17 0.17 0.15 0.14 0.13 0.16 0.15 0.14 0.15 0.14 0.15 Male 70–79 0 1 0.09 0.09 0.09 0.09 0.10 0.09 0.11 0.08 0.10 0.10 0.09 0.10 Male 80+ 0 1 0.04 0.04 0.05 0.04 0.04 0.05 0.04 0.03 0.05 0.04 0.03 0.05 Female 50–59 0 1 0.17 0.18 0.16 0.18 0.17 0.19 0.15 0.19 0.17 0.17 0.19 0.16 Female 60–69 0 1 0.17 0.18 0.18 0.16 0.15 0.15 0.17 0.19 0.16 0.18 0.18 0.17 Female 70–79 0 1 0.11 0.10 0.12 0.12 0.13 0.12 0.14 0.12 0.13 0.12 0.13 0.14 Female 80+ 0 1 0.06 0.07 0.08 0.08 0.08 0.09 0.08 0.06 0.08 0.08 0.06 0.08
Family situation Single
0 1 0.06 0.07 0.07 0.08 0.05 0.08 0.06 0.03 0.08 0.08 0.05 0.07 Divorced/Separ ated 0 1 0.11 0.12 0.15 0.15 0.11 0.10 0.10 0.16 0.05 0.12 0.08 0.03 Widow 0 1 0.15 0.14 0.13 0.13 0.15 0.15 0.17 0.17 0.16 0.19 0.23 0.19 Nb children 0 16 2.26 2.25 2.30 2.09 2.14 2.23 2.01 2.01 2.29 2.03 2.50 1.90 Continuation of table 1 o n the nex t p ag e.
V ariables Min. Max. NL DK SE CH BE FR DE CZ ES AT PL IT
Socioeconomic status Secondary education
0 1 0.26 0.41 0.31 0.60 0.27 0.33 0.56 0.44 0.10 0.50 0.49 0.24 Tertiary education 0 1 0.25 0.40 0.24 0.13 0.28 0.21 0.28 0.12 0.10 0.23 0.08 0.06 W orking 0 1 0.43 0.42 0.42 0.47 0.32 0.34 0.34 0.30 0.37 0.27 0.21 0.33 Unemployed 0 1 0.09 0.08 0.04 0.04 0.08 0.05 0.07 0.05 0.09 0.03 0.15 0.03 Income 0 238 153 26 516 21 468 22 855 38 282 29 835 24 024 20 975 11 174 13 142 19 732 6 619 14 546
Low relative income
0 1 0.12 0.11 0.13 0.11 0.10 0.10 0.12 0.10 0.11 0.10 0.13 0.12
High relative income
0 1 0.09 0.09 0.09 0.09 0.11 0.11 0.09 0.10 0.10 0.10 0.09 0.09 Processes of ad apta tion Religious activities 0 1 0.10 0.04 0.06 0.09 0.07 0.05 0.07 0.04 0.09 0.08 0.19 0.08 Social activities 0 1 0.61 0.64 0.54 0.54 0.48 0.43 0.42 0.29 0.19 0.37 0.08 0.21 Trust 0 10 6.39 7.43 6.60 6.39 5.35 4.67 5.30 5.68 5.36 5.81 5.14 5.03 Note: (a) Age a
nd female are shown for descriptive purposes;
the inter
actions between age groups and gender enter into the model.
7.3 Decomposition: life satisfaction model
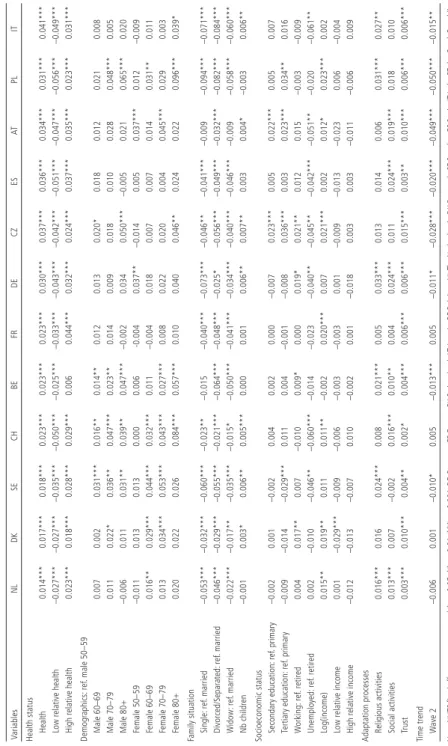
Table 2 summarizes the first pathway through which the selected factors contribute to health-related inequalities in LS: The LS model that gives the correlation between each factor and LS. Results reveal large heterogeneity in these correlations across countries.
As expected, health status is statistically significant and positively correlated with LS in all countries: People tend to cumulate better health and higher LS. Yet, the magnitude of this association varies largely across countries. For example, a 10 percentage point increase in health status is associated with a 1.4 percentage point increase in LS in the NL and with a 4.1 percentage point increase in IT. Also, as expected, low relative health is negatively and significantly associated with LS in all countries. The opposite is observed for high relative health: It is positively and significantly correlated with LS in all countries, except BE.
Figure 1 Health-related inequalities in life satisfaction by country
Health-related inequalities in LS The Netherlands Denmark Sweden Switzerland Belgium France Germany Czech Republic Spain Austria Poland Italy 0.00 0.05 0.10 0.15 0.20 0.25
Table 2 Linear regression. Life satisfaction mo del by coun try V ariables NL DK SE CH BE FR DE CZ ES AT PL IT
Health status Health
0.014*** 0.017*** 0.018*** 0.023*** 0.023*** 0.023*** 0.030*** 0.037*** 0.036*** 0.034*** 0.031*** 0.041***
Low relative health
–0.027*** –0.027*** –0.035*** –0.050*** –0.025*** –0.033*** –0.043*** –0.042*** –0.051*** –0.047*** –0.056*** –0.049***
High relative health
0.023*** 0.018*** 0.028*** 0.029*** 0.006 0.044*** 0.032*** 0.024*** 0.037*** 0.035*** 0.023*** 0.031*** Demogr aphics: ref . male 50–59 Male 60–69 0.007 0.002 0.031*** 0.016** 0.014** 0.012 0.013 0.020* 0.018 0.012 0.021 0.008 Male 70–79 0.011 0.022* 0.036** 0.047*** 0.023** 0.014 0.009 0.018 0.010 0.028 0.048*** 0.005 Male 80+ –0.006 0.011 0.031** 0.039** 0.047*** –0.002 0.034 0.050*** –0.005 0.021 0.065*** 0.020 Female 50–59 –0.011 0.013 0.013 0.000 0.006 -0.004 0.037** –0.014 0.005 0.037*** 0.012 –0.009 Female 60–69 0.016** 0.029*** 0.044*** 0.032*** 0.011 –0.004 0.018 0.007 0.007 0.014 0.031** 0.011 Female 70–79 0.013 0.034*** 0.053*** 0.043*** 0.027*** 0.008 0.022 0.020 0.004 0.045*** 0.029 0.003 Female 80+ 0.020 0.022 0.026 0.084*** 0.057*** 0.010 0.040 0.046** 0.024 0.022 0.096*** 0.039*
Family situation Single:
ref . married –0.053*** –0.032*** –0.060*** –0.023** –0.015 –0.040*** –0.073*** –0.046** –0.041*** –0.009 –0.094*** –0.071*** Divorced/Separ ated: ref . married –0.046*** –0.029*** –0.055*** –0.021*** –0.064*** –0.048*** –0.025* –0.056*** –0.049*** –0.032*** –0.082*** –0.084*** Widow: ref . married –0.022*** –0.017** –0.035*** –0.015* –0.050*** –0.041*** –0.034*** –0.040*** –0.046*** –0.009 –0.058*** –0.060*** Nb children –0.001 0.003* 0.006** 0.005*** 0.000 0.001 0.006** 0.007** 0.003 0.004* –0.003 0.006**
Socioeconomic status Secondary education:
ref . primary –0.002 0.001 –0.002 0.004 0.002 0.000 –0.007 0.023*** 0.005 0.022*** 0.005 0.007 Tertiary education: ref . primary –0.009 –0.014 –0.029*** 0.011 0.004 –0.001 –0.008 0.036*** 0.003 0.023*** 0.034** 0.016 W orking: ref . retired 0.004 0.017** 0.007 –0.010 0.009* 0.000 0.019* 0.021** 0.012 0.015 –0.003 –0.009 Unemployed: ref . retired 0.002 –0.010 –0.046** –0.060*** –0.014 –0.023 –0.040** –0.045** –0.042*** –0.051** –0.020 –0.061** Log(income) 0.015** 0.019** 0.011 0.011** –0.002 0.020*** 0.007 0.021*** 0.002 0.012* 0.023*** 0.002
Low relative income
0.001 –0.029*** –0.009 –0.006 –0.003 –0.003 0.001 –0.009 –0.013 –0.023 0.006 –0.004
High relative income
–0.012 –0.013 –0.007 0.010 –0.002 0.001 –0.018 0.003 0.003 –0.011 –0.006 0.009
Adaptation processes Religious activities
0.016*** 0.016 0.024*** 0.008 0.021*** 0.005 0.033*** 0.013 0.014 0.006 0.031*** 0.027** Social activities 0.013*** 0.007 –0.002 0.016*** 0.010** 0.004 0.024*** 0.011 0.024*** 0.019*** 0.018 0.010 Trust 0.003*** 0.010*** 0.004** 0.002* 0.004*** 0.006*** 0.006*** 0.015*** 0.003** 0.010*** 0.006*** 0.006*** Time trend W ave 2 –0.006 0.001 –0.010* 0.005 –0.013*** 0.005 –0.011* –0.028*** –0.020*** –0.049*** –0.050*** –0.015** Note:
NUTS fixed effects are not reported.*
p ≤ 0.05; ** p ≤ 0.01; *** p ≤ 0.001; DE Germany; FR F rance; CH Switzerland; A T Austria; BE Belgium; NL The Netherlands; DK Denmark; SE Sweden; ES Spain; IT Italy;
The significance and magnitude of the correlations between LS and age/gender differ largely across countries. Generally, women and older people have higher LS com-pared to men aged 50–59, the reference category. Family situation is significantly associated with LS in all countries. Being single, divorced/separated, or widowed, as opposed to being married, is negatively linked to LS. Level of education does not play a significant role, except in CZ and AT, and to a lesser extend in PL and SE. In a few countries, compared to being retired, working is significantly and positively linked to LS (DK, BE, DE, and CZ), and unemployed people express lower LS in about half of the countries (SE, CH, DE, CZ, ES, AT and IT). Household income is significantly and positively associated with LS in seven of the twelve countries. Low relative income is significant only in DE, and high relative income is not sta-tistically significant in any country. Finally, the adaptation processes are stasta-tistically significant and positively correlated with LS in all countries. For example, trusting other people leads to higher levels of LS in all countries. Interestingly, no general patterns can be found across welfare state regimes.
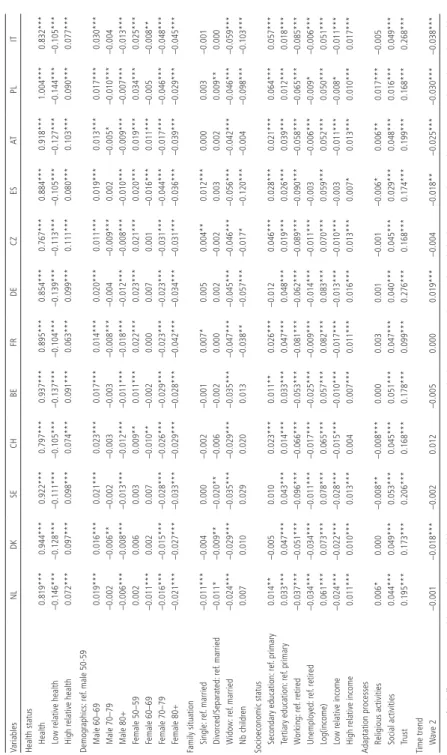
7.4 Decomposition: generalized concentration indices
The second channel through which the selected factors contribute to health-related inequalities in LS is the degree to which they are themselves unequally distributed by health status. Results presented in Table 3 indicate that nearly all factors are unequally distributed by health in all countries. Unsurprisingly, health is largely unequally distributed in all countries, as indicated by the large positive values of the GCI(health). A negative values for GCI(low relative health) means that being in the bottom decile of the health distribution among one’s peers is concentrated among individuals with poor health. Inversely, a positive values for GCI(high
rela-tive health) confirms that being in the top decile of the health distribution among
one’s peers occurs disproportionately among those with better health.
In all countries, males aged 60–69 are more concentrated among individuals with higher health status. Inversely, males 80 plus and females 70 plus are dispro-portionately concentrated among the less healthy individuals. In all countries, widows are disproportionately concentrated among the less healthy individuals.
Those with tertiary education are more concentrated among the healthier in-dividuals. Interestingly, individuals who work tend to be more concentrated among the less healthy segment of the population. As expected, all income variables are unequally distributed by health status. Unsurprisingly, the health-related inequali-ties in income are statistically significant in all countries and are the largest in FR and DE. Low relative income is more concentrated among individuals with poorer health and high relative income is concentrated among individuals with better health. Finally, being socially active and trusting in others are more concentrated among the healthier individuals, as indicated by positive GCIs. Again, health-related inequalities in the selected factors do not exhibit clear patterns by type of welfare state.
Table 3 Gener alized concentr atio n indices with res pe ct to health by country Variables NL DK SE CH BE FR DE CZ ES AT PL IT
Health status Health
0.819*** 0.944*** 0.922*** 0.797*** 0.937*** 0.895*** 0.854*** 0.767*** 0.884*** 0.918*** 1.004*** 0.832***
Low relative health
–0.146*** –0.128*** –0.111*** –0.105*** –0.137*** –0.104*** –0.139*** –0.113*** –0.105*** –0.127*** –0.144*** –0.105***
High relative health
0.072*** 0.097*** 0.098*** 0.074*** 0.091*** 0.063*** 0.099*** 0.111*** 0.080*** 0.103*** 0.090*** 0.077*** Demogr aphics: ref . male 50-59 Male 60–69 0.019*** 0.016*** 0.021*** 0.023*** 0.017*** 0.014*** 0.020*** 0.011*** 0.019*** 0.013*** 0.017*** 0.030*** Male 70–79 –0.002 –0.006** –0.002 –0.003 –0.003 –0.008*** –0.004 –0.009*** 0.002 –0.005* –0.010*** –0.004 Male 80+ –0.006*** –0.008*** –0.013*** –0.012*** –0.011*** –0.018*** –0.012*** –0.008*** –0.010*** –0.009*** –0.007*** –0.013*** Female 50–59 0.002 0.006 0.003 0.009** 0.011*** 0.022*** 0.023*** 0.021*** 0.020*** 0.019*** 0.034*** 0.025*** Female 60–69 –0.011*** 0.002 0.007 –0.010** –0.002 0.000 0.007 0.001 –0.016*** 0.011*** –0.005 –0.008** Female 70–79 –0.016*** –0.015*** –0.028*** –0.026*** –0.029*** –0.023*** –0.023*** –0.031*** –0.044*** –0.017*** –0.046*** –0.048*** Female 80+ –0.021*** –0.027*** –0.033*** –0.029*** –0.028*** –0.042*** –0.034*** –0.031*** –0.036*** –0.039*** –0.029*** –0.045***
Family situation Single:
ref . married –0.011*** –0.004 0.000 –0.002 –0.001 0.007* 0.005 0.004** 0.012*** 0.000 0.003 –0.001 Divorced/Separ ated: ref . married –0.011* –0.009** –0.020** –0.006 –0.002 0.000 0.002 –0.002 0.003 0.002 0.009** 0.000 Widow: ref . married –0.024*** –0.029*** –0.035*** –0.029*** –0.035*** –0.047*** –0.045*** –0.046*** –0.056*** –0.042*** –0.046*** –0.059*** Nb children 0.007 0.010 0.029 0.020 0.013 –0.038** –0.057*** –0.017* –0.120*** –0.004 –0.098*** –0.103***
Socioeconomic status Secondary education:
ref . primary 0.014** –0.005 0.010 0.023*** 0.011** 0.026*** –0.012 0.046*** 0.028*** 0.021*** 0.064*** 0.057*** Tertiary education: ref . primary 0.033*** 0.047*** 0.043*** 0.014*** 0.033*** 0.047*** 0.048*** 0.019*** 0.026*** 0.039*** 0.012*** 0.018*** W orking: ref . retired –0.037*** –0.051*** –0.096*** –0.066*** –0.053*** –0.081*** –0.062*** –0.089*** –0.090*** –0.058*** –0.065*** –0.085*** Unemployed: ref . retired –0.034*** –0.034*** –0.011*** –0.017*** –0.025*** –0.009*** –0.014*** –0.011*** –0.003 –0.006*** –0.009* –0.006*** Log(income) 0.061*** 0.073*** 0.078*** 0.065*** 0.057*** 0.082*** 0.083*** 0.070*** 0.059*** 0.052*** 0.050*** 0.051***
Low relative income
–0.024*** –0.022*** –0.028*** –0.015*** –0.010*** –0.017*** –0.013*** –0.010*** –0.003 –0.011*** –0.008* –0.011***
High relative income
0.011*** 0.010*** 0.013*** 0.004 0.007*** 0.011*** 0.016*** 0.013*** 0.007* 0.013*** 0.010*** 0.017***
Adaptation processes Religious activities
0.006* 0.000 –0.008** –0.008*** 0.000 0.003 0.001 –0.001 –0.006* 0.006** 0.017*** –0.005 Social activities 0.044*** 0.049*** 0.053*** 0.045*** 0.051*** 0.047*** 0.040*** 0.045*** 0.029*** 0.048*** 0.016*** 0.049*** Trust 0.195*** 0.173*** 0.206*** 0.168*** 0.178*** 0.099*** 0.276*** 0.168*** 0.174*** 0.199*** 0.168*** 0.268*** Time trend W ave 2 –0.001 –0.018*** –0.002 0.012 –0.005 0.000 0.019*** –0.004 –0.018** –0.025*** –0.030*** –0.038*** Note:
NUTS fixed effects are not reported.*
p ≤ 0.05; ** p ≤ 0.01; *** p ≤ 0.001. DE Germany; FR F rance; CH Switzerland; A T Austria; BE Belgium; NL The Netherlands; DK Denmark; SE Sweden; ES Spain; IT Italy;
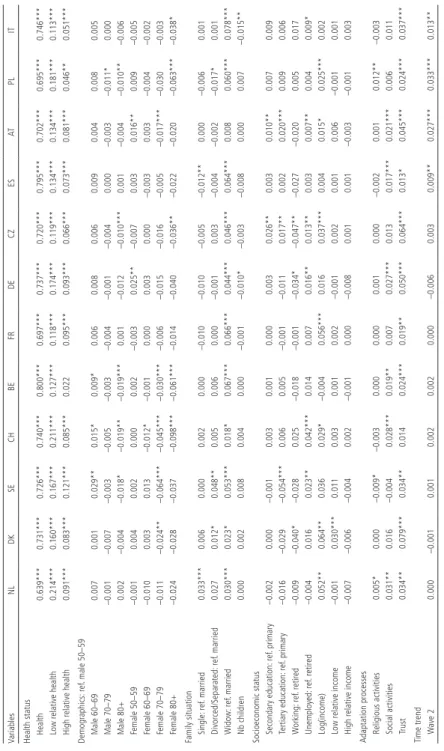
7.5 Overall contributions
The contributions of each factor to the health-related inequalities in LS are obtained by combining the correlations from the LS model (Table 2) and the general con-centration indices (Table 3). These contributions can be found in Table 4 and are reported as percentage of the estimated health-related inequalities in LS.
The three health indicators significantly and largely contribute to health-related inequalities in LS in all countries. The contributions of health status vary from 63.9% in the NL to 80% in BE. These numbers mean that, for instance, in PL the health-related inequalities in LS would be 69.5% lower if health status was not associated with LS or was equally distributed in the population. Such high contributions are attributable to both the strong association of health and LS (Table 2) and the unequal distribution of health in the population (Table 3). In all countries low relative health contributes more to health-related inequalities in LS than high relative health.
Most of the other selected factors contribute to the health-related inequalities in a heterogeneous fashion across countries, if at all. In NL, FR, and ES gender and age do not contribute at all to health-related inequalities in LS. Widowhood is the only family situation indicator that significantly contributes to the health-related inequalities in LS in all countries, except AT. For instance in IT, the health-related inequalities in LS would be 7.8% lower if widowhood was not associated with LS or was equally distributed by health status. Looking at the socioeconomic status, at least one of the indicators significantly contributes to health-related inequalities in LS in all countries, except in BE and ES. Interestingly, whether level of education, working status or income contributes to the inequalities differs by country. Tur-ning to the processes of adaptation, we observe that being socially active or trusting others contributes to the inequalities. For example, trust in others contributes to health-related inequalities in LS in all countries except CH. Again, the magnitude of the contributions varies by country, from 1.3% in ES to 7.9% in DK. Religious activities contribute to a lesser extent to health-related inequalities.
To summarize, three types of factors contribute significantly to health-related inequalities in LS in all countries: health status, widowhood, and the adaptation processes. The sociodemographic and other control variables have heterogeneous contributions across countries. These results highlight that not only the list of significant contributing factors differs largely across countries, but the magnitude of their contributions varies too. Again, no general pattern can be drawn from the grouping of countries into different types of welfare regimes.
Table 4
Contributions in percentages to health-related inequalities in life
satisfaction, by cou ntry Variables NL DK SE CH BE FR DE CZ ES AT PL IT
Health status Health
0.639*** 0.731*** 0.726*** 0.740*** 0.800*** 0.697*** 0.737*** 0.720*** 0.795*** 0.702*** 0.695*** 0.746***
Low relative health
0.214*** 0.160*** 0.167*** 0.211*** 0.127*** 0.118*** 0.174*** 0.119*** 0.134*** 0.134*** 0.181*** 0.113***
High relative health
0.091*** 0.083*** 0.121*** 0.085*** 0.022 0.095*** 0.093*** 0.066*** 0.073*** 0.081*** 0.046** 0.051*** Demogr aphics: ref . male 50–59 Male 60–69 0.007 0.001 0.029** 0.015* 0.009* 0.006 0.008 0.006 0.009 0.004 0.008 0.005 Male 70–79 –0.001 –0.007 –0.003 –0.005 –0.003 –0.004 –0.001 –0.004 0.000 –0.003 –0.011* 0.000 Male 80+ 0.002 –0.004 –0.018* –0.019** –0.019*** 0.001 –0.012 –0.010*** 0.001 –0.004 –0.010** –0.006 Female 50–59 –0.001 0.004 0.002 0.000 0.002 –0.003 0.025** –0.007 0.003 0.016** 0.009 –0.005 Female 60–69 –0.010 0.003 0.013 –0.012* –0.001 0.000 0.003 0.000 –0.003 0.003 –0.004 –0.002 Female 70–79 –0.011 –0.024** –0.064*** –0.045*** –0.030*** –0.006 –0.015 –0.016 –0.005 –0.017*** –0.030 –0.003 Female 80+ –0.024 –0.028 –0.037 –0.098*** –0.061*** –0.014 –0.040 –0.036** –0.022 –0.020 –0.063*** –0.038*
Family situation Single:
ref . married 0.033*** 0.006 0.000 0.002 0.000 –0.010 –0.010 –0.005 –0.012** 0.000 –0.006 0.001 Divorced/Separ ated: ref . married 0.027 0.012* 0.048** 0.005 0.006 0.000 –0.001 0.003 –0.004 –0.002 –0.017* 0.001 Widow: ref . married 0.030*** 0.023* 0.053*** 0.018* 0.067*** 0.066*** 0.044*** 0.046*** 0.064*** 0.008 0.060*** 0.078*** Nb children 0.000 0.002 0.008 0.004 0.000 –0.001 –0.010* –0.003 –0.008 0.000 0.007 –0.015**
Socioeconomic status Secondary education:
ref . primary –0.002 0.000 –0.001 0.003 0.001 0.000 0.003 0.026** 0.003 0.010** 0.007 0.009 Tertiary education: ref . primary –0.016 –0.029 –0.054*** 0.006 0.005 –0.001 –0.011 0.017** 0.002 0.020*** 0.009 0.006 W orking: ref . retired –0.009 –0.040* –0.028 0.025 –0.018 –0.001 –0.034* –0.047** –0.027 –0.020 0.005 0.017 Unemployed: ref . retired –0.004 0.016 0.023** 0.042*** 0.014 0.007 0.016** 0.013** 0.003 0.007** 0.004 0.009* Log(income) 0.052** 0.064** 0.036 0.029* –0.004 0.056*** 0.016 0.037*** 0.004 0.015* 0.025*** 0.002
Low relative income
–0.001 0.030*** 0.011 0.003 0.001 0.002 –0.001 0.002 0.001 0.006 –0.001 0.001
High relative income
–0.007 –0.006 –0.004 0.002 –0.001 0.000 –0.008 0.001 0.001 –0.003 –0.001 0.003
Adaptation processes Religious activities
0.005* 0.000 –0.009* –0.003 0.000 0.000 0.001 0.000 –0.002 0.001 0.012** –0.003 Social activities 0.031** 0.016 –0.004 0.028*** 0.019** 0.007 0.027*** 0.013 0.017*** 0.021*** 0.006 0.011 Trust 0.034** 0.079*** 0.034** 0.014 0.024*** 0.019** 0.050*** 0.064*** 0.013* 0.045*** 0.024*** 0.037*** Time trend W ave 2 0.000 –0.001 0.001 0.002 0.002 0.000 –0.006 0.003 0.009** 0.027*** 0.033*** 0.013** Note:
NUTS fixed effects are not reported.
* p ≤ 0.05; ** p ≤ 0.01; *** p ≤ 0.001. DE Germany; FR F rance; CH Switzerland; A T Austria; BE Belgium; NL The Netherlands; DK Denmark; SE Sweden; ES Spain; IT Italy; CZ the Czech Republic.
8 Conclusion
Based on the theoretical framework of Cumulative Advantage/Disadvantage (CAD) over the life course (Dannefer 1987; 2003; Merton 1968; 1988), this study docu-ments the extent to which individuals who experience health disadvantages are also disadvantaged in terms of LS. Thus, we capture a cumulative disadvantage in terms of both health status and LS.
The estimation of the concentration index (CI) and its decomposition pro-vide several pieces of information. First, health-related inequalities in LS in the 50+ population are significant in all twelve selected European countries. Yet, the levels of these inequalities vary largely across countries. Second, the only factors that systematically contribute to these inequalities in all countries, and lead to higher vulnerability, are health status, widowhood, and the adaption processes. Again, the magnitude of these contributions differs across countries. Third, the demographic, family situation (except widowhood), and socioeconomic factors have heterogeneous contributions; they matter in some countries and not in others. Lastly and interestingly, the level of inequalities is similar in countries with similar welfare state regimes. However, there is no pattern of the contributing factors to these inequalities by type of welfare regime. Overall, the results confirm that there are some similarities across countries, for example, the fact that health is a major contributing factor to inequalities in LS. However, the results also emphasize major differences across countries. Targeting the relevant vulnerable groups may require interventions that are specific to each nation.
Our results demonstrate that the most vulnerable groups of individuals are those who cumulate disadvantaged in LS and also disadvantage in health status, widowhood, and the adaption processes. All three factors play a key role in sha-ping health-related inequalities in LS. Therefore, to limit or reduce health-related inequalities in LS among the baby boomers and the elderly, effective policies should focus on their health status, pay attention to widows, and work on adaptation pro-cesses. Limiting health deterioration and improving the capacity of individuals to adapt to new situation would reduce health-related inequalities in LS.
Our study answers new questions and reveals the vulnerable groups that would benefit from policy intervention aiming at reducing inequalities in Europe. Despite its strengths, this work has some limitations. First, with most of the stu dies on in-equalities, this analysis focuses on correlations. It does not provide causal pathways. For example, there is some evidence that LS impacts health (Binder and Coad 2010; George 2010; Diener and Chan 2011). Thus our study raised the question of the reversed causality that should be addressed in future work, in particular by relying on longitudinal data.
Second, the interdisciplinary perspective of health economics and social psychology is both a strength and a weakness. Each discipline theorizes the concept
of LS differently and focuses on different research questions and analytical chal-lenges. Bridging the two disciplines required some conceptual and methodological compromises that have allowed us to propose unique and innovative ways to address new research questions. Such an approach is promising and could facilitate further explorations. For example, for policy purposes our study raised the importance of conducting similar analyses on other age groups, such as the working age popula-tion or children.
This study is the first to document the extent to which individuals who experi-ence health disadvantages are also disadvantaged in terms of their LS, in other words, health-related inequalities in LS. Understanding such cumulative disadvantages is needed to design policy interventions that are effective at simultaneously improving the health and well-being of the population aged 50+. Furthermore, our results not only validate the importance of conducting this type of analyses separately by country, but more importantly, emphasize the need to think about these inequalities in the national context and to address them at a national rather than a supranational level. 9 References
Alesina, Alberto, Rafael Di Tella, and Robert MacCulloch. 2004. Inequality and Happiness: Are Europeans and Americans Different? Journal of Public Economics 88: 2009–2042.
Arts, Wil and John Gelissen. 2002. Three Worlds of Welfare Capitalism or More? A State-of-the-Art Report. Journal of European Social Policy 12(2): 137–158.
Baltes, Paul B. and Margret M. Baltes. 1990. Successful Aging: Perspectives From the Behavioral Sciences. Cambridge: University Press.
Bambra, Clare. 2007. Going Beyond the Three Worlds of Welfare Capitalism: Regime Theory and Public Health Research. Journal of Epidemiology and Community Health 61(12): 1098–1102. Barnett, Karen, Stewart W. Mercer, Michael Norbury, Graham Watt, Sally Wyke, and Bruce Guthrie.
2012. Epidemiology of Multimorbidity and Implications for Health Care, Research, and Medical Education: A Cross-Sectional Study. Lancet 380(9836): 37–43.
Berg, Anne Ingeborg, Lesa Hoffman, Linda Björk Hassing, Gerald E. McClearn, and Boo Johansson. 2009. What Matters, and What Matters Most, for Change in Life Satisfaction in the Oldest-Old? A Study Over 6 Years Among Individuals 80+. Aging and Mental Health 13(2): 191–201. Binder, Martin and Alex Coad. 2013. “I’m Afraid I Have Bad News for You.” Estimating the Impact of
Different Health Impairments on Subjective Well-Being. Social Science and Medicine 87: 155–167. Binder, Martin and Alex Coad. 2010. An Examination of the Dynamics of Well-Being and Life Events
Using Vector Autoregressions. Journal of Economic Behavior & Organization 76(2): 352–371. Blanchflower, David G. and Andrew J. Oswald. 2008. Is Well-Being U-Shaped Over the Life Cycle?
Social Science & Medicine 66(8): 1733–1749.
Blanchflower, David G. and Andrew J. Oswald. 2004. Well-Being Over Time in Britain and the USA.
Journal of Public Economics 88(7): 1359–1386.
Bonsang, Eric. 2009. Does Informal Care From Children to Their Elderly Parents Substitute for Formal Care in Europe? Journal of Health Economics 28(1): 143–154.
Borrat-Besson, Carmen, Valérie-Anne Ryser, and Boris Wernli. 2013. Transition Between Frailty States. A European Comparison. Pp. 175–186 in Active Ageing and Solidarity Between Generations in
Europe. First Results From SHARE After the Economic Crisis, edited by Axel Börsch-Supan, Martina
Brandt, Howard Litwin, and Guglielmo Weber. Germany: De Gruyter.
Börsch-Supan, Axel, Martina Brandt, Christian Hunkler, Thorsten Kneip, Julie Korbmacher, Frederic Malter, Barbara Schaan, Stephanie Stuck, and Sabrina Zuber. 2013. Data Resource Profile: The Survey of Health, Ageing and Retirement in Europe (SHARE). International Journal of
Epidemiology 42(4): 992–1001.
Bound, John, Michael Schoenbaum, Todd R. Stinebrickner, and Timothy Waidmann. 1999. The Dynamic Effects of Health on the Labor Force Transitions of Older Workers. Labour Economics 6(2): 179–202.
Burton-Jeangros, Claudine and Dorith Zimmermann-Sloutskis. 2016. Life Satisfaction Trajectories of Elderly Women Living in Switzerland: An Age-Period-Cohort Analysis. Ageing & Society 36(1): 106–132.
Carrieri, Vincenzo. 2012. Social Comparison and Subjective Well-Being: Does the Health of Others Matter. Bulletin of Economic Research 64(1): 31–55.
Chandola, Tarani, Jane Ferrie, Amanda Sacker, and Michael Marmot. 2007. Social Inequalities in Self Reported Health in Early Old Age: Follow-up of Prospective Cohort Study. British Medical
Journal 334(7601): 990.
Clark, Andrew E. and Andrew J. Oswald. 1996. Satisfaction and Comparison Income. Journal of Public
Economics 61(3): 359–381.
Cullati, Stéphane. 2015. Socioeconomic Inequalities in Health Trajectories in Switzerland: Are Trajectories Diverging as People Age? Sociology of Health & Illness 37(5): 745–764.
Cullati, Stéphane, Emmanuel Rousseaux, Alexis Gabadinho, Delphine S. Courvoisier, and Claudine Burton-Jeangros. 2014. Factors of Change and Cumulative Factors in Self-Rated Health Trajectories: A Systematic Review. Advances in Life Course Research 19: 14–27.
Dannefer, Dale. 2003. Cumulative Advantage/Disadvantage and the Life Course: Cross-Fertilizing Age and Social Science Theory. The Journals of Gerontology Series B: Psychological Sciences and Social
Sciences 58(6): 327–337.
Dannefer, Dale. 1987. Aging as Intracohort Differentiation: Accentuation, the Matthew Effect, and the Life Course. Sociological Forum 2: 211–236.
Devaux, Marion. 2015. Income-Related Inequalities and Inequities in Health Care Services Utilisation in 18 Selected OECD countries. The European Journal of Health Economics 16(1): 21–33. Diener, Ed and Micaela Y. Chan. 2011. Happy People Live Longer: Subjective Well‐Being Contributes
to Health and Longevity. Applied Psychology: Health and Well‐Being 3(1): 1–43.
Diener, Ed, Robert A. Emmons, Randy J. Larsen, and Sharon Griffin. 1985. The Satisfaction With Life Scale. Journal of Personality Assessment 49(1): 71–75.
Diener, Ed and Mark Eunkook Suh. 1997. Subjective Well-Being and Age: An International Analysis.
Annual Review of Gerontology and Geriatrics 17: 304–324.
Diener, Ed, Ronald Inglehart, and Louis Tay. 2013. Theory and Validity of Life Satisfaction Scales. Social
Indicators Research 112(3): 497–527.
Dolan, Paul, Tessa Peasgood, and Mathew White. 2008. Do We Really Know What Makes Us Happy? A Review of the Economic Literature on the Factors Associated With Subjective Well-Being.
Journal of Economic Psychology 29(1): 94–122.
Erreygers, Guido. 2009. Correcting the Concentration Index. Journal of Health Economics 28(2): 504–515. Eurofound. 2013. Third European Quality of Life Survey. Quality of Life in Europe: Subjective Well-Being.
Ferrer-i-Carbonell, Ada. 2005. Income and Well-Being: An Empirical Analysis of the Comparison Income Effect. Journal of Public Economics 89(5–6): 997–2019.
Ferrer‐i‐Carbonell, Ada and Paul Frijters. 2004. How Important Is Methodology for the Estimates of the Determinants of Happiness? The Economic Journal 114(497): 641–659.
Festinger, Leon. 1954. A Theory of Social Comparison Processes. Human Relation 7(2): 117–140. Freedman, Vicki A., Frank Stafford, Norbert Schwarz, Frederick Conrad, and Jennifer C. Cornman.
2012. Disability, Participation, and Subjective Wellbeing Among Older Couples. Social Science
and Medicine 74(4): 588–596.
Gana, Kamel, Nathalie Bailly, Yaël Saada, Michèle Joulain, Raphaël Trouillet, Catherine Hervé, and Daniel Alaphilippe. 2013. Relationship Between Life Satisfaction and Physical Health in Older Adults: A Longitudinal Test of Cross-Lagged and Simultaneous Effects. Health Psychology 32(8): 896–904. George, Linda K. 2010. Still Happy After All These Years: Research Frontiers on Subjective Well-Being in Later Life. The Journals of Gerontology Series B: Psychological Sciences and Social Sciences 65B(3): 331–339.
Gerstorf, Denis, Nilam Ram, Ryne Eastbrook, Jürgen Schupp, Gert G. Wagner, and Ulman Lindenberger. 2008. Life Satisfaction Shows Terminal Decline in Old Age: Longitudinal Evidence From the German Socioeconomic Panel Study (SOEP). Developmental Psychology 44(4): 1148–1159. Girardin, Myriam, Dario Spini, and Valérie-Anne Ryser. 2008. The Paradox of Well-Being in Later Life:
Effectiveness of Downward Social Comparison During the Frailty Process. Pp. 129–142 in The
Closing Chapters of Long Lives, edited by Edith Guilley and Christian Lalive d’Epinay. New York:
Nova Science Publishers.
Graham, Carol. 2008. Happiness and Health: Lessons – and Questions – for Public Policy. Health
Affairs 27(1): 72–87.
Graham, Carol, Lucas Higuera, and Eduardo Lora. 2011. Which Health Conditions Cause the Most Unhappiness? Health Economics 20(12): 1431–1447.
Hajizadeh, Mohammad, M. Karen Campbell, and Sisira Sarma. 2014. Socioeconomic Inequalities in Adult Obesity Risk in Canada: Trends and Decomposition Analyses. The European Journal of
Health Economics 15(2): 203–221.
Helliwell, John F., Richard Layard, and Jeffrey Sachs. 2013. World Happiness Report 2013. New York: Sustainable Development Solutions Network. A Global Initiative for the United Nations. Hilleras, Pernilla. K., Hedda Aguero-Torres, and Bengt Winblad. 2001. Factors Influencing Well-Being
in the Elderly. Current Opinion in Psychiatry 14(4): 361–365.
Hsu, Hui-Chuan. 2012. Trajectories and Covariates of Life Satisfaction Among Older Adults in Taiwan.
Archives of Gerontology and Geriatrics 55(1): 210–216.
Johnson, Robert J. and Fredric D. Wolinsky. 1993. The Structure of Health Status Among Older Adults: Disease, Disability, Functional Limitation, and Perceived Health. Journal of Health and Social
Behavior 34(2): 105–121.
Jürges, Hendrik. 2007. True Health vs. Response Styles: Exploring Cross-Country Differences in Self-Reported Health. Health Economics 16(2): 163–178.
Kaplan, Giora and Orna Baron-Epel. 2003. What Lies Behind the Subjective Evaluation of Health Status? Social Science & Medicine 56(8): 1669–1676.
Krueger, Alan B. and David A. Schkade. 2008. The Reliability of Subjective Well-Being Measures. Journal
of Public Economics 92(8): 1833–1845.
Lindeboom, Maarten and Marcel Kerkhofs. 2009. Health and Work of the Elderly: Subjective Health Measures, Reporting Errors, and Endogeneity in the Relationship Between Health and Work.
Journal of Applied Econometrics 24(6): 1024–1046.
Merton, Robert K. 1988. The Matthew Effect in Science, II: Cumulative Advantage and the Symbolism of Intellectual Property. isis 79(4): 606–623.
Merton, Robert K. 1968. The Matthew Effect in Science. Science 159(3810): 56–63.
Mitnitski, Arnold, Susan E. Howlett, and Kenneth Rockwood. 2017. Heterogeneity of Human Aging and Its Assessment. The Journals of Gerontology Series A: Biological Sciences and Medical Sciences 72(7): 877–884.
Mroczek, Daniel K. and Avron Spiro. 2005. Change Life Satisfaction During Adulthood: Findings From the Veterans Affairs Normative Aging Study. Journal of Personality and Social Psychology 88(1): 189–202.
OECD. 2015. How’s Life? Measuring Well-Being. in OECD Publishing, Paris. http://dx.doi. org/10.1787/9789264121164-en (07.02.2017).
Pavot, William and Ed Diener. 1993. Review of the Satisfaction With Life Scale. Psychological Assessment 5(2): 164–172.
Pinquart, Martin and Sylvia Sörensen. 2000. Influences of Socioeconomic Status, Social Network, and Competence on Subjective Well-Being in Later Life: A Meta-Analysis. Psychology and Aging 15(2): 187–224.
Romoren, Tor I. 2001. Last Years of Long Lives. London: Routledge.
Romoren, Tor I. and Morten Blekeseaune. 2003. Trajectories of Disability Among the Oldest Old.
Journal of Aging and Health 15(3): 548–566.
Rözer, Jesper and Gerbert Kraaykamp. 2012. Income Inequality and Subjective Well-Being: A Cross-National Study on the Conditional Effects of Individual and Cross-National Characteristics. Social
Indicators Research 113: 1009–1023.
Schilling, Karl Olivier. 2006. Development of Life Satisfaction in Old Age: Another View on the “Paradox.” Social Indicators Research 75(2): 241–271.
Schwarz, Norbert and Fritz Strack. 1999. Reports of Subjective Well-Being: Judgmental Processes and Their Methodological Implications. Pp. 61–84 in Well-Being: The Foundations of Hedonic Psychology, edited by Daniel Kahneman, Ed Diener, and Norbert Schwarz. New York: Russell Sage Foundation. Schwarze, Johannes and Marco Härpfer. 2007. Are People Inequality Averse, and Do They Prefer
Redistribution by the State? Evidence From German Longitudinal Data on Life Satisfaction.
Journal of Socio-Economics 36(2): 233–249.
Smith, Jacqui, Markus Borchelt, Heiner Maier, and Daniela Jopp. 2002. Health and Well-Being in the Young Old and Oldest Old. Journal of Social Issues 58(4): 715–732.
Spini, Dario, Paolo Ghisletta, Edith Guilley, and Christian Lalive d’Epinay. 2007. Frail Elderly. Pp. 572–579 in Encyclopedia of Gerontology, edited by James E. Birren. Oxford, UK: Elsevier. Stevenson, Betsey and Justin Wolfers. 2008. Happiness Inequality in the United States. Pp. 1–42 in
NBER working paper 14220. Cambridge MA.
Stutzer, Alois and Bruno S. Frey. 2010. Recent Advances in the Economics of Individual Subjective Well-Being. Social Research 77(2): 679–714.
Tubeuf, Sandy and Florence Jusot. 2011. Social Health Inequalities Among Older Europeans: The Contribution of Social and Family Background. The European Journal of Health Economics 12(1): 61–77.
van Campen, Cretien and Marc van Santvoort. 2013. Explaining Low Subjective Well-Being of Persons With Disabilities in Europe: The Impact of Disability, Personal Resources, Participation and Socio-Economic Status. Social Indicators Research 111(3): 839–854.
Van Doorslaer, Eddy and Tom Van Ourti. 2011. Measuring Inequality and Inequity in Health and Health Care. Pp. 837–869 in Oxford Handbook on Health Economics, edited by Sherry Glied and Peter C. Smith. Oxford: Oxford University.
Van Ourti, Tom, Guido Erreygers, and Philip Clarke. 2014. Measuring Equality and Equity in Health and Health Care. Pp. 234–239 in Encyclopedia of Health Economics, edited by Anthony Culyer. San Diego: Elsevier.
Weaver, France. 2016. Trajectoire sur dix ans des personnes atteintes de maladie chronique. Obsan
Dossier 54. Neuchâtel: Obsan.
Weaver, France, Judite Gonçalves, and Valérie-Anne Ryser. 2016. The Contribution of Health to the Inequalities in Subjective Well-Being of the 50+ Population in Europe. Working Paper. Harrisonburg, VA: James Madison University.
Weaver, France, Judite Gonçalves, and Valérie-Anne Ryser. 2015. Socioeconomic Inequalities in Subjective Well-Being Among the 50+: Contributions of Income and Health. Working Paper Series. Geneva: School of Economics and Management.
WHO. 2014. Global Status Report on Noncommunicable Diseases. WHO Library