Sc i e n t i f i c P u b l i c a t i o n N o . 3 6 4
. . . .
i n
t h
e
A
m
e
r i c
a
s
1 9 7 3 - 1 9 7 6
Sci e n t i f i c Pu b l i ca t i o n N o .
364
PA N A M ER I C A N H EA LT H O R G A N I Z A T I O N
Pa n A m e r i ca n Sa n i t a r y Bu r e a u , Re g i o n a l O f f i ce o f t he
W O R LD H EA LT H O R G A N I Z A T I O N
525
Tw e n t y - Th ir d St r e e t , N .W .
W a sh i n g t o n , D .C.
20037
, U SA
IN T R O D U C T IO N
. . . ...
ix
C H A P T E R I .
P O P U L A T IO N ...
1
P o p u la tio n g r o w th ...
1
U rb a n -ru ra l d is trib u tio n ...
2
Age d is tr ib u tio n ... ... ...
3
D e pe nd en cy r a t io ... ...
4
E d u c a t io n ...
5
E c o n o m ic g r o w th ...
5
F ig u r e s ...
7
C H A P T E R I I .
V I T A L S T A T IS T IC S ...
12
N a ta lity tre n d s ...
12
C ru d e b irth r a t e s ...
12
F e r tility ra tes...
13
L ife e x p e c ta n c y ...
13
M o r ta lity t r e n d s ...
14
C ru d e d e a th ra te s ...
14
A ge -ad ju sted de ath ra te s ...
15
M o r ta lity b y c a u s e ...
15
P rin c ip a l causes o f d e a th ...
16
C h ild m o r ta lit y ...
20
M o r ta lity am ong c h ild re n un d er
1
y e a r of a g e ...
20
M o r ta lity u n d e r
5
years o f age b y c a u s e ...
21
F ig u r e s ... ...
22
C H A P T E R I I I .
C O M M U N IC A B L E D IS E A S E S ...
50
Diseases subject to th e In te rn a tio n a l H e a lth R e g u la tio n s ...
50
P la g u e ...
51
Y e llo w F e v e r ... ...
52
Diseases subject to in te rn a tio n a l s u rv e illa n c e ...
52
In f lu e n z a ...
52
Lo u se-b orne relapsing fe v e r ...
53
Lo u se-b orne ty p h u s ...
53
M a la r ia ...
53
Diseases p re v e n ta b le b y va c c in e s ...
54
D ip h th e r ia , tetanus, a n d w h o o p in g c o u g h ...
54
M e a s le s ...
56
P o lio m y e litis ...
58
T u b e rc u lo s is ...
59
E n te ric in fe c tio n s ...
61
D ia rrh e a l diseases...
61
D y s e n te ry , b a c illa ry ...
62
T y p h o id f e v e r ...
62
P a g e
P R E F A C E
... ...
v i i
V e n e re a l diseases...
63
G onococcal in fe c tio n s ...
63
S y p h ilis ...
63
O th e r c o m m u n ic a b le diseases...
64
C hagas’ disease...
64
D e n g u e ...
64
E n c e p h a litis , v i r a l ...
65
H e p a titis ...
66
L e p ro s y ...
67
Y a w s ...
68
Zo o no ses...
69
A n t h r a x ...
69
B ru c e llo s is ... ...
69
H y d a tid o s is ...
69
Le p to s p iro s is ...
69
R a b ie s ...
70
F ig u r e s ...
72
C H A P T E R I V .
H E A L T H S E R V IC E S ...
91
H e a lth e x p e n d itu re s ...
91
In s titu tio n a l o u tp a tie n t services...
91
F ig u r e s ...
96
C H A P T E R V .
H O S P IT A L S E R V IC E S ...
99
Types o f h os pitals...
99
O w n e rs h ip ...
100
H o s p ita l s i z e ...
100
U tiliz a tio n o f h o s p ita ls ...
101
F ig u r e s ...
102
C H A P T E R V I .
E N V IR O N M E N T A L H E A L T H ...
113
W a te r s u p p ly ...
113
Sew erage system s...
114
F ig u r e s ...
115
C H A P T E R V I I .
H U M A N R E S O U R C E S ...
118
Physicians...
118
N ursin g personn el...
119
D e n tis ts ...
120
Diagnosis and tre a tm e n t support p e rs o n n e l...
121
O th e r p u b lic h e a lth personnel a n d c o m m u n ity resourc es..
121
E d u c a tio n and tr a in in g ...
121
P a g e
F i g u r e s ... 1 2 3
1 C e n s u s e s i n t h e A me r i c a s a r o u n d 1 9 6 0 a n d 1 9 7 0 w i t h A n n u a l R a t e o f I n c r e a s e f o r 1 9 5 0 - 1 9 5 5 ,
1 9 6 0 - 1 9 6 5 a n d 1 9 7 0 - 1 9 7 5 . . . 1 2 8 2 Mi d y e a r P o p u l a t i o n E s t i ma t e s ( i n t h o u s a n d s ) f o r Co u n t r i e s i n t h e A me r i c a s , 1 9 6 6 - 1 9 7 6 . . . 1 2 9 3 P e r c e n t a g e Di s t r i b u t i o n o f P o p u l a t i o n b y S e x a n d A g e A c c o r d i n g t o R e c e n t C e n s u s e s i n t h e
A m e r i c a s . . . 1 3 0 4 R a t i o o f S t u d e n t s E n r o l l e d i n P r i ma r y a n d S e c o n d a r y S c h o o l s a n d i n Un i v e r s i t i e s t o P o p u l a t i o n
i n C o r r e s p o n d i n g A g e G r o u p s b y C o u n t r y , a r o u n d 1 9 6 0 a n d L a t e s t Y e a r A v a i l a b l e . . . 1 3 1
A n n e x I I
1 N u m b e r o f L i v e Bi r t h s w i t h Ra t e s p e r 1 , 0 0 0 P o p u l a t i o n , b y C o u n t r y , 1 9 6 0 , 1 9 7 0 , a n d
1 9 7 2 - 1 9 7 5 1 3 2
2 N u m b e r o f D e a t h s w i t h R a t e s p e r 1 , 0 0 0 P o p u l a t i o n , b y C o u n t r y 1 9 6 0 , 1 9 7 0 , a n d 1 9 7 2 - 1 9 7 5 . . 1 3 3 3 N u m b e r o f D e a t h s f r o m Sp e c i f i c C a u s e s w i t h C r u d e a n d A g e - A d j u s t e d D e a t h R a t e s p e r
1 0 0 , 0 0 0 P o p u l a t i o n . . . 1 3 4 4 a. N u m b e r o f D e a t h s b y A g e a n d Se x , b y C o u n t r y . . . 1 6 2
b . C r u d e , A g e - a d j u s t e d a n d Ag e - s p e c i f i c D e a t h R a t e s p e r 1 , 0 0 0 P o p u l a t i o n b y S e x a n d b y
C o u n t r y ( Al l C a u s e s ) . . . 1 6 3 C r u d e , A g e - a d j u s t e d a n d A g e - s p e c i f i c D e a t h Ra t e s p e r 1 0 0 , 0 0 0 P o p u l a t i o n , b y S e x a n d
b y C o u n t r y ( Se l e c t e d C a u s e s ) . . . 1 6 5 5 Fi r s t F i v e Pr i n c i p a l C a u s e s o f D e a t h w i t h Ra t e s p e r 1 0 0 , 0 0 0 P o p u l a t i o n , b y A g e a n d Se x ,
b y C o u n t r y . . . 2 0 5
6
N u m b e r o f Ma t e r n a l D e a t h s w i t h Ra t e s p e r 1 0 , 0 0 0 L i v e Bi r t h s , b y C o u n t r y , 1 9 6 0 , 1 9 7 0 ,a n d 1 9 7 2 - 1 9 7 5 . . . 2 4 7 7 N u m b e r o f I n f a n t D e a t h s w i t h Ra t e s p e r 1 , 0 0 0 L i v e Bi r t h s , b y C o u n t r y , 1 9 6 0 , 1 9 7 0 , a n d
1 9 7 2 - 1 9 7 5 . . . - 2 4 8
8
N u m b e r o f D e a t h s a m o n g C h i l d r e n U n d e r 5 Y e a r s w i t h Ra t e s p e r 1 , 0 0 0 P o p u l a t i o n , b yA g e a n d b y C o u n t r y . . . 2 4 9 9 N u m b e r o f D e a t h s 1 - 4 Y e a r s o f A g e w i t h Ra t e s p e r 1 , 0 0 0 P o p u l a t i o n , b y C o u n t r y , 1 9 6 0 ,
1 9 7 0 a n d 1 9 7 2 - 1 9 7 5 . . . 2 5 1 1 0 N u m b e r a n d P e r c e n t a g e o f D e a t h s U n d e r 5 Y e a r s o f A g e , U n d e r 1 a n d 1 - 4 Ye a r s , b y C o u n t r y ,
a r o u n d 1 9 7 6 . . . 2 5 2
A n n e x I I I
1 R e p o r t e d Ca s e s o f A me b i a s i s a n d Ba c i l l a r y D y s e n t e r y w i t h Ra t e s p e r 1 0 0 , 0 0 0 P o p u l a t i o n ,
b y C o u n t r y , 1 9 7 3 - 1 9 7 6 . . . 2 5 4 2 R e p o r t e d Ca s e s o f Ba c i l l a r y Dy s e n t e r y , w i t h Ra t e s p e r 1 0 0 , 0 0 0 P o p u l a t i o n , b y C o u n t r y ,
1 9 6 8 - 1 9 7 6 . . . 2 5 7 3 R e p o r t e d Ca s e s a n d D e a t h s f r o m D i p h t h e r i a w i t h Ra t e s p e r 1 0 0 , 0 0 0 P o p u l a t i o n , b y C o u n t r y ,
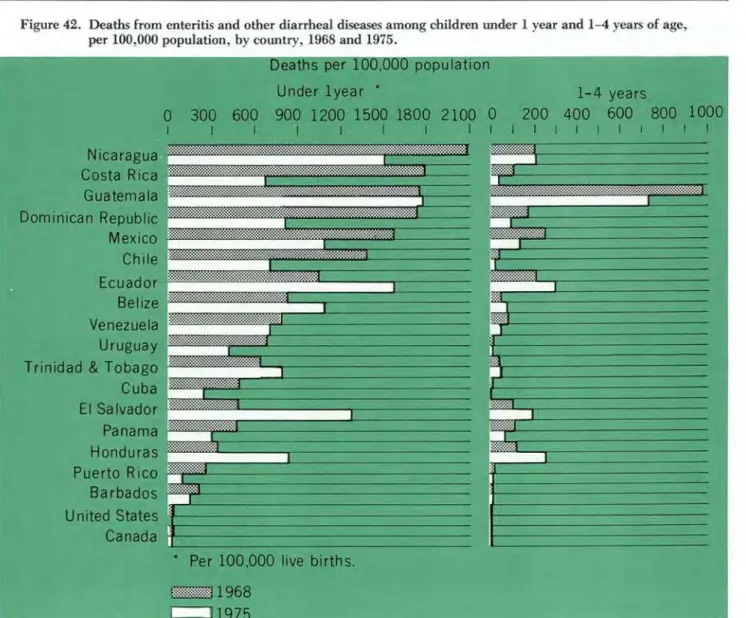
1 9 7 3 - 1 9 7 6 . . . 2 5 8 4 N u m b e r a n d P e r c e n t a g e o f D e a t h s f r o m En t e r i t i s a n d O t h e r Di a r r h e a l Di s e a s e s a m o n g
Ch i l d r e n U n d e r 5 Y e a r s o f A g e , U n d e r 1 a n d 1 - 4 Y e a r s o f A g e , w i t h Ra t e s p e r 1 0 0 , 0 0 0
P o p u l a t i o n , 1 9 6 8 a n d 1 9 7 5 . . . 2 6 1 5 R e p o r t e d Ca s e s a n d D e a t h s f r o m Go n o c o c c a l I n f e c t i o n s w i t h Ra t e s p e r 1 0 0 , 0 0 0 P o p u l a t i o n ,
b y C o u n t r y , 1 9 7 3 - 1 9 7 6 . . . 2 6 2
6
R e p o r t e d Ca s e s a n d D e a t h s f r o m I n f e c t i o u s He p a t i t i s w i t h Ra t e s p e r 1 0 0 , 0 0 0 P o p u l a t i o n ,b y C o u n t r y , 1 9 7 3 - 1 9 7 6 . . . 2 6 4 7 R e p o r t e d Ca s e s a n d D e a t h s f r o m I n f l u e n z a w i t h Ra t e s p e r 1 0 0 , 0 0 0 P o p u l a t i o n , b y C o u n t r y ,
1 9 7 3 - 1 9 7 6 . . . 2 6 6
8
R e p o r t e d Ca s e s a n d D e a t h s f r o m L e p r o s y w i t h Ra t e s p e r 1 0 0 , 0 0 0 P o p u l a t i o n , b y C o u n t r y ,1 9 7 3 - 1 9 7 6 . . . 2 6 8 9 R e p o r t e d Ca s e s a n d D e a t h s f r o m Ma l a r i a w i t h Ra t e s p e r 1 0 0 , 0 0 0 P o p u l a t i o n , b y C o u n t r y ,
1 9 7 3 - 1 9 7 6 . . . 2 7 0 1 0 R e p o r t e d Ca s e s a n d D e a t h s f r o m Me a s l e s w i t h R a t e s p e r 1 0 0 , 0 0 0 P o p u l a t i o n , b y C o u n t r y ,
1 9 7 3 - 1 9 7 6 . . . 2 7 2
A n n e x I
P a g e
1 1 Re p o r t e d C a s e s a n d D e a t h s f r o m A c u t e Po l i o my e l i t i s w i t h Ra t e s p e r 1 0 0 , 0 0 0 P o p u l a t i o n ,
b y C o u n t r y , 1 9 7 3 - 1 9 7 6 . . . 2 7 4 1 2 R e p o r t e d C a s e s a n d D e a t h s f r o m Sy p h i l i s w i t h Ra t e s p e r 1 0 0 , 0 0 0 P o p u l a t i o n , b y C o u n t r y ,
1 9 7 3 - 1 9 7 6 . . . 2 7 6 1 3 R e p o r t e d C a s e s a n d D e a t h s f r o m T e t a n u s w i t h R a t e s p e r 1 0 0 , 0 0 0 P o p u l a t i o n , b y C o u n t r y ,
1 9 7 3 - 1 9 7 6 . . . 2 7 8 1 4 R e p o r t e d C a s e s a n d D e a t h s f r o m T u b e r c u l o s i s w i t h R a t e s p e r 1 0 0 , 0 0 0 P o p u l a t i o n , b y C o u n t r y ,
1 9 7 3 - 1 9 7 6 . 2 8 0
1 5 R e p o r t e d C a s e s a n d D e a t h s f r o m T y p h o i d F e v e r w i t h Ra t e s p e r 1 0 0 , 0 0 0 P o p u l a t i o n , b y
C o u n t r y , 1 9 7 3 - 1 9 7 6 . . . 2 8 2 1 6 R e p o r t e d C a s e s a n d D e a t h s f r o m Wh o o p i n g C o u g h w i t h R a t e s p e r 1 0 0 , 0 0 0 P o p u l a t i o n ,
b y C o u n t r y , 1 9 7 3 - 1 9 7 6 . . . 2 8 4 1 7 R e p o r t e d C a s e s o f R a b i e s i n A n i ma l s , N u m b e r o f P e r s o n s Bi t t e n b y A n i ma l s a n d N u m b e r
Re c e i v i n g P r o p h y l a c t i c T r e a t me n t , b y C o u n t r y , 1 9 7 5 . . . 2 8 6
A n n e x I V
1 T o t a l G o v e r n m e n t E x p e n d i t u r e s a n d E x p e n d i t u r e s f o r He a l t h , b y A r e a , 1 9 7 6 o r Mo s t R e c e n t Y e a r . . . 2 8 7 2 H e a l t h E s t a b l i s h me n t s w i t h Ou t p a t i e n t Se r v i c e s , b y A r e a , a r o u n d 1 9 7 6 . . . 2 8 8
A n n e x V
1 N u m b e r o f Ho s p i t a l s b y T y p e i n t h e A me r i c a s , b y C o u n t r y , a r o u n d 1 9 7 6 . . . 2 8 9 2 N u m b e r o f Ho s p i t a l B e d s b y T y p e o f Ho s p i t a l w i t h Ra t i o s p e r 1 , 0 0 0 P o p u l a t i o n , b y C o u n t r y ,
a r o u n d 1 9 7 6 . . . 2 9 0 3 N u m b e r a n d P e r c e n t a g e Di s t r i b u t i o n o f Ho s p i t a l s b y O w n e r s h i p , b y C o u n t r y , a r o u n d 1 9 7 6 . . . 2 9 1 4 N u m b e r a n d P e r c e n t a g e Di s t r i b u t i o n o f Ho s p i t a l B e d s b y O w n e r s h i p , b y C o u n t r y ,
a r o u n d 1 9 7 6 . . . 2 9 2 5 N u m b e r a n d P e r c e n t a g e Di s t r i b u t i o n o f Sh o r t - s t a y Ho s p i t a l s b y Ho s p i t a l Si z e , b y C o u n t r y ,
a r o u n d 1 9 7 6 . . . 2 9 3
6
N u m b e r a n d P e r c e n t a g e Di s t r i b u t i o n o f Sh o r t - s t a y Ho s p i t a l B e d s b y Ho s p i t a l Si z e , b y C o u n t r y ,a r o u n d 1 9 7 6 . . . 2 9 4 7 N u m b e r o f D i s c h a r g e s a n d Pa t i e n t D a y s f o r Al l Ho s p i t a l s a n d Sh o r t - s t a y Ho s p i t a l s w i t h Ra t i o s
p e r 1 0 0 P o p u l a t i o n , b y C o u n t r y , a r o u n d 1 9 7 6 . . . 2 9 5
8
I n d i c e s o f Ut i l i z a t i o n o f Sh o r t - s t a y Ho s p i t a l s i n t h e A me r i c a s , b y O w n e r s h i p , a r o u n d 1 9 7 6 . . . . 2 9 6 9 I n d i c e s o f Ut i l i z a t i o n o f Sh o r t - s t a y Ho s p i t a l s i n t h e A me r i c a s , b y Si z e o f Ho s p i t a l ,a r o u n d 1 9 7 6 . . . 3 0 0 1 0 N u m b e r o f Ho s p i t a l Di s c h a r g e s b y Di a g n o s i s a n d b y A g e . . . 3 0 1
A n n e x V I
1 N u m b e r a n d P e r C e n t o f P o p u l a t i o n S e r v e d b y P i p e d Wa t e r S u p p l y S y s t e ms i n L a t i n A me r i c a , 1 9 7 7 o r Mo s t R e c e n t Y e a r A v a i l a b l e . . . 3 2 0 2 N u m b e r a n d P e r C e n t o f P o p u l a t i o n S e r v e d b y S e w e r a g e S y s t e ms i n L a t i n A me r i c a , 1 9 7 7
o r Mo s t R e c e n t Y e a r A v a i l a b l e . . . 3 2 1
A n n e x V I I
1 N u m b e r o f Ph y s i c i a n s , Nu r s e s a n d N u r s i n g Au x i l i a r i e s , w i t h Ra t i o s p e r 1 0 , 0 0 0 P o p u l a t i o n ,
b y A r e a , a r o u n d 1 9 7 6 . . . 3 2 2 2 Di s t r i b u t i o n o f P h y s i c i a n s b y Sp e c i a l t y , b y A r e a , a r o u n d 1 9 7 6 . . . 3 2 3 3 S u p p o r t i n g P e r s o n n e l f o r Di a g n o s i s a n d T r e a t me n t , 1 9 7 6 o r Mo s t R e c e n t Y e a r . . . 3 2 4 4 P u b l i c H e a l t h P e r s o n n e l a n d R u r a l C o m m u n i t y Re s o u r c e s , 1 9 7 6 o r Mo s t R e c e n t Y e a r . . . 3 2 5
P a g e
Health Conditions in the Americas,
1973- 1976 is th e s e v e n th in a series o n th e
s u b je c t p r e p a r e d f o r successive P a n A m e r ic a n S a n ita r y C o n fe re n c e s . I t is b a s e d o n
d a ta s u b m itte d b y th e G o v e rn m e n ts o f th e A m e ric a s a n d w o u ld n o t h a v e b e e n
p o s sib le w it h o u t th e s u p p o rt a n d c o lla b o r a tio n o f th e M in is te rs o f H e a lt h , a n d th e
c o n tin u e d d e d ic a tio n a n d e ffo r t o f th o u s a n d s o f in d iv id u a ls w h o c o lle c t a n d ta b u
la te d a ta in th e c o u n trie s o f th e R e g io n .
I n c o m p ilin g , a n a ly z in g , a n d p u b lis h in g th e d a ta re c e iv e d fr o m th e c o u n trie s ,
th e O r g a n iz a tio n is f u lf i llin g th e c h a rg e c o n ta in e d in th e P a n A m e r ic a n S a n ita r y
C o d e , a n d w h ic h c a lls fo r “ th e s tim u la tio n o f th e m u tu a l in te rc h a n g e o f in f o r m a
tio n w h ic h m a y b e o f v a lu e in im p r o v in g th e p u b lic h e a lth a n d c o m b a ttin g th e
diseases o f m a n .”
I n th e p a s t th e t a b u la r d a ta h a v e p r o v e n u s e fu l, n o t o n ly to th e M in is tr ie s o f
H e a lt h o f th e R e g io n in e v a lu a tin g th e ir o w n a c tiv itie s a n d to th e G o v e r n in g B o d ie s
o f th e O r g a n iz a tio n in d e c id in g p r io r itie s fo r f u tu r e a c tiv itie s o f te c h n ic a l c o o p e ra
tio n , b u t also to m a n y s tu d e n ts , s c h o la rs , a n d re s e a rc h e rs in te re s te d in th e h e a lth o f
th e p e o p le o f th e A m e ric a s .
T h e m id p o in t o f th e T e n -Y e a r H e a lt h P la n f o r th e A m e ric a s fa lls w i t h in th e
p e r io d c o v e re d in th is p u b lic a tio n . I t s e e m e d p a r t ic u la r ly a p p r o p r ia te , th e r e fo r e , to
fo c us th e a n a ly s is , w h e r e p o s s ib le , o n th e pro g re s s a c h ie v e d in a t ta in in g th e goals
set fo r th in th e P la n . L ik e w is e , a tte n tio n is d r a w n to th o s e are as w h e r e in c re a s e d
e ffo r t w i l l b e r e q u ir e d b y th e c o u n trie s i f th e s e goa ls a re to b e m e t.
T h e I V S p e c ia l M e e tin g o f M in is te rs o f H e a lt h o f th e A m e ric a s (W a s h in g to n ,
D . C . ,
1977
) w a s h e ld fo r th e p u rp o s e o f a n a ly z in g th e s itu a tio n in r e g a rd to th e
processes fo r e x te n d in g h e a lth services c o v e ra g e a n d o f a d ju s tin g th e p o lic y a n d
s tra te g y fo r th e R e g io n . I n dis cu s sing th e ir p o lic ie s a n d p ro g ra m s , m o s t o f th e c o u n
trie s w e r e u n a b le to q u a n t if y in p re c is e te rm s th e m a g n itu d e o f th e p r o b le m th e y
fa c e in m e e tin g th e n e e d s o f th e p o p u la tio n u n s e rv e d o r u n d e rs e rv e d b y h e a lth
services. T h e r e fo r e re n e w e d e ffo rts s h o u ld b e m a d e to im p r o v e c iv il re g is tra tio n
a n d th e c o v e ra g e , q u a lit y , a n d tim e lin e s s o f th e v it a l s ta tis tic a l d a ta , p a r tic u la r ly
fo r r u r a l a re a s . T h is is e s p e c ia lly c r u c ia l g iv e n th e n u m b e r o f sectors t h a t a re in
v o lv e d in im p r o v in g th e q u a lit y o f life o f th e r u r a l a n d u r b a n d is a d v a n ta g e d p o p u
la tio n s . M o r e o v e r , s im p le m e th o d s fo r c o lle c tin g d a ta o n h e a lth services m u s t b e
d e v is e d a n d te s te d , as m u s t n e w in d ic a to rs t h a t w i l l p e r m it m o n ito r in g prog res s
to w a r d m e e tin g th e g o a l o f h e a lth services fo r a ll b y th e y e a r
2000
. As a lw a y s , th e
O r g a n iz a tio n s ta n d s r e a d y to c o lla b o r a te w i t h M e m b e r G o v e rn m e n ts in d e v e lo p in g
n e w te c h n o lo g ie s a n d in d is s e m in a tin g th e re s u lts o f th e e x p e rie n c e s g a in e d , fo r th e
b e n e fit o f a ll th e c o u n trie s o f th e R e g io n .
H é c t o r
R .
A c u ñ a
T h is is th e s e v e n th r e p o r t P A H O has p u b lis h e d o n h e a lth c o n d itio n s in th e
A m e ric a s . T h e firs t o f th e series w a s p re p a r e d fo r th e X I V P a n A m e r ic a n S a n ita r y
C o n fe re n c e in
1954
; sin ce th e n a r e p o r t has b e e n p u b lis h e d e v e ry fo u r y e a rs fo r
p re s e n ta tio n to s u c c e e d in g c o n fe re n c e s .
T h e p r in c ip a l s o u rc e o f d a ta fo r th is r e p o r t has b e e n th e re p lie s b y c o u n trie s to
th e a n n u a l q u e s tio n n a ire s s e n t b y th e W o r ld H e a lt h O r g a n iz a tio n a n d th e P a n
A m e r ic a n H e a lt h O r g a n iz a tio n re q u e s tin g in fo r m a tio n o n m o r t a lit y , m o r b id it y ,
v a c c in a tio n s , h u m a n res o u rc e s , a n d h e a lth e s ta b lis h m e n ts . O t h e r sources used in
c lu d e o ffic ia l p u b lic a tio n s a n d d o c u m e n ts o f th e c o u n trie s a n d o f th e U n ite d N a tio n s
a n d its s p e c ia liz e d a g e n c ie s .
A s in p re v io u s re p o rts , th e s u b je c t m a tte r is d iv id e d in to seve n c h a p te rs d e a lin g ,
re s p e c tiv e ly , w i t h p o p u la tio n , v it a l s ta tis tic s , c o m m u n ic a b le diseases, h e a lth se r
v ic e s , h o s p ita l se rv ic e s , e n v ir o n m e n ta l h e a lth , a n d h u m a n res ou rc es . O n th is o c c a
s io n , h o w e v e r , th e f o r m a t has b e e n c h a n g e d : in o rd e r o b je c tiv e ly to p re s e n t th e
h e a lth s itu a tio n in th e A m e ric a s , th e te x t o f th e c h a p te rs has b e e n re d u c e d a n d
la r g e r c h a rts , in c o lo r, e a c h p re s e n tin g a s p e c ific a n a ly s is , h a v e b e e n in c lu d e d . T o
s a fe g u a rd th e c o n tin u ity o f th e series a n d to e n a b le c o u n trie s a n d in te r n a tio n a l
ag en cies to a n a ly z e th e d a ta o v e r lo n g e r p e rio d s th a n th o s e to w h ic h e a c h re p o rt
re la te s , th e a c c o m p a n y in g A n n e x ta b le s h a v e n o t b e e n c h a n g e d .
T h e p u rp o s e o f th is p u b lic a tio n is to p r o v id e in fo r m a tio n o n th e pro gress a c h ie v e d
in th e h e a lth fie ld in th e R e g io n o f th e A m e ric a s . I n m a n y cases, b e c a u s e o f la c k o f
d a ta o r th e q u a lity a n d c o v e ra g e o f th e h e a lth s ta tis tic s o f m a n y c o u n trie s , a n a c
c u ra te a n a ly s is has n o t b e e n p o s sib le .
E X P L A N A T IO N O F S Y M B O L S
D a ta not a v a ila b le
Q u a n tity
0
...
P O P U L A T I O N
D e m o g ra p h ic factors are o f fu n d a m e n ta l im p o r
tan ce in a n y analysis o f h e a lth co nditions. T h e size
o f th e p o p u la tio n , its s truc tu re b y age a n d sex, ra te
o f p o p u la tio n g ro w th , u rb a n -ru ra l d is trib u tio n ,
e d uc atio n an d in co m e levels are characteristics re la
ted to th e h e a lth status a n d h e a lth needs o f the
people.
Sources o f in fo rm a tio n on d e m og rap hic ch arac
teristics presented in this re p o rt a re th e pub lic a tio ns
o f th e agencies o f th e U n ite d N a tio n s
.1
F o r th e years
a fte r
1970
, p o p u la tio n d a ta re fe r to projections
accord ing to th e U n ite d N a tio ns m e d iu m v a ria n t
assum ptions, w h ic h use th e m ost plau sib le trends
o f fe r tility , m o rta lity , an d m ig ra tio n in each coun
try ; d a ta o b ta in e d fro m th e
1970
censuses; a n d n a
tio n a l reports.
T h e R egion o f th e A m ericas consists o f
29
coun
tries an d
20
o th e r p o litic a l units. These v a ry in
n u m b e r o f in h a b ita n ts (
2,000
to over
200
m illio n ),
c u ltu re , socioeconom ic co nditions, c lim a te , and
geography.
F o r purposes o f analysis, the countries and o th e r
p o litic a l units o f th e A m ericas are grou ped in to tw o
b ro a d geographic regions— N o rth e rn A m e ric a and
L a tin A m e ric a . N o rth e rn A m e ric a comprises C a n
1
World Population Prospects as Assessed in 1973,
U n ite d N a
tio n s, 1 9 7 7 , a n d
Selected World Demographic Indicators by
Countries, 1950-2000,
U n ite d N a tio n s, 19 7 5 .
a d a, th e U n ite d States of A m e ric a , an d th e islands
o f B e rm u d a , an d St. P ie rre an d M iq u e lo n . F o llo w in g
th e U n ite d N a tio ns classification o f th e w o rld ’s geo
g ra p h ic regions, th e rest o f th e W e s te rn H e m is p he re
is c o lle c tiv ely re fe rre d to as L a tin A m e ric a . I t is
d iv id e d in to fo u r subregions: (
1
) th e C a rib b e a n
sub-region includes a ll th e island nations an d o th e r p o lit
ic a l units in th e C a rib b e a n ; (
2
) C o n tin e n ta l M id d le
A m e ric a consists o f M e xico , B e lize, th e countries of
C e n tra l A m e ric a , a n d P a n a m a ; (
3
) T ro p ic a l South
A m e ric a consists o f B o liv ia , B ra z il, C o lo m b ia , E c u a
d o r, Fre n ch G u ia n a , G u y a n a , P a ra g u a y , P eru,
S u rin a m e , an d V e n e zu e la ; an d (
4
) T e m p e ra te South
A m e ric a is fo rm e d b y A rg e n tin a , C h ile , U ru g u a y ,
a n d th e F a lk la n d Islands.
P o p u l a t i o n g r o w t h
A ll th e countries in the W e s te rn H e m is p he re took
a p o p u la tio n census a ro u n d
1960
an d
1970
. T h e
dates a n d e n u m e ra te d p o p u la tio n totals fo r the
1960
a n d the m ost recent censuses are given in
A nn ex T a b le
1
-
1
, w h ic h also gives an n u a l rates of
p o p u la tio n g ro w th fo r th re e fiv e -y e a r periods:
1950
-1955
,
1960
-
1965
, a n d
1970
-
1975
. R e gion al p o p u la
tio n , as w e ll as a n n u a l g ro w th rates, are show n in
T a b le
1
.
T a b l e 1. T o t a l P o p u l a t i o n a n d A n n u a l Ra t e s o f G r o w t h , b y Re g i o n s i n t h e A me r i c a s , 1 9 5 0 - 2 0 0 0 .
R e g i o n
T o t a l ip o p u l a t i o n ( i n m i l l i o n s )
A n n u a l g r o w t h r a t e ( p e r c e n t )
1 9 5 0
1 9 6 0
1 9 7 0
1 9 7 5
1 9 8 0
1 9 9 0
2 0 0 0
1 9 5 5
-1 9 6 0
1 9 6 5
-1 9 7 0
1 9 7 0
-1 9 7 5
- 1 9 7 5 -
1 9 8 0
1 9 8 5
-1 9 9 0
1 9 9 5
-2 0 0 0
N o r t h e r n A m e r i c a
1 6 6
1 9 9
2 2 6
2 3 7
2 4 9
2 7 5
2 9 6
1 . 7 8
1 . 1 2
0 . 9 0
0 . 9 9
0 . 9 5
0 . 6 9
L a t i n A m e r i c a
1 6 4
2 1 6
2 8 3
3 2 4
3 7 2
4 8 6
6 2 0
2 . 7 8
2 . 7 0
2 . 7 1
2 . 7 4
2 . 6 4
2 . 3 7
C a r i b b e a n
17
2 0
2 5
2 7
3 0
37
4 5
1 . 9 9
1 . 8 1
1 . 9 3
2 . 0 3
2 . 0 4
1 . 8 1
C o n t i n e n t a l M i d d l e A m e r i c a
3 6
4 9
6 7
79
9 3
1 2 8
1 7 3
3 . 1 8
3 . 1 6
3 . 2 1
3 . 2 7
3 . 2 1
2 . 9 1
T r o p i c a l S o u t h A m e r i c a
8 6
1 1 6
1 5 5
1 8 0
2 0 7
2 7 3
3 5 1
3 . 0 0
2 . 9 3
2 . 9 0
2 . 8 8
2 . 7 1
2 . 4 1
T e m p e r a t e S o u t h A m e r i c a
2 5
3 1
3 6
3 9
4 2
4 7
52
1 . 8 7
1 . 4 8
1 . 4 3
1 . 4 0
1 . 2 0
0 . 9 3
So u r c e : W o r l d P o p u l a t i o n P r o s p e c t s a s A s s e s s e d i n 1 9 7 3 , U n i t e d N a t i o n s , 1 9 7 J .
2
P o p u la tio n g ro w th rates v a ry co nsiderably am on g
th e
49
countries
2
o f th e A m ericas. T h e average a n
n u a l ra te o f p o p u la tio n increase d u rin g
1970-1975
ran ged fro m
0.0
p e r cent in St. P ie rre and M iq u e lo n ,
T u rk s an d Caicos Islands, an d th e F a lk la n d Islands,
to
3.5
p e r cent in H o n d u ra s an d F re n c h G u ia n a . T h e
a n n u a l g ro w th ra te w as
2.7
p e r cent in th e L a tin
A m e ric a n region as a w h o le d u rin g th a t same p e riod .
T his average was exceeded in
18
countries o f L a tin
A m e ric a , an d in
10
o f those countries th e ra te w as
over
3
pe r cent.
U rb a n - r u r a l d i s t r i b u t i o n
D e fin itio n s of u rb a n an d ru ra l are not u n ifo rm in
th e A m eric as. Some countries d e fin e these term s on
th e basis of size o f lo c a lity ; others on th e a v a ila b ility
o f c e rta in services, such as p ip e d w a te r supply and
e le c tric ity . Som etim es a c o u n try changes its d e fin i
tio n fro m one p e rio d to an othe r.
Plans an d program s to extend p rim a ry h e alth
2
H e r e in a fte r in th is p u b lic a t io n th e te rm “c o u n tr ie s” m a y in
c lu d e o th e r p o litic a l u n its.
care coverage to th e unserved or underserved p op u
la tio n in ru ra l an d p e ri-u rb a n areas re q u ire re lia b le
d a ta re g a rd in g th e m a g n itu d e , g ro w th , an d com
position o f these groups. A v a ila b le d a ta v a ry as to
accuracy a n d com pleteness.
B e tw ee n
1950
a n d
1970
, w h ile th e to ta l p op u
la tio n in L a tin A m e ric a increased b y
73
per cent,
th e u rb a n p o p u la tio n rose b y
140
p e r cent. T h e
u rb a n p o p u la tio n in L a tin A m e ric a in
1950
w as
41
pe r cent o f th e to ta l p o p u la tio n
(67
m illio n ), rose
to
57
per cent
(161
m illio n ) in
1970
, an d is expected
to reach
64
p e r cent
(237
m illio n ) in
1980
. T h e
average an n u a l ra te o f p o p u la tio n g ro w th in L a tin
A m e ric a d u rin g the decade o f
1960-1970
w as
2.7
pe r cent fo r to ta l p o p u la tio n ,
4.3
pe r cent fo r th e
to ta l u rb a n p o p u la tio n , an d
5.4
p e r cent fo r p op u
la tio n in cities o f
100,000
or m o re in h ab ita n ts .
In N o rth e rn A m e ric a , u rb a n p o p u la tio n w as
64
pe r cent o f the to ta l p o p u la tio n as e a rly as
1950
,
rose to
74
pe r cent
(168
m illio n ) in
1970
, an d is
pro jecte d to reach
86
pe r cent
(256
m illio n ) by the
end o f the ce ntury .
G re a te r d e ta il on u rb a n p o p u la tio n a n d average
a n n u a l g ro w th rates in th e regions o f th e A m ericas
is show n in Ta bles
2
an d
3
.
T a b l e 2. U r b a n P o p u l a t i o n a n d P o p u l a t i o n i n Ci t i e s o f 1 0 0 , 0 0 0 o r M o r e I n h a b i t a n t s , w i t h A n n u a l G r o w t h R a t e i n T e n - Y e a r I n t e r v a l s , b y R e g i o n s i n t h e A me r i c a s , 1 9 5 0 - 2 0 0 0 .
N u m b er ( i n m i l l i o n s )
A n n u a l g r o w t h r a t e ( p e r c e n t )
R e g i o n
1 9 5 0 -
1 9 6 0 -
1 9 7 0 -
1 9 8 0 -
1 9 9 0
-B
1 9 5 0
1 9 6 0
1 9 7 0
1 9 8 0
1 9 9 0
2 0 0 0
x g g o
1 9 7 0
1 9 8 0
1 9 9 0
2 0 0 0
T o t a l U r b a n
N o r t h e r n
A m e r i c a
1 0 6
1 3 9
1 6 8
1 9 6
2 2 8
2 5 6
2 . 72
1 . 9 2
1 . 5 5
1 . 5 1
1 . 1 5
L a t i n A m e r i c a
67
1 0 5
1 6 1
2 3 7
3 3 8
4 6 4
4 . 4 4
4 . 3 2
3 . 8 7
3 . 5 6
3 . 1 5
C a r i b b e a n
6
7
11
1 5
2 1
2 8
2 . 9 1
4 , 0 6
3 . 3 1
3 . 1 7
2 . 8 5
C o n t i n e n t a l M i d d l e A m e r i c a
1 4
22
36
5 6
85
1 2 4
4 . 6 1
4 . 7 2
4 . 4 1
4 . 2 2
3 . 7 7
T r o p i c a l S o u t h A m e r i c a
31
53
86
1 3 1
1 9 1
2 6 4
5 . 2 3
4 . 8 2
4 . 2 3
3 . 7 9
3 . 2 3
T e m p e r a t e S o u t h A m e r i c a
1 6
22
28
3 5
4 1
4 7
3 . 1 0
2 . 5 6
2 . 0 6
1 . 7 3
1 . 3 2
I n c i t i e s o f 1 0 0 , 0 0 0 o r m o r e i n h a b i t a n t s
N o r t h e r n A m e r i c a
72
99
1 2 4
1 5 0
1 7 9
2 0 4
3 . 1 8
2 . 2 7
1 . 8 4
1 . 7 7
1 . 3 0
L a t i n A m e r i c a
3 1
5 4
93
1 5 0
2 2 9
3 2 8
5 . 7 3
5 . 4 1
4 . 7 8
4 . 2 1
3 . 6 1
C a r i b b e a n
2
4
6
9
1 3
18
4 . 7 3
4 . 1 4
4 . 1 2
3 . 4 4
3 . 6 4
Ta b l e 3 . N u m b e r o f Ci t i e s o f O n e Mi l l i o n o r M o r e I n h a b i t a n t s , b y R e g i o n s i n t h e A me r i c a s , 1 9 5 0 - 2 0 0 0 .
R e g i o n
1 9 5 0
1 9 6 0
1 9 7 0
1 9 8 0
1 9 9 0
2 0 0 0
N o r t h e r n A m e r i c a
1 4
18
28
32
4 1
4 8
L a t i n A m e r i c a
6
11
17
2 5
39
4 8
C a r i b b e a n
1
1
1
3
4
5
C o n t i n e n t a l M i d d l e A m e r i c a
1
1
3
4
7
13
T r o p i c a l S o u t h A m e r i c a
2
6
1 0
15
23
25
T e m p e r a t e S o u t h A m e r i c a
2
3
3
3
5
5
A g e d i s t r i b u t i o n
M a jo r h e a lth program s a re a im e d a t specific age
groups, such as c h ild re n , w o m e n of ch ild b e a rin g
age, an d th e e ld e rly . F o r th a t reason, d a ta on th e
age an d sex d is trib u tio n o f th e p o p u la tio n a re re
q u ire d fo r p la n n in g a n d e v a lu a tin g h e a lth program s.
A n nex T a b le
1-3
gives th e pe rcentage d is trib u tio n
o f p o p u la tio n b y sex a n d age groups in countries o f
th e A m eric as, accord ing to th e latest census.
W o m e n
15-49
years o f age a re the ta rg e t group
fo r m a te rn a l an d fa m ily p la n n in g services. In
1960
,
the re w e re over
49
m illio n w o m e n in th a t age group
in L a tin A m e ric a . T h e ir num bers increased b y
50
p e r cent in
15
years to
75
m illio n in
1975
, a n d th a t
fig u re is expected to m o re th a n dou ble to
153
m il
lio n b y th e ye ar
2000
. In co m parison, the re w e re
46
m illio n w o m e n aged
15-49
in N o rth e rn A m e ric a
in
1960
, and th e ir num bers are expected to reach
76
m illio n b y th e y e a r
2000
.
A considerable increase is also expected in th e
n u m b e r o f c h ild re n un d er
5
years o f age in L a tin
A m e ric a , fro m
36
m illio n in
1960
to
84
m illio n in
th e y e a r
2000
; w h ile in N o rth e rn A m e ric a , th e ir
num bers are expected to flu c tu a te b e tw ee n
19
m il
lio n an d
23
m illio n d u rin g the sam e perio d.
T h e n u m b e r o f w o m e n
15-49
years o f age and
c h ild re n un d e r
5
in th e p e rio d
1950-2000
are con
ta in e d in T a b le
4
.
T a b l e 4 . N u m b e r o f C h i l d r e n u n d e r 5 Y e a r s o f A g e , W o m e n 1 5 - 4 9 , a n d A d u l t s 6 5 o r o v e r i n t h e R e g i o n s o f t h e A me r i c a s , 1 9 5 0 - 2 0 0 0 . ________________
N u m b er ( M i l l i o n s )
R e s l o n
1 9 5 0
1 9 6 0
1 9 7 0
1 9 8 0
1 9 9 0
2 0 0 0
N o r t h e r n A m e r i c a
C h i l d r e n u n d e r 5
Women 1 5 - 4 9
A d u l t s 6 5 o r o v e r
L a t i n A m e r i c a
C h i l d r e n u n d e r 5
Women 1 5 - 4 9
A d u l t s 6 5 o r o v e r
C a r i b b e a n
C h i l d r e n u n d e r 5
Women 1 5 - 4 9
A d u l t s 6 5 o r o v e r
C o n t i n e n t a l M i d d l e
A m e r i c a
C h i l d r e n u n d e r 5
Women 1 5 - 4 9
A d u l t s 6 5 o r o v e r
T r o p i c a l S o u t h A m e r i c a
C h i l d r e n u n d e r 5
Women 1 5 - 4 9
A d u l t s 6 5 o r o v e r
T e m p e r a t e S o u t h A m e r i c a
C h i l d r e n u n d e r 5
Women 1 5 - 4 9
A d u l t s 6 5 o r o v e r
1 8 . 1
2 2 . 6
1 9 . 0
4 2 . 4
4 5 . 9
5 4 . 1
1 3 . 5
1 8 . 1
2 2 . 0
2 6 . 4
3 6 . 4
4 6 . 1
3 9 . 0
4 9 . 4
6 4 . 4
5 . 7
7 . 3
1 0 . 5
2 . 5
3 . 1
3 . 8
4 . 1
4 . 8
5 . 6
0 . 6 5
0 . 7 9
1 . 2
6 . 3
9 . 2
1 2 . 1
8 . 2
1 0 . 6
1 4 . 6
1 . 2
1 . 6
2 . 3
1 4 . 5
2 0 . 4
2 6 . 3
2 0 . 1
2 6 . 3
3 5 . 5
2 . 7
3 . 2
4 . 7
3 . 1
3 . 7
3 . 9
6 . 5
7 . 7
8 . 9
1 . 1
1 . 7
2 . 4
2 0 . 9
2 3 . 1
2 1 . 6
6 3 . 8
7 0 . 7
7 6 . 1
2 6 . 1
3 0 . 5
3 2 . 0
5 8 . 7
7 2 . 4
8 3 . 7
8 6 . 5
1 1 5 . 6
1 5 3 . 4
1 4 . 9
2 0 . 4
2 7 . 9
4 . 3
5 . 0
5 . 3
7 . 1
9 . 0
1 1 . 1
1 . 6
2 . 0
2 . 4
4
De p e n d e n c y r a t i o
A ge structu re has a b e a rin g on th e w e ll-b e in g o f a
p o p u la tio n , in c lu d in g its a b ility to m a in ta in accep
ta b le levels o f h e a lth . T h e age grou p
15-64
years
is usually v ie w e d as s u pp ly in g th e b u lk o f th e
e c on om ic a lly ac tive p o p u la tio n an d is re fe rre d to as
th e p o p u la tio n o f w o rk in g ages. T h e ra tio of the
n u m b e r of c h ild re n u n d e r
15
an d th e adults
65
or
over (p o p u la tio n o f de pe nd en t ages) to th e n u m b e r
o f people aged
15-64
is re fe rre d to as th e dependency
ra tio . A lth o u g h this ra tio is n o t an accura te m easure
of econom ic dependency, it is considered a cru de
in d ic a to r of th e b u rd e n o f support w h ic h th e p ro
d u c tiv e p o p u la tio n m ust b e a r. C ou ntrie s w ith re la
tiv e ly h ig h fe r tility rates are ch a ra c te rize d by a
larg e p ro p o rtio n of c h ild re n too yo ung to w o rk ,
w h o are de pen dent on th e p o p u la tio n of w o rk in g
ages.
W ith in L a tin A m e ric a , dependency ratios v a ry
w id e ly am on g countries. In
1970
th e y rang ed fro m
T a b l e 5. P o p u l a t i o n A g e d u n d e r 1 5 Y e a r s a n d 6 5 Y e a r s o r o v e r a s a P e r C e n t o f P o p u l a t i o n A g e d 1 5 - 6 4 Y e a r s ( D e p e n d e n c y Ra t i o ) , b y C o u n t r y , 1 9 5 0 - 2 0 0 0 .
C o u n t r y o r o t n e r
p o l i t i c a l u n i t
1 9 5 0
1 9 6 0
1 9 7 0
1 9 8 0
1 9 9 0
2 0 0 0
A r g e n t i n a
5 3 . 2
5 7 . 0
5 7 . 0
5 8 . 2
5 8 . 4
5 5 . 1
B a r b a d o s
6 3 . 6
8 1 . 2
8 3 . 8
6 6 . 2
6 0 . 2
4 9 . 6
B o l i v i a
8 1 . 9
8 5 . 1
8 5 . 3
8 5 . 5
8 4 . 1
7 8 . 7
B r a z i l
8 1 . 4
8 5 . 8
8 4 . 3
8 1 . 6
7 8 . 0
7 1 . 7
C a n a d a
5 9 . 6
6 9 . 6
6 1 . 4
5 2 . 2
5 7 . 3
5 2 . 3
C h i l e
7 2 . 9
7 6 . 9
7 5 . 0
6 3 . 6
6 0 . 2
5 3 . 4
C o l o m b i a
8 9 . 1
9 5 . 9
9 8 . 0
8 9 . 4
7 9 . 2
6 7 . 1
C o s t a R i c a
9 0 . 8
1 0 2 . 9
9 5 . 2
7 4 . 7
6 8 . 9
6 2 . 5
C uba
6 9 . 8
6 4 . 9
7 6 . 6
7 3 . 9
6 7 . 8
6 1 . 7
D o m i n i c a n R e p u b l i c
9 0 . 1
9 8 . 9
1 0 3 . 8
1 0 1 . 0
9 6 . 5
8 8 . 7
E c u a d o r
8 8 . 1
9 2 . 2
9 7 . 0
9 2 . 1
8 3 . 9
7 4 . 9
E l S a l v a d o r
8 8 . 6
9 6 . 3
1 0 2 . 4
9 3 . 8
8 9 . 5
8 1 . 2
G u a d e l o u p e
7 4 . 6
9 2 . 2
9 0 . 6
7 6 . 2
6 2 . 9
5 0 . 5
G u a t e m a l a
8 6 . 0
9 4 . 2
9 3 . 5
8 7 . 7
8 3 . 0
7 6 . 4
G u y a n a
H a i t i
7 7 . 7
9 9 . 3
1 0 4 . 6
7 8 . 7
6 4 . 3
5 0 . 6
7 6 . 3
7 4 . 0
8 5 . 8
7 7 . 8
7 7 . 9
6 8 . 8
H o n d u r a s
8 9 . 7
9 3 . 8
9 5 . 2
9 9 . 2
9 3 . 2
8 7 . 1
J a m a i c a
6 6 . 4
8 5 . 1
1 1 0 . 6
9 5 . 2
7 7 . 8
6 5 . 8
M a r t i n i q u e
7 4 . 2
8 6 . 4
9 0 . 1
7 9 . 1
6 3 . 3
5 1 . 7
M e x i c o
8 5 . 6
9 6 . 0
1 0 0 . 0
9 5 . 7
9 2 . 7
8 4 . 2
N i c a r a g u a
8 9 . 0
1 0 1 . 4
1 0 4 . 0
1 0 1 . 8
9 6 . 0
8 6 . 9
P an am a
8 5 . 0
9 1 . 2
9 1 . 0
8 3 . 8
7 9 . 9
7 2 . 4
P a r a g u a y
8 5 . 6
9 7 . 1
9 7 . 1
9 1 . 5
8 6 . 2
7 6 . 9
P e r u
9 4 . 5
9 2 . 4
9 0 . 7
8 7 . 1
8 0 . 7
7 3 . 8
P u e r t o R i c o
8 9 . 2
9 2 . 4
7 7 . 0
6 1 . 6
5 3 . 9
4 8 . 9
S u r i n a m e
8 5 . 3
1 0 7 . 1
1 1 9 . 0
1 0 7 . 6
9 8 . 7
8 0 . 3
T r i n i d a d a n d T o b a g o
7 8 . 5
8 8 . 7
8 9 . 2
6 4 . 9
5 5 . 1
4 8 . 6
U n i t e d S t a t e s
5 4 . 0
6 7 . 4
6 1 . 5
5 2 . 4
5 5 . 4
5 0 . 3
U r u g u a y
5 3 . 4
5 5 . 3
5 9 . 8
5 9 . 3
5 7 . 9
5 6 . 6
V e n e z u e l a
8 4 . 4
9 4 . 9
9 8 . 9
8 3 . 0
7 8 . 0
6 7 . 6
W in d w a r d I s l a n d s ( a )
8 0 . 8
9 9 . 0
1 2 0 . 8
1 0 5 . 9
8 4 . 9
6 4 . 2
O t h e r C a r i b b e a n ( b )
7 1 . 4
8 9 . 0
9 0 . 3
7 7 . 7
6 6 . 2
5 6 . 1
N o r t h e r n A m e r i c a
5 4 . 4
6 7 . 6
6 1 . 5
5 2 . 3
5 5 . 6
5 0 . 5
L a t i n A m e r i c a
7 9 . 0
8 4 . 3
8 6 . 7
8 3 . 0
7 9 . 4
7 2 . 4
C a r i b b e a n
7 6 . 3
7 8 . 7
8 6 . 8
7 9 . 6
7 3 . 9
6 7 . 3
C o n t i n e n t a l
M i d d l e A m e r i c a
8 6 . 2
9 6 . 0
9 9 . 2
9 4 . 4
9 1 . 0
8 2 . 9
T r o p i c a l S o u t h A m e r i c a
8 4 . 0
8 8 . 8
8 8 . 5
8 4 . 0
7 9 . 0
7 1 . 2
T e m p e r a t e
S o u t h A m e r i c a
5 7 . 5
6 1 . 3
6 1 . 5
5 9 . 7
5 8 . 9
5 4 . 7
N o t e :
No d a t a a r e a v a i l a b l e s e p a r a t e l y f o r c o u n t r i e s
w h i c h h a d p o p u l a t i o n s o f l e s s t h a n 2 5 0 , 0 0 0 i n m i d - 1 9 7 0 .
( a )
I n c l u d i n g D o m i n i c a , G r e n a d a , S t . L u c i a a n d S t . V i n c e n t .
( b )
I n c l u d i n g A n t i g u a , B a h a m a s , C aym an I s l a n d s , M o n t s e r r a t ,
N e t h e r l a n d s A n t i l l e s , S t . K i t t s - N e v i s a n d A n g u i l l a , T u r k s a n d C a i c o s
I s l a n d s , V i r g i n I s l a n d s (U K ) , a n d V i r g i n I s l a n d s ( U S ) .
57
pe r cent in A rg e n tin a to
111
pe r cent in Jam aica
a n d
119
p e r cent in S u rin am e. T h is m eans th a t in
th e la tte r tw o countries th e re w e re m o re people in
th e age groups un d e r
15
years an d
65
years or over,
th a n in th e age group
15-64
years, in d ic a tin g a
h eavy sup port b u rd e n fo r th e p o p u la tio n of w o rk in g
ages.
In L a tin A m e ric a as a w h o le , th e dependency
ra tio w as
85
pe r cent in
1975
, co m p ared w ith
55
p e r cent in N o rth e rn A m e ric a . A lth o u g h th e ra tio
in L a tin A m e ric a has been g ra d u a lly d e c lin in g since
th e m id -
1960
’s an d is expected to c o n tin u e to de cline
d u rin g th e re m a in d e r o f this c e n tu ry , it is lik e ly to
re m a in a t a lev el considerably h ig h e r th a n in N o r th
e rn A m e ric a .
T a b le
5
presents th e dependency ra tio in th e coun
tries of th e A m ericas a t th e be ginn in g o f each o f th e
decades d u rin g
1950
-
2000
.
E du c a t i o n
T h e e d u c a tio n a l lev el of th e p o p u la tio n is a m eas
ure of socioeconom ic d e ve lo pm e nt, a n d is d ire c tly
re la te d to th e h e a lth status o f th a t p o p u la tio n . E d u
ca tio n is essential to develop th e h u m a n resources
re q u ire d in ever increasing num bers to w o rk in th e
h e a lth fields.
A nnex T a b le
1-4
shows th e students a tte n d in g p r i
m a ry school, secondary school, a n d universities as
a ra tio o f pop ulation s
5
-
14
,
15
-
19
, a n d
20-29
years
of age, respectively. L a rg e increases in the ratios at
a ll th re e school levels w e re observed in L a tin A m e r
ica b e tw e e n
1960
an d
1973
.
School e n ro llm e n t ratios are a ffe cted by th e age
a t w h ic h c h ild re n beg in th e e d u ca tio n al process,
as w e ll as b y th e d u ra tio n o f th e p rim a ry and second
a ry levels in d iffe re n t countries. T h e effe ct on th e
ra tio m a y be substantial if, fo r ex am ple, th e age
group e lig ib le fo r secondary school is a c tu a lly b ro a d e r
th a n
15
-
19
. T h e use o f th e
15-19
y e a r-o ld p o p u
la tio n in th e calcu latio ns, cou pled w ith th e hig h
e n ro llm e n t associated w ith th e greater n u m b e r
o f years o f schooling, w o u ld y ie ld ina c c u ra te ratios.
Such pro blem s in th e d e fin itio n of th e ratios m a y
be re fle c te d in the values exceeding
1.00
w h ic h
w e re o b ta in e d in some instances, such as secondary
school ratios a ro u n d
1970
o f
1.41
in th e B aham as
a n d
1.18
in th e U .S . V ir g in Islands.
F e m a le e n ro llm e n t in p rim a ry a n d secondary
schools in L a tin A m e ric a w as
48
p e r cent o f th e
student p o p u la tio n in
1960
and
49
pe r cent in
1973
;
a t th e u nive rs ity level it w as
29
pe r cent in
1960
and
40
p e r cent in
1973
.
E c o n o m i c g r o w t h
E c on om ic deve lo pm e nt can lead to im p ro v e d
h e a lth fo r the p o p u la tio n th ro u g h increased govern
m e n t revenues th a t can fin a n c e com prehensive
h e a lth services fo r a ll; an d if such econom ic g ro w th
leads to hig he r personal in c om e levels fo r a ll or
m ost socioeconom ic groups, a b e tte r q u a lity of life
can result.
T h e d a ta on this top ic w e re o b ta in e d fro m the
In te r-A m e ric a n D e v e lo p m e n t B a nk (ID B
),3
and
re fe r to
23
L a tin A m e ric a n m e m b e r countries. T h e
in d ic a to r used is th e gross dom estic p ro d u c t, a
m easure of th e v a lu e of a ll goods an d services p ro
duced in an econom y d u rin g a ye a r.
T h e gross dom estic p ro d u c t o f L a tin A m e ric a
(23
ID B m e m b e r countries) expan ded b y
4.8
pe r
cent in rea l term s in
1976
, as th e region began to
recover fro m th e severe recession experienced b y the
in d u s tria l countries in
1974
a n d
1975
. T h is com
pares w ith a n n u a l average g ro w th rates o f
5.9
per
cen t in th e
1966-1970
p e rio d , an d
7.5
pe r cent in
th e
1971-1974
p e rio d . These tw o periods o f g ro w th
w e re fo llo w e d b y a de cline to
3
pe r cent in
1975
, a
ra te b a re ly s u fficie n t to av oid a dro p in pe r c a p ita
in co m e . In term s o f in d iv id u a l c o u n try g ro w th
rates, the d o w n tu rn of
1975
a ffe cted
19
o f th e
23
co untries, w h ile th e u p tu rn o f
1976
w as shared
b y
15
.
T h e average a n n u a l increase in pe r c a p ita gross
dom estic p ro d u c t in L a tin A m e ric a w as
2.1
pe r cent
d u rin g th e p e rio d
1973
-
1976
. O n a reg io na l basis,
th e a n n u a l increases d u rin g this p e rio d ran ged fro m
5.4
p e r cent in
1973
to
0.2
p e r cent in
1975
. This
com pares w ith a
3.9
p e r cent average increase d u r
in g
1969
-
1972
, a p e rio d d u rin g w h ic h th e regional
increases rang ed fro m
3.9
pe r cent to
4.3
pe r cent.
O n a c o u n try basis, th e
1973-1976
average an
n u a l increases ra ng ed fro m highs o f
5.2
an d
5.1
pe r
ce nt in E c u a d o r a n d B ra z il, respectively, to a lo w of
-
4.9
pe r cent in J a m aica . F o u r o f th e
23
countries
h a d ne gative rates of increase, a n d fo u r experienced
a g ro w th un d e r
1
pe r cent. P er c a p ita gross dom estic
p ro d u c t by c o u n try , fo r th e years
1973
a n d
1976
,
a n d th e average a n n u a l v a ria tio n d u rin g th e p e rio d
1973-1976
are show n in T a b le
6
.
Ta b l e 6 . P e r C a p i t a Gr o s s D o me s t i c P r o d u c t ( i n 1 9 7 6 U. S . Do l l a r s ) a n d A v e r a g e G r o w t h Ra t e s , b y C o u n t r y , 1 9 7 3 - 1 9 7 6 .
A v e r a g e a n n u a l
i n c r e a s e
C o u n t r y 1 9 7 3 1 9 7 6 ( p e r c e n t )
1 9 7 3 - 1 9 7 6