Doi: https://doi.org/10.25186/.v15i.1765
Spatial correlation between the chlorophyll index and
foliar npk levels in coffee crop
Marco Antonio Zanella1 , Francelino Augusto Rodrigues Junior2 , Emanoel Di Tarso dos Santos Sousa3 ,
Rodrigo Nogueira Martins3 , Maria Lúcia Calijuri4
1Universidade Federal de Lavras/UFLA, Departamento de Engenharia Agrícola/DEA, Lavras, MG, Brasil 2International Maize and Wheat Improvement Center/CIMMYT, Texcoco, México
3Universidade Federal de Viçosa/UFV, Departamento de Engenharia Agrícola, Viçosa, MG, Brasil 4Universidade Federal de Viçosa/UFV, Departamento de Engenharia Civil, Viçosa, MG, Brasil
Contact authors: [email protected], [email protected], [email protected], [email protected], [email protected]
Received in May 14, 2020 and approved in July 29, 2020
ABSTRACT
Detection of spatial variability of data that can improve crop management is a key factor for precision agriculture. In agriculture, there is a need for tools to assist farmers in decision-making about proper nutrient management, aiming to achieve their full productive potential. Based on that, this study aimed to (1) determine the spatial correlations between the chlorophyll index (CI) and the foliar levels of nitrogen, phosphorus and potassium (NPK) in the coffee crop using geostatistical tools; and (2) to evaluate the potential use of this index as a tool for site-specific nutrient management in an irrigated coffee field. For that, a study was carried out in a 2.1 ha area under arabica coffee cultivation in Paula Cândido, Minas Gerais State, Brazil. Samplings of the CI were performed in 1141 plants using a portable chlorophyll meter (SPAD-502). Regarding the NPK analysis, leaf samples from one of each 10 plants used to measure the CI were taken for chemical analysis (114 plants). Then, the data were submitted to descriptive and geostatistical analysis. For the spatial correlation analysis, the Moran Bivariate Global (I) and the Local index (Ixy) were used. The results showed a moderate correlation between the CI and N (0.500), showing the potential of the chlorophyll meter as a tool for site-specific nitrogen management in the coffee crop. Differently, the CI is not recommended for P and K management since they were not well correlated. Lastly, as a tool that performs indirect measurements, the results from the chlorophyll meter should be validated by field measurements to local calibrations.
Key words: Optical sensor; precision agriculture; mapping; geostatistics; Coffea arabica L.
1 INTRODUCTION
Brazil is the largest producer and exporter of coffee beans worldwide, accounting for 37% of the global production in the 2018/2019 season (USDA, 2020). When considering quantity and quality of the produced coffee, several factors can influence its production, among them, the nutritional status of the plant is of utmost importance for management strategies definition (Silva et al., 2010). Conventionally, large amounts of nutrients are required by this crop, whose demand is mainly represented by nitrogen (N), potassium (K), and phosphorus (P), which if properly managed can provide well developed and vigorous plants (Silva et al., 2010; Dominghetti et al., 2014; Pérez et al., 2017).
According to Scalco et al. (2014) the search for information on plant response to nutrient absorption in densified and conventional crop cultivation under irrigated systems is of great importance, and these certainly differ from rainfed crops. The nutritional status of plants grown under irrigation and fertigation has been the subject of concern by coffee producers since the adoption of these systems has expanded in Brazil (Assis et al., 2015).
Foliar analyses are important for detecting and correcting nutrient imbalances according to the crop demand. In addition, this information helps avoid nutritional deficiency
problems that greatly affect the efficiency of fertilization and significantly reduce production (Silva et al., 2013). Couple with that, assessment of the spatial variability of the crop nutritional status can be a key factor to reduce yield variability. Also, to make the data acquisition process more agile, the use of portable optical sensors is presented as an attractive approach.
Optical sensors are useful tools for rapid and non-destructive assessments of plant nutritional status (Nogueira Martins et al., 2020). Among commercially available models, the SPAD-502 chlorophyll meter (Konica Minolta, Inc., Tokyo, Japan) has been widely used. This sensor contains two light-emitting diodes (LEDs) that emit light at 650 nm (red) and 940 nm (near-infrared). The light at 650 nm is associated with chlorophyll activity (645 and 663 nm), while the other at 940 nm is used to compensate differences in leaf moisture and thickness (Hardin et al., 2012; Raymond Hunt; Daughtry, 2014). The output of these two values is the chlorophyll index (CI), a dimensionless value that has been highly correlated with leaf chlorophyll and nitrogen content for several crops (Martins et al., 2020; Taskos et al., 2015; Duchino et al., 2013).
Even though the SPAD-502 readings have been widely associated with leaf chlorophyll and nitrogen content in previous studies, the information regarding the spatial correlation of the CI and the foliar NPK levels is still unknown. Based on that, it had been hypothesized that the chlorophyll index can be used for
assessment of the foliar NPK levels spatial variability. Thus, this study aimed to: (1) determine the spatial correlation between the CI and foliar NPK levels; and (2) to determine and evaluate the potential use of this index as a tool for site-specific nutrient management in an irrigated coffee field.
2 MATERIAL AND METHODS 2.1 Study area
The study was carried out at the Jatobá farm, municipality of Paula Cândido, Minas Gerais State, Brazil (20º49’45.9” S; 42º55’5.7” W). Data collection was performed in November 2007 at the beginning of the fruit expansion, defined as “chumbinho” stage (Pezzopane et al., 2003). The evaluated crop was the arabica coffee (Coffea arabica L.), variety Catuaí, which was planted with 0.65 m between plants and 3.0 m between rows, totalling 26 planting lines in an area of 2.10 hectares irrigated by a center pivot. Furthermore, the soil was characterized as Red-Yellow Ultissol (Soil Survey Staff, 2014). 2.2 Data acquisition
The georeferencing of the study area was performed using a Differential Global Positioning System (DGPS) model ProXRS (Trimble Inc, Sunnyvale, California, USA). The differential correction of the data was performed using the IBGE - RBMC (Brazilian Continuous Monitoring Network) database (IBGE, 2020) using the GPS Pathfinder Office.
The CI sampling was performed alternately in relation to the planting lines, and in these lines, every four plants were
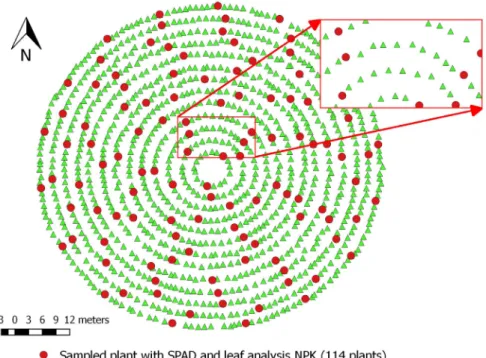
sampled, totaling 25% of all plants present in the lines and 1141 plants, approximately 13% of the plants present in the area. For that, each plant was divided in half in relation to the direction of the line. Then, the CI values were measured in 15 pairs of leaves from productive branches (third or fourth pair of leaves from the branch apex) in the middle third section of the plant, totaling 30 leaves per plant, 15 leaves on each side. After the readings, the mean value of the CI from both sides was adopted (Figure 1).
In addition, leaf samples from one of each 10 plants used to measure the CI were taken for analysis of the NPK levels (114 plants, Figure 1). The nitrogen was obtained using the Kjeldahl method (AOAC, 2005), whereas phosphorus and potassium were obtained using the wet digestion in nitro-perchloric solution (Zasoski; Burau, 1977).
2.3 Statistical Analysis
Initially, a descriptive statistical analysis of the CI and foliar NPK levels was performed and the following parameters were obtained: Minimum, Median, Mean and Maximum values, Lower and Upper Quartile, Standard Deviation (SD), and the Coefficients of Variation (CV), Skewness and Kurtosis. Then, the spatial dependence of the data was verified using geostatistical analysis, following the procedures of semivariogram model adjustments and, later, the determination of cross-validation parameters for each attribute using the GS+ software, version 7 (Gamma Design Software) (Robertson, 1998). The model that best fitted the theoretical semivariogram was chosen based on the smaller sum of squared error (SSE). Lastly, the data were interpolated using ordinary kriging.
For the spatial correlation analysis, the Moran Bivariate Global (I) and the Local index (Ixy) (Anselin, 1995) were used through the association of each pixel from the CI and NPK spatial variability maps. Furthermore, the “I” index presents the degree of spatial correlation between two correlated spatial variables, while the “Ixy” is presented in clusters maps for analysis of the local spatial correlation. The bivariate Moran index was obtained using Equation 1 as shown below.
(Ks), which represents the dispersion or flattening of the distribution in relation to the normal distribution, the data presented a leptokurtic (Ks > 0) pattern for the CI and N, whereas, for P and K, they were classified as mesokurtic (Ks < 0). Regardless, the hypothesis of normal distribution was not tested since it is not a requirement for geostatistical analysis (Negreiros et al., 2010; Wu; Norvell; Welch, 2006).
(1)
2
2 1 1 1 1 i j i ij j yx n n i j j i n n i j ij x x W y y I y y x x W n Where:n = number of sampled points;
x xi
e
yjy
= represent the observed values centered onthe means of the variables X and Y under study, respectively; Wij = is the spatial proximity matrix element W that was calculated using the contiguity criterion;
2
2 1 1 n n i yj y j x xi n = are the respective variances of Y and X.
Statistical validation of the index is performed using a pseudo-significance test, with conditional randomization (999 permutations), where each permutation produces a new spatial arrangement of the redistributed values between the points, and its significance is obtained from an empirical distribution of the “I” statistic of Moran. Thus, the originally measured value will have statistical significance if it corresponds to an “end” of the simulated distribution (Câmara et al., 2004). The global and local Moran index values were obtained using the GeoDA software, version 1.6.2 (Anselin et al., 2005).
3 RESULTS
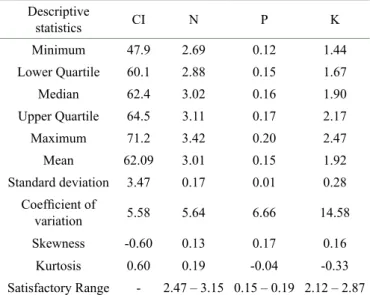
Results of the descriptive statistical analysis of the CI and the foliar NPK levels are presented in Table 1. The satisfactory range (SR) of all attributes (except to K), was considered satisfactory for the cultivation of coffee in Viçosa (Minas Gerais State) according to the values established in the literature (Martinez et al., 2003).
The interquartile range represents the interval between the lower and upper quartiles. In this study, the P presented the lowest interquartile range, whereas K presented the higher interquartile range, and also the higher variability (CV: 14.58%) among all attributes. Regarding the Skewness coefficient (Sk) that is a measure used to a measure used to demonstrate how and how much the frequency distribution deviates from the symmetry, the data distribution was classified as asymmetric on the right for the NPK (Sk > 0) and asymmetric on the left for the CI (Sk < 0). Differently, for the Kurtosis coefficient
Table 1: Descriptive statistics of the chlorophyll index (CI) and foliar nitrogen, phosphorus, and potassium (NPK) levels.
Descriptive statistics CI N P K Minimum 47.9 2.69 0.12 1.44 Lower Quartile 60.1 2.88 0.15 1.67 Median 62.4 3.02 0.16 1.90 Upper Quartile 64.5 3.11 0.17 2.17 Maximum 71.2 3.42 0.20 2.47 Mean 62.09 3.01 0.15 1.92 Standard deviation 3.47 0.17 0.01 0.28 Coefficient of variation 5.58 5.64 6.66 14.58 Skewness -0.60 0.13 0.17 0.16 Kurtosis 0.60 0.19 -0.04 -0.33 Satisfactory Range - 2.47 – 3.15 0.15 – 0.19 2.12 – 2.87
N, P, and K are expressed in dag kg-1; Satisfactory Range is the range
considered satisfactory for nutrient concentration levels of coffee cultivation in Viçosa-MG (Martinez et al., 2003).
Results of the geostatistical analysis of the CI and foliar NPK levels are shown in Table 2. A Gaussian model was adjusted for P and K, whereas N and CI were fit to an exponential model. These models presented the higher values of the coefficients of determination (R2), and the lower values of the nugget effect (Co) and sum of squared errors (SSE). Table 2: Parameters of the adjusted semivariograms for the chlorophyll index (CI) and foliar nitrogen, phosphorus, and potassium (NPK) levels.
Attribute Model Co Co+C A R² SSE
N Exponential 2.69x10⁻² 5.49x10⁻² 103.2 0.81 0.18
P Gaussian 1.49x10⁻⁴ 2.26x10⁻⁴ 100.1 0.83 0.18
K Gaussian 8.52x10⁻² 1,774x10-1 93.4 0.90 0.13
IC Exponential 4.99 11.33 17.7 0.30 0.32
Co: nugget effect; Co + C: sill; A: Range; R²: Coefficient of determination; SSE - Sum of squared errors.
The CI presented the highest nugget effect (4.99) among all attributes. Besides that, the NPK attributes showed better results for the cross-validation parameters (R2 and
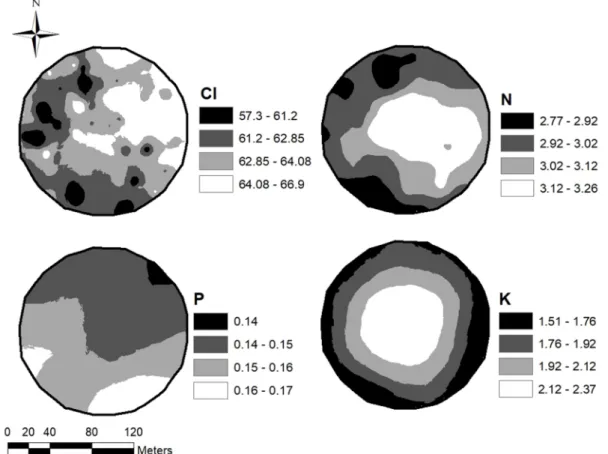
SSE). The range of influence of the semivariogram indicates that the N showed higher spatial continuity (103.2 m) when compared to the other attributes, such as the CI, which presented the higher spatial variability (17.7 m). After the semivariogram adjustments, the data were interpolated using ordinary kriging and, the thematic maps were generated as shown in Figure 2.
Even though the CI presented the higher spatial variability, it still showed some similarity with the N map, in which both attributes presented the lowest values in the left and in the lower portion of the study area. Regarding the K spatial variability, the highest levels were concentrated in the central part of the area, which was also the only region with values above the SR (i.e., from 2.12 to 2.87). Furthermore, the K showed a similar trend to the N map with lower values on the edges. On the other hand, the map of P presented on the majority of its area, an opposite spatial distribution of that observed for the CI and N.
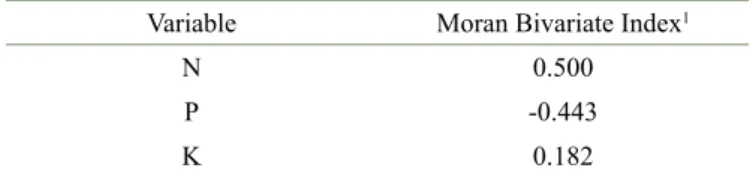
To evaluate the similarity and the spatial location of the data, the global Bivariate Moran index was calculated. For the present index, the values of positive spatial correlation (between 0 and + 1) indicate spatial similarity. On the other hand, if dissimilarity between the CI and NPK levels is observed, the “I” results in negative spatial correlation (between 0 and -1). The results of the “I” indicated a positive spatial correlation
between the CI and the attributes N and K, in contrast to P, which showed a negative correlation (Table 3). These results are in accordance with those previously observed in the spatial variability maps (Figure 2).
The clustering maps presented in Figure 3 were obtained to evaluate the local spatial correlations. In this study, the spatial distribution of CI and the NPK attributes were evaluated using Moran statistics to identify areas that presented particularly high or low correlations between these attributes. From the results, the regions that could receive site-specific nutrient management are the ones highlighted in red (High – High) and blue (Low-Low), especially for the nitrogen map. Regarding the other attributes, the lower (K) and negative (P) correlation presented by these attributes indicate that it is not feasible to make decisions related to fertilization based on the CI value.
4 DISCUSSION
The NPK levels observed in this study were similar to the values reported in the literature (Fonseca et al., 2015; Silva et al., 2013). However, similarly to the results reported by these authors, in this study, the K level is also below the SR for the coffee crop (Table 1) (Martinez et al., 2003). This deficiency in K was possibly caused by a higher translocation of
Figure 2: Spatial variability maps of the chlorophyll index (CI) and foliar nitrogen, phosphorus, and potassium (NPK) levels expressed in dag kg-1.
photoassimilated compounds for fruit formation at the current phenological stage (“Chumbinho”) (Mancuso et al., 2014). At this stage, the crop requires large amounts of K to increase fruit weight and volume (Valarini; Bataglia; Fazuoli, 2005). Besides that, the current deficiency was possibly accentuated due to the low efficiency of application at the end of the fertigation system (Center pivot) since the lower levels of the attribute were concentrated in the edges of the study area.
The lower spatial variability observed for P can be related to its lower mobility when compared to the N and K (Gebrim et al., 2010), which was beneficial to the crop since the majority of the study area is within the satisfactory range. On the other hand, the higher spatial variability presented by the CI may be related to the higher sample density since, in the same planting row, the distance between sampled plants was 2.6 meters, whereas for leaf analysis the distance was 26 meters.
Regarding the spatial correlation, the CI and N presented a moderate spatial correlation, as they showed the highest positive value of the Moran I index (0.500). This result corroborates the spatial trend observed between these attributes (Figure 2). In addition, our results reinforce previous findings, in which the chlorophyll meter was reported as a potential tool for site-specific N management in the coffee crop (Reis et al., 2006; Reis et al., 2009), as well as, in other crops (Martins et al., 2020; Radhamani; Kannan; Rakkiyappan, 2016; Silveira; Gonzaga, 2017; Taskos et al., 2015).
Reis et al. (2009) reported significant correlations (p<0.01) between the chlorophyll (a, b, and total), total N and CI. Conversely, Godoy et al. (2008) observed higher correlations between the CI and N in the filling stage of coffee beans, whereas, for the “chumbinho” stage, in which this study was carried out, they reported lower correlations (0.15). Despite that, this result highlights the need for using a specific CI for each phenological phase of the coffee crop. Lastly, even though the N values were mostly within the satisfactory range, Table 3: Moran Bivariate Index between the chlorophyll index (CI)
and foliar nitrogen, phosphorus, and potassium (NPK) levels.
Variable Moran Bivariate Index1
N 0.500
P -0.443
K 0.182
¹ Moran’s index Bivariate: pseudo p-value = 0.001 with 999 permutations.
Figure 3: Map of clusters for the Moran Bivariate Local index (pseudo-value <0.001 with 999 permutations) for the chlorophyll index (CI) and foliar nitrogen, phosphorus, and potassium (NPK) levels (%: is the percentage of the total area).
The spatial variability of N and K can be explained by the application of these nutrients in the crop via fertigation. As stated above, this spatial trend can be related to the efficiency of application of the irrigation system. Despite that, for irrigated coffee under production, the nutritional recommendations are still based on the behavior of rainfed crop. This condition may lead to nutrient deficiency, which can compromise the plant development since irrigated crops have a different pattern of growth and yield than non-irrigated crops (Carvalho et al., 2006; Assis et al., 2015; Rezende et al., 2010; Sobreira et al., 2011).
this not necessarily resulted in higher CI values since the SPAD readings can be influenced by different factors, such as the phenological stage, measurement time, and most importantly, by the fact that chlorophyll molecules are not only composed by N (Bassi; Menossi; Mattiello, 2018; Godoy et al., 2008; Nogueira Martins et al., 2020).
The Moran I index between CI and P (-0.443) showed a negative and significant spatial correlation, indicating that lower values of P are close to higher values of the CI. Indeed, this correlation confirms the opposite spatial distribution of high and low values of both attributes as observed in Figure 2. Differently, the lower correlation was observed between the CI and K (0.182). As mentioned above, this result can be associated with the higher demand by the crop at the current phenological stage, in which the K is remobilized from the leaf to the coffee fruit (Laviola et al., 2009; Mancuso et al., 2014). Regarding the cluster maps, N showed the higher proportion of the area with positive spatial correlation (50.2%), followed by K (36.9%) and P (11.2%). On the other hand, the higher proportion of area that contributed to negative spatial correlation was presented by P (58.2%) followed by K and N with 27.2% and 16.2%, respectively. Furthermore, the areas in which the Local Bivariate Moran index was not significant, ranged from 30.6 to 35.9% of the total area of each attribute. According to Anselin (1995) in areas where the values of these attributes (NPK) vary around the mean, a non-significant value is observed since the local values that are very different from their mean (or median) indicate sites that contribute more than expected to the global statistic.
However, the local spatial correlation maps patterns may not be aligned with the global correlation, especially for the K which presented a similar pattern than N (Figure 3); however, it presented a lower global correlation (Table 2). This result is a reflection of the positive and negative correlation ratios that were similar and resulted in an overall index close to zero. Lastly, from a practical perspective, the spatial correlation results can aid in site-specific nutrient management, only for N, which presented the best spatial correlation. Differently, the CI is not recommended for P and K management since they were not well correlated. Besides that, the spatial variability of these attributes is possibly associated with other crop management factors. Nonetheless, it’s noteworthy that local calibrations should be carried out for each phenological stage of the crop before decision-making.
5 CONCLUSIONS
The Chlorophyll Index (CI) and N presented a moderate spatial correlation (0.500), showing the potential of the chlorophyll meter as a tool for site-specific nitrogen management in the coffee crop. Differently, the CI is not recommended for P and K management since they were
not well correlated. Lastly, as a tool that performs indirect measurements, the results from the chlorophyll meter should be validated by field measurements to local calibrations.
6 REFERENCES
ANSELIN, L. Local Indicators of Spatial Association - LISA. Geographical Analysis, 27(2):93-115, 1995.
ANSELIN, L. et al. GeoDa: An introduction to spatial data analysis. Geographical Analysis, 38(1):5-22, 2005. ASSIS, G. A. de et al. Critical ranges for leaf nitrogen and
potassium levels in coffee fertigated at the production phase. Revista Ciencia Agronomica, 46(1):126-134, 2015. BASSI, D.; MENOSSI, M.; MATTIELLO, L. Nitrogen
supply influences photosynthesis establishment along the sugarcane leaf. Scientific Reports, 8(1):1-13, 2018. CÂMARA, G. et al. Análise de dados de área. In: CÂMARA,
G. et al. (Eds.). Análise espacial de dados geográficos. Brasília: EMBRAPA, 2004. 44p.
CARVALHO, C. H. M. de et al. Evolução do crescimento do cafeeiro (Coffea arabica L.) irrigado e não irrigado em duas intensidades de plantio. Ciência e Agrotecnologia, 30(2):243-250, 2006.
DOMINGHETTI, A. W. et al. Doses de fósforo e irrigação na nutrição foliar do cafeeiro. Revista Brasileira de Engenharia Agrícola e Ambiental, 18(12):1235-1240, 2014.
DUCHINO, H. et al. Calibrating chlorophyll meter (SPAD-502) reading by specific leaf area for estimating leaf nitrogen concentration in sweet sorghum. Journal of Plant Nutrition, 36(10):1640-1646, 2013.
FONSECA, A. S. da et al. Spatial variability of the productivity and the nutritional condition of coffee canephora. Coffee Science, 10(4):420-428, 2015. GEBRIM, F. O. de et al. Mobility of inorganic and organic
phosphorus forms under different levels of phosphate and poultry litter fertilization in soils. Revista Brasileira de Ciência do Solo, 34(4):1195-1205, 2010.
GODOY, L. J. G. de et al. Índice relativo de clorofila e o estado nutricional em nitrogênio durante o ciclo do cafeeiro fertirrigado. Revista Brasileira de Ciência do Solo, 32(1):217-226, 2008.
HARDIN, J. A. et al. In situ measurement of pecan leaf nitrogen concentration using a chlorophyll meter and vis-near infrared multispectral camera. HortScience, 47(7):955-960, 2012.
LAVIOLA, B. G. et al. Macronutrient accumulation in coffee fruits at brazilian zona da mata conditions. Journal of Plant Nutrition, 32(6):980-995, 2009.
IBGE - INSTITUTO BRASILEIRO DE GEOGRAFIA E ESTATÍSTICA. Estações da Rede Brasileira de Monitoramento Contínuo dos Sistemas GNSS. 2020. Available in: <https://www.ibge.gov.br/geociencias/ informacoes-sobre-posicionamento-geodesico/rede- geodesica/16258-rede-brasileira-de-monitoramento-continuo-dos-sistemas-gnss-rbmc.html?=&t=downloads>. Access in: March, 17, 2020.
MANCUSO, M. A. C. et al. Effect of potassium sources and rates on arabica coffee yield, nutrition, and macronutrient export. Revista Brasileira de Ciência do Solo,
38(5):1448-1456, 2014.
MARTINEZ, H. E. P. et al. Faixas críticas de concentrações de nutrientes e avaliação do estado nutricional de cafeeiros em quatro regiões de Minas Gerais. Pesquisa Agropecuaria Brasileira, 38(6):703-713, 2003.
MARTINS, R. N. et al. Nitrogen variable rate fertilization in corn crop prescribed by optical sensor. Journal of Plant Nutrition, 43(11):1681-1688, 2020.
NEGREIROS, J. et al. Geographical information systems principles of ordinary kriging interpolator. Journal of Applied Sciences, 10(11):852-867, 2010.
NOGUEIRA MARTINS, R. et al. Do optical sensor readings change throughout the day? An evaluation of two sensor systems. Journal of Plant Nutrition, 43(11):1689-1696, 2020.
OFFICIAL METHODS OF ANALYSIS OF AOAC INTERNATIONAL - AOAC. In: HORWITZ, W.; LARTIMER, G. W. (18th ed.), AOAC International, Gaithersburg. p.5-25. 2005.
PÉREZ, C. D. P. et al. Nitrogênio e potássio na intensidade da mancha aureolada do cafeeiro. Coffee Science, 12(1):60-68, 2017.
PEZZOPANE, J. R. M. et al. Escala para avaliação de estádios fenológicos do cafeeiro arábica. Bragantia, 62(3):499-505, 2003.
RADHAMANI, R.; KANNAN, R.; RAKKIYAPPAN, P. Leaf chlorophyll meter readings as an indicator for sugarcane yield under iron deficient typic haplustert. Sugar Tech, 18(1):61-66, 2016.
RAYMOND HUNT, E.; DAUGHTRY, C. S. T. Chlorophyll meter calibrations for chlorophyll content using measured
and simulated leaf transmittances. Agronomy Journal, 106(3):931-939, 2014.
REIS, A. R. dos. et al. Diagnóstico da exigência do cafeeiro em nitrogênio pela utilização do medidor portátil de clorofila. Bragantia, 65(1):163-171, 2006.
REIS, A. R. et al. Photosynthesis, chlorophylls, and SPAD readings in coffee leaves in relation to nitrogen supply. Communications in Soil Science and Plant Analysis, 40(9-10):1512-1528, 2009.
REZENDE, F. C. et al. Cafeeiro recepado e irrigado em diferentes épocas: Produtividade e qualidade. Coffee Science, 5(3):229-237, 2010.
ROBERTSON, G. P. GS+: Geostatistics for the Environmental Sciences. Plainwell Gamma Design Software, 1998. 152p.
SCALCO, M. S. et al. Teores foliares de fósforo e zinco, produtividade e crescimento de café irrigado. Pesquisa Agropecuaria Brasileira, 49(2):95-101, 2014. SILVA, L. da et al. Fotossíntese, relações hídricas
e crescimento de cafeeiros jovens em relação à disponibilidade de fósforo. Pesquisa Agropecuaria Brasileira, 45(9):965-972, 2010.
SILVA, S. D. A.; LIMA, J. S. S. de; BOTTEGA, E. L. Yield mapping of arabic coffee and their relationship with plant nutritional status. Journal of Soil Science and Plant Nutrition, 13(3):556-564, 2013.
SILVEIRA, P. M. da; GONZAGA, A. C. O. de. Portable chlorophyll meter can estimate the nitrogen sufficiency index and levels of topdressing nitrogen in common bean. Pesquisa Agropecuária Tropical, 47(1):1-6, 2017. SOBREIRA, F. M. et al. Adubação nitrogenada e potássica
de cafeeiro fertirrigado na fase de formação, em plantio adensado. Pesquisa Agropecuaria Brasileira, 46(1):9-16, 2011.
SOIL SURVEY STAFF. Keys to soil taxonomy. 12th ed. Agency Publisher: Department of Agriculture (USDA) Natural Resources Conservation Service (NRCS) 2014. 410p. TASKOS, D. G. et al. Using active canopy sensors and
chlorophyll meters to estimate grapevine nitrogen status and productivity. Precision Agriculture, 16(1): 77-98, 2015.
UNITED STATES DEPARTMENT OF AGRICULTURE - USDA. Coffee: World markets and trade. Available in: <https://www.fas.usda.gov/data/coffee-world-markets-and-trade>. Access in: March, 23, 2020.
VALARINI, V.; BATAGLIA, O. C.; FAZUOLI, L. C. Macronutrientes em folhas e frutos de cultivares de café arábica de porte baixo. Bragantia, 64(4):661-672, 2005.
WU, J.; NORVELL, W. A.; WELCH, R. M. Kriging on highly skewed data for DTPA-extractable soil Zn
with auxiliary information for pH and organic carbon. Geoderma, 134(1-2): 187-199, 2006.
ZASOSKI, R. J.; BURAU, R. G. A rapid nitric-perchloric acid digestion method for multi-element tissue analysis. Communications in Soil Science and Plant Analysis, 8(5):425-436, 1977.