132 Published by SCHOLINK CO., LTD
Original Paper
Attitudes toward Credit and Finances among College Students in
Brazil and the United States
Jill M. Norvilitis1* and Wesley Mendes-Da-Silva2 1 Department of Psychology, SUNY Buffalo State, Buffalo, NY, USA
2 Department of Finance Accounting and Controllership, Fundação Getulio Vargas Business School at
São Paulo, Brazil
* Jill M. Norvilitis, E-mail: norviljm@buffalostate.edu
Abstract
Although research on credit card debt in developed countries has identified predictors of debt among college students, it is unknown whether these same predictors apply in emerging markets, such as Brazil. To examine this issue, a total of 1257 college students, 814 from Brazil and 443 from the United States, participated in a study exploring the utility of a theory of planned behavior as a predictor of credit card debtand student loans among college students, as well as perceived financial well-being. Compared to the Brazilian participants, the American sample was more financially self-confident, reported better financial well-being, and was more likely to believe that credit cards are negative. Similar predictors of financial well-being emerged in the samples. Specifically, parenting practices related to money and better self-reported delay of gratification are related to more positive financial attitudes and lower levels of debt. Although the debt to income ratio among card holders was similar, Brazilian students held more credit cards than American students. Greater delay of gratification was related to lower levels of student loans in the United States, but there were no significant predictors of student loans in Brazil.
Keywords
consumer attitudes, cross cultural differences, college students
1. Introduction
Research on credit card debt in the United States and Europe has yielded important predictors of debt among college students. However, it is unknown whether these predictors apply in other cultures, including Brazil. The credit market among college students has been growing rapidly in Brazil, whereas new legal constraints have been imposed in the United States. Thus, the present study sought to examine the prevalence of credit card debt among college students and predictors of debt, financial
133 Published by SCHOLINK CO., LTD
well-being, and student loans among students in both the United States and Brazil.
1.1 Credit Card and Student Loan Debt among College Students in Western countries
In 2009, the United States federal government passed the Credit CARD Act, limiting the availability of credit cards to students. The legislation, which took effect in 2010, prohibits on-campus marketing of cards and requires proof of income before cards are given to those under 21 (Credit Card
Accountability Responsibility and Disclosure Act, 2009). Such regulations were in response to the
widespread prevalence of credit cards and debt among American college students. In the United States, in 2009, 84% of American college students had at least one credit card (Sallie Mae, 2009), an increase from 76% just four years prior (Nellie Mae, 2005). Further, in 2009, the average credit card debt for American students was $3,173 (Sallie Mae, 2009).
Most Western college students manage credit carddebt well. Sallie Mae (2009) reported that 22% pay off their credit cards monthly and 67% report a balance of less than $3,000 (Sallie Mae, 2009). However, for those in significant debt, there are consequences. High levels of debt are related to decreased confidence in one’s money management skills, lower self-esteem, decreased financial well-being, and higher stress (Lange & Byrd, 1998; Norvilitis et al., 2003), although some research has not replicated the link between student debt and happiness or academic achievement (Zhang & Kemp, 2009). Researchers, then, have been working to understand why some students are more likely to be indebted. Credit card debt is viewed as arising from multiple factors, with demographics, personality, and social and educational variables playing a role.
Some demographic factors, such as year in college, are related to credit card debt with debt increasing with each year in a study of New Zealand students (Boddington & Kemp, 1999). Further, independent of year in college, older students are more tolerant of debt and are more likely to acquire credit cards (Davies & Lea, 1995; Hayhoe, Leach, & Turner, 1999). Other demographic factors, such as gender and grade point average, are not related to student credit card debt (Norvilitis et al., 2006; Pinto, Parente, & Palmer, 2001).
Personality factors have also been investigated, yielding a number of predictors. Specifically, more liberal attitudes toward credit use (Livingstone & Lunt, 1992; Norvilitis et al, 2006), poor delay of gratification, low self-control and compulsive spending (Livingstone & Lunt, 1992; Lunt & Livingstone, 1991; Norvilitis et al., 2006; O’Guinn & Faber, 1989; Strayhorn, 2002; Watson, 2003) are related to increased risk. Social comparison, the tendency to compare one’s status with that of others, has begun to be examined, with research indicating a relationship with satisfaction with income and success (McBride, 2010), debt among adults (Lea, Webley, & Walker, 1995), and perceived financial well-being among American college students (Norvilitis & Mao, 2012).Further, financial self-confidence, that is, confidence in one’s ability to make financial decisions, is related to investing behavior and socioeconomic status (Caplan & Schooler, 2007; Forbes & Kara, 2010) and the number of credit cards held by American college students (Norvilitis & Mao, 2012).
134 Published by SCHOLINK CO., LTD
Finally, social and educational factors play a role in credit card debt. The role of financial knowledge itself remains unclear, with some studies showing a protective effect (Norvilitis et al, 2006; Robb, 2011) and others showing increased risk (Hirt & Nick, 1999; Norvilitis & MacLean, 2010).Positive parental modeling and instruction about money appear to decrease the risk of debt (Norvilitis & MacLean, 2010; Norvilitis & Mao, 2012; Palmer, Pinto, & Parente, 2001).
Less is known about psychological factors and processes involved in student loan debt. However, concern is growing about the consequences of loans. In 2010, American college student loans overtook credit card debt, and the current amassed student loan debt is approaching one trillion dollars (http://www.finaid.org/loans/studentloandebtclock.phtml). In the United States, politicians have spoken about the issue, including Illinois Senator Dick Durbin who described student loan debt as “spinning out of control” (Rosenthal, 2012). In the short term, student loans are related to lower rates of degree completion, particularly among low income students (Kim, 2007). Longer term also consequences exist. In a report by the National Association of Consumer Bankruptcy Attorneys (2012) noting that the default rate on student loans is around 20 percent, loans were labeled a “debt bomb.” Further, in Canada, workers with more student loans were less likely to own their own homes or to have savings or investments (Luong, 2010).
Although there is a growing body of work examining the consequences, less research has examined predictors of loan acquisition or attitudes toward student loans. Many students believe that loans are either inevitable or a necessary choice. In a study of United Kingdom students, Christie and Munro (2003) noted that many students are ill informed about the decision to take out loans. Recently, Chudry, Foxall, and Pallister (2011) examined attitudes toward borrowing as an application of the theory of planned behavior. The theory of planned behavior (Ajzen, 1991) conceptualizes behavior as the result of a combination of attitudes, subjective norms, and perceived behavioral control. Chudry et al. (2011) reported support for this model in a study involving student loans, such that all three areas affect intention to borrow.
1.2 Credit Cards and Student Loans among Brazilian College Students
The credit industry has been growing rapidly in Brazil. Between January 2004 and January 2011, the volume of credit increased from about US$232.11 billion to about US$0.95trillion, largely due to personal credit (Depec, 2011). Given the pace of this increase, it is not surprising that there is not much research on credit card debt in Brazil. In one of the few studies, Veludo-de-Oliveira, Ikeda, and Santos (2004) reported compulsive buying as a predictor of risk for debt in young adults with credit cards. More recently, Mendes-Da-Silva, Toshiro Nakamura, and Carrasqueira de Moraes (2012) examined credit card risk behavior among 769 college students. Their results indicated that those with more credit cards were at increased likelihood of risky credit behavior and that those students who reported knowing their interest rates were at decreased risk, suggesting that knowledge may be protective. As with credit cards, little is known about the predictors and the impact of student loans in Brazil.
135 Published by SCHOLINK CO., LTD
However, it appears that debt in general is a significant issue among young adults. In March 2012, 41% of young people aged less than 30 years could not pay their debts, according to the Commercial Association of São Paulo (Instituto Gastão Vidigal, 2012). Given the high default rate, the importance of studying the causes and effects of debt, including student loans, is clear.
1.3 Goals of the Present Study
The present study sought to clarify attitudes toward money and debt among Brazilian college students and to compare these attitudes with American students, who have a much longer history of credit card use. Although little work has been conducted to date examining student debt and attitudes toward debt in Brazil, several differences were anticipated between the American and Brazilian samples. A recent study comparing American students with another emerging market, China, found that Chinese students were much more positive about credit cards than American students, but reported lower levels of financial self-confidence and well-being (Norvilitis & Mao, 2012). It is unclear whether similar attitudes would be present in other emerging markets where college students have only recently gained access to credit cards.
It was expected that fewer Brazilian college students would report possession of credit cards and credit card debt. Therefore, in addition to examining predictors of credit card debt, the present study examined predictors of a correlate of positive financial states: perceived financial well-being.
The study sought to replicate and expand the findings of Chudry et al (2011), who examined the theory of planned behavior among college students considering student loans in the United Kingdom. Specifically, we examined the role of the theory of planned behavior in predicting students’ debt to income ratioand, as in the original study, student loan debt. We further examined the role of these same components in predicting financial well-being. Although financial well-being is not a behavior, it was expected that the theory of planned behavior factors would be predictive of well-being because well-being is related to these behavioral decisions. The attitudes examined included student attitudes toward debt, credit card use, and financial self-confidence; subjective norms included measures of social comparison generally and financial social comparison; and perceived behavioral control was assessed by self-reported ability to delay gratification. In addition, a separate social and educational predictor, parental financial education, was included.
2. Method
2.1 Participants
A total of 1257 college students, 814 (65%) from Brazil and 443 (35%) from the United States participated (Table 1). Of the American participants, 295 (67%) were white, 93 (21%) were African American, 31 (7%) were Hispanic, 17 (4%) were Asian American, and 4 (1%) were Native American. Three Americans did not report ethnicity. Of the Brazilian participants, 621 (76%) were white, 87 (11%) were Hispanic, 58 (7%) were Asian, 40 (5%) were of African descent, and 8 (1%) were native
136 Published by SCHOLINK CO., LTD
Brazilian.
2.2 Materials and Procedure
Prior to recruitment, all measures were translated into Portuguese by a native and professional teacher of finance resident in Brazil and back translated into English by another bilingual. The American sample was obtained from a medium-sized state university in the northeast. The Brazilian sample was obtained from a medium-sized state university in São Paolo. Participants were recruited from a variety of departments and classes throughout the campuses, including core courses. The study was explained, highlighting that it was voluntary and confidential.
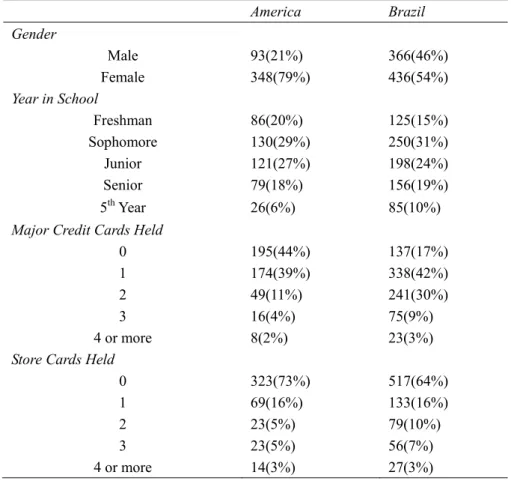
Table 1. Demographics and credit cards by Country
America Brazil Gender Male 93(21%) 366(46%) Female 348(79%) 436(54%) Year in School Freshman 86(20%) 125(15%) Sophomore 130(29%) 250(31%) Junior 121(27%) 198(24%) Senior 79(18%) 156(19%) 5th Year 26(6%) 85(10%)
Major Credit Cards Held
0 195(44%) 137(17%)
1 174(39%) 338(42%)
2 49(11%) 241(30%)
3 16(4%) 75(9%)
4 or more 8(2%) 23(3%)
Store Cards Held
0 323(73%) 517(64%)
1 69(16%) 133(16%)
2 23(5%) 79(10%)
3 23(5%) 56(7%)
4 or more 14(3%) 27(3%)
Note. Gender varied by culture, χ2=73.62, p=<.001, as did year in school χ2 (1, 4)=11.07, p=.03.
Written consent, questionnaires, and computer scoring sheets were distributed. Students were instructed to return the signed consent form with the completed computer scoring sheet and participant information sheet to the class in which it was distributed. Extra credit was given for participation, with amounts varying at instructors’ discretion.
The questionnaire included three dependent variables: students’ total student loans, their credit card debt to income ratio, and perceived financial well-being. Predictor variables were selected to reflect the
137 Published by SCHOLINK CO., LTD
theory of planned behavior components of attitudes, social comparison, and perceived behavioral control and the social and educational predictor of parental financial education.
In addition to demographic information and information about income and credit card, student loan, and other debt, the following measures were administered.
Dependent variable:
2.2.1 Financial Well-Being Scale (FWBS; Norvilitis, Szablicki, &Wilson, 2003)
This ten-item measure is completed on a five-point scale from strongly agree to strongly disagree, with higher mean scores indicating greater perceived financial well-being. In the initial article, Cronbach’s alpha was found to be acceptable (α=.74). In the present study, Cronbach’s alpha was .79 for the American sample, but only 60 for the Brazilian sample. Eliminating items did not appreciably change reliability and thus the decision was made to leave the scale intact.
Predictor variables: Attitudes:
2.2.2 Financial Self-Confidence (Norvilitis & Mao, 2012)
This ten-item measure is completed on a five-point Likert-type scale from Strongly Agree to Strongly
Disagree and includes items such as “I will be able to handle my money in the years to come.”
Although reliability analysis yielded coefficient alpha of .80 for the American sample, reliability was low (α=.61) for the Brazilian sample. Eliminating two items (“I wish that I knew more about managing my money” and “If I needed to take out a loan, I would know how to start the process”) improved reliability to .66 for the Brazilian sample, but decreased it just to .79 for the American sample. Thus, analyses were completed using the 8-item scale. Higher scores indicate greater self-confidence.
2.2.3 Student Attitudes toward Debt (Davies & Lea, 1995)
This 14-item measure is scored on a five-point Likert-type scale from Strongly Agree to Strongly
Disagree. It is designed to assess debt tolerance in college students, with higher scores indicating
greater tolerance. The authors report Cronbach’s alpha of .79. In the present study, reliability was poor for both samples (America α=.49; Brazil α=.51). There was no way to improve reliability through the elimination of any items. Recently, Haultain, Kemp, and Chernyshenko (2010) suggested that this scale is bidimensional and composed of independent Fear of Debt and Debt Utility factors. We explored this possibility as well. Using the Haultain et al factors, reliability was still weak. Given the limitations of options, the decision was made to leave this scale intact.
2.2.4 Modified Credit Card Use Scale (Raghubir & Srivastava, 2008)
This 20-item measure is scored on a five-point Strongly Agree to Strongly Disagree scale, tapping attitudes toward credit and how individuals feel about their own credit use. In the original scale, most items reflect attitudes toward credit cards in those who actually have cards. In the present study, because it was assumed that not all college students would have credit cards, an additional 10 items were added examining attitudes among those who both do and do not have credit cards (Norvilitis & Mao, 2012).
138 Published by SCHOLINK CO., LTD
Principal components factor analysis with varimax rotation in the two samples yielded two factors among those who both do and do not have credit cards, Credit Card Positives (7 items; America α=.68, Brazil α=.62) and Credit Card Negatives (6 items; America α=.71, Brazil α=.63). Higher scores indicate greater belief in positives and negatives about credit card use, respectively. One item failed to load on either factor.
An additional three factors emerged among only those who have credit cards. These included Credit Use Guilt (6 items, America α=.76, Brazil α=.72) and Credit Card Positive Control, reflecting positive attitudes, such as that credit cards simplify bill paying and are helpful in an emergency (5 items, America α=.63, Brazil α=.61). Higher scores indicate more Credit Use Guilt and greater belief in Credit Card Positive Control, respectively. The third factor reflected concerns related to safety and pride, but was very weak (4 items, America α=.37, Brazil α=.37) and, therefore, was not included in analyses. Predictor Variables: Social Comparison
2.2.5 Iowa-Netherlands Comparison Orientation Measure (INCOM; Gibbons & Buunk, 1999)
This 11-item measure is completed on a five-point Strongly Agree to Strongly Disagree scale and is used to assess individual’s tendency to socially compare themselves with others. In the present study, internal consistency was good (American α=.84, Brazilian α=.82) and no items were removed. Higher mean scores indicate greater levels of social comparison.
2.2.6. Financial Social Comparison (Norvilitis & Mao, 2012)
The nine-item scale was modeled on the INCOM and is designed to specifically examine financial social comparison. In the present study, reliability was .78 for the American sample and .70 for the Brazilian sample. Eliminating items did not appreciably change reliability and, thus, the scale was left intact. As with the INCOM, higher scores indicate greater levels of social comparison.
Predictor Variable: Behavioral Control
2.2.7. Delay of Gratification (Ray & Najman, 1985)
This 12-item measure is scored yes, no, or unsure. It covers deferment of gratification in purchases and other areas (e.g., “Would you describe yourself as often being too impulsive for your own good?”). The authors report acceptable internal consistency of the scale (α=.72). In the present study, reliability was similar to the original study (America α=.73, Brazil α=.66). Elimination of items did not improve reliability. Higher scores indicated better ability to delay gratification.
Predictor Variable: Parental Modeling
2.2.8 Parental Financial Education Scale (Norvilitis & MacLean, 2010)
The scale is composed of 30 statements about how participants’ parents taught them about money, either directly or indirectly. Items were scored on a five-point Likert scale from Strongly Agree to
Strongly Disagree. The original scale comprised four subscales: Parent Instruction, Parent Facilitation,
Parent Worries, and Parent Reticence.
139 Published by SCHOLINK CO., LTD
yielded two factors that were reliable in both cultures. The first, Positive Parenting, was composed of 14 items. This subscale included direct instruction about budgeting and financial issues (America α=.89, Brazil α=.83). The second, Negative Parenting comprises 7 items, examining participants’ perceptions of how much their parents worried about their own finances and failed to teach about money (America α=.76, Brazil α=.73). The remaining items did not load onto factors in one culture or the other. Higher scores on Positive Parenting indicate greater teaching by parents. Higher scores on Negative Parenting indicate more parental worries.
3. Results
3.1 Credit Cards, Debt, and Income
Contrary to expectations, there were more major credit cards among the Brazilian sample [Table 1; 2(1,
4)=137.14, p<.001, r=.29]. Store credit cards were similarly more common among the Brazilian sample [2(1, 4)=18.58, p=.001, r=.11]. However, among those with credit cards, either major credit cards or
store cards, 31% (n=76) of American students reported regularly carrying a balance and an additional 8 % (n=20) reported often carrying a balance. Among the Brazilian sample, 7% (n=50) reported regularly carrying a balance and 7% (n=46) reported often carrying a balance. Thus, although Brazilian students were more likely to have credit cards, among those with credit cards, American students were more likely to report carrying a balance [2(1, 4)=90.11, p<.001, r=.29].
When asked to report the amount of their current debt, of the 368 Americans who answered the question (including those with no current credit cards), 75% (n=276) reported no current credit card debt. Among the 688 Brazilian students who reported debt, 47% (n=326) reported no current credit card debt. Among the American sample, two participants reported credit card debt that was considerably higher than all other participants ($30,000 and $50,000). These two outliers were excluded from subsequent analyses. Of those with credit cards, the American students reported an average credit card debt of $900 USD (SD=2339; Range 0 to 16300). Among the Brazilian sample, students reported an average debt of $461 (SD=1011; Range 0 to 8400; all amounts have been converted from the Real to American dollars for purposes of comparison). Among the American sample, the number of cards held was related to reported credit card debt (r=.32, p=.001). This relationship was also present for the Brazilian sample, but the magnitude was much lower (r=.09, p=.04).
When asked to report their student loan debt, among the 365 responding, 32% (n=116) of American students reported no student loan debt. Among those reporting loans, the average was $13216 (SD=12764, Range 723 to 100,000). Among the 648 in the Brazilian sample responding, 84% (n=546) reported no student loan debt. Among those with loans, the average loan debt was $1748 (SD=2657; Range 16.80 to 12320).
Among the American students reporting income, average reported yearly income as $11,132 (SD=15317), with 60 students reporting that they earned no income. Among the Brazilian students, average yearly income was $7010 (SD=7051), with 132 reporting that they did not earn personal
140 Published by SCHOLINK CO., LTD
income.
Given the differences between the cultures, comparisons of overall debt and income do not make sense. However, a comparison of the credit card debt to income ratio of students in the two countries is possible. Controlling for both gender and year in school, among those who report holding credit cards, the credit card debt to income ratio was essentially the same between the two countries [Brazil: M=.08,
SD=.16; America: M=.08, SD=.29; F(1, 691)=.04; p=.84]. When all students are included, regardless of
whether they have credit cards, the debt to income ratio remains non-significant [Brazil: M=.08,
SD=.16; America: M=.06, SD=.29; F(1, 849)=.96; p=.33]. 3.2 Differences between Brazil and the United States
Two multivariate ANCOVAs comparing the two countries and controlling for gender and year in schoolwere completed. The first included all of the variables except Credit Use Guilt and Credit Card Positive Control. The MANCOVA for these two was calculated separately because these variables included only those participants who actually had credit cards. Because of potential differences in response sets, Box’s Test of Equality of Covariance Matrices and Levene’s Test of Equality of Error Variances were calculated. There were significant differences in variance among six variables (Financial Well-Being, Financial Social Comparison, Positive Parenting, Financial Self-Confidence, Student Attitudes toward Debt, and Delay of Gratification). Therefore, to correct for this, the more conservative alpha level of .025 was used for all comparisons, as recommended by Tabachnick and Fedell (2007). Please see Table 2.
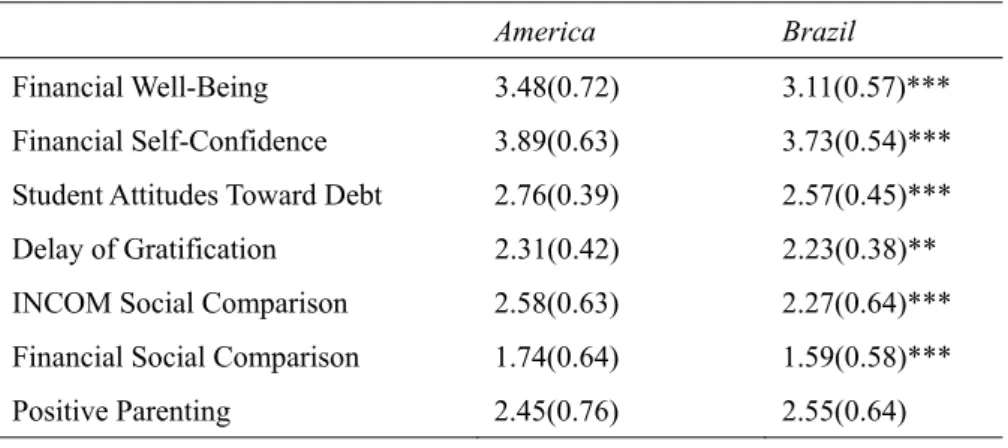
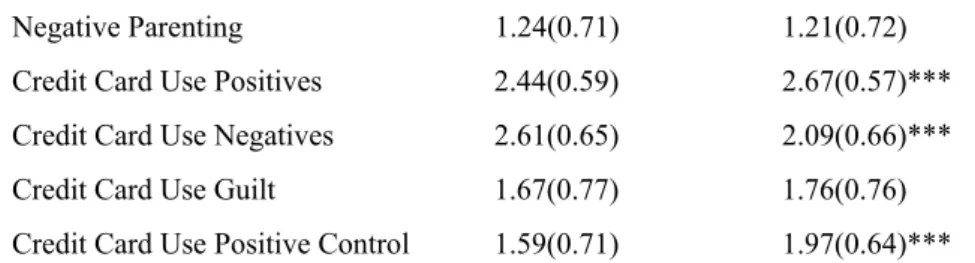
In comparison with the Brazilian participants, results indicated that the American sample was more financially self-confident, had more positive attitudes toward debt, reported a better sense of financial well-being and poorer delay of gratification, and was more likely to engage in social comparison and financial social comparison. American students were more likely to report negative and less likely to report positive attitudes toward credit cards. Further, among those who had credit cards, American students reported less positive control and status related to credit card use. There were no differences in positive parenting, negative parenting, or credit card guilt related to credit card use.
Table 2. Differences between countries on financial measures
America Brazil
Financial Well-Being 3.48(0.72) 3.11(0.57)***
Financial Self-Confidence 3.89(0.63) 3.73(0.54)*** Student Attitudes Toward Debt 2.76(0.39) 2.57(0.45)*** Delay of Gratification 2.31(0.42) 2.23(0.38)** INCOM Social Comparison 2.58(0.63) 2.27(0.64)*** Financial Social Comparison 1.74(0.64) 1.59(0.58)***
141 Published by SCHOLINK CO., LTD
Negative Parenting 1.24(0.71) 1.21(0.72)
Credit Card Use Positives 2.44(0.59) 2.67(0.57)*** Credit Card Use Negatives 2.61(0.65) 2.09(0.66)*** Credit Card Use Guilt 1.67(0.77) 1.76(0.76) Credit Card Use Positive Control 1.59(0.71) 1.97(0.64)***
Note. *** p<.001; **p<.01; *p<.025. All scores are mean scores on a scale of 1 to 5, with the exception of Delay of Gratification, which is a mean score on a scale of 1 to 3.
3.3 Relationships between Financial Well-Being, the Debt to Income Ratio, Student Loans, and Income
To examine relationships between the dependent variables, a series of correlations was completed. In the United States, student loans were not related to the credit card debt to income ratio (r=.11, p=.07). However, both student loans (r=-.36, p<.001) and the debt to income ratio (r=-.28, p<.001) were related to perceived financial well-being.
In Brazil, student loans were weakly but significantly correlated with the debt to income ratio (r=.09,
p=.04). Further, student loans were weakly related to lower levels of financial well-being (r=-.08, p=.04), but the debt to income ratio was not (r=-.06, p=.16).
To examine whether Financial Well-Being is due to students having more money, correlations were completed with income. Income was unrelated to Financial Well-Being (United States r=- .06, p=.25; Brazil r=-.05, p=.15), indicating that, in the United States, it is debt driving the relationship between financial well-being and the debt to income ratio.
3.4 Predicting the Debt to Income Ratio
Two regression analyses, one for each country, were completed to examine predictors of the credit card debt to income ratio. Once again, gender and year in school were entered on the first step. Predictors on the second step included Student Attitudes toward Debt, Delay of Gratification, Social Comparison, Financial Social Comparison, Positive Parenting, Negative Parenting, Credit Card Positives, Credit Card Negatives, and Financial Self-Confidence.
For the American sample, a higher debt to income ratio was related to increasing year in school, more positive student attitudes toward debt, lower levels of delay of gratification, and by both more positive parenting, and more negative parenting [R=.35, R2=.12, Adj. R2=.09, F(9, 255)=3.26, p<.001; See Table
3].
Among the Brazilian sample, the model examining the debt to income ratio was not significant [R=.19,
R2=.04, Adj. R2=.01, F(9, 463)=1.54, p=.12].
Table 3. Summary of regression analyses predicting the debt to income ratio
Predictor Variable B SE B Β R2 Change
142 Published by SCHOLINK CO., LTD
Step 1 Gender .02 .04 .03 .04** Year in School .04 .01 .19*** Step 2 Gender .02 .04 .43 .09** Year in School .04 .01 .17**
Student Attitudes Toward Debt
.08 .04 .13*
Fin. Self-Confidence .03 .03 .08
Credit Card Positives .03 .03 .08
Credit Card Negatives .01 .03 .04
INCOM Social Comparison -.02 .03 -.06 Financial Social Comparison -.01 .03 -.03 Positive Parenting .07 .02 .21** Negative Parenting .08 .03 .21** Delay of Gratification -.10 .04 -.17* Brazil Step 1 Gender .01 .02 .03 .00 Year in School .00 .01 .00 Step 2 Gender -.01 .02 -.03 .04* Year in School .00 .01 .03
Student Attitudes Toward Debt
.01 .02 .04
Fin. Self-Confidence -.03 .02 -.08*
Credit Card Positives .02 .01 .08*
Credit Card Negatives .00 .01 -.00
INCOM Social Comparison .02 .01 .07 Financial Social Comparison -.02 .02 -.05 Positive Parenting .00 .01 .01
143 Published by SCHOLINK CO., LTD
Negative Parenting .02 .01 .07
Delay of Gratification -.03 .02 -.08
Note. **p< .05; *p< .10.
3.5 Predicting Student Loan Debt
Finally, two regression analyses, one for each country, were completed with the same predictors as the debt to income ratio analysis to examine predictors of student loans with the exception of the Credit Card Positives and Credit Card Negatives as these are theoretically unrelated to student loans.
For the American sample, greater student loan debt was predicted by increasing year in school and lower levels of delay of gratification[R=.33, R2=.11, Adj. R2=.09, F(7, 324)=4.94, p<.001; See Table 4].
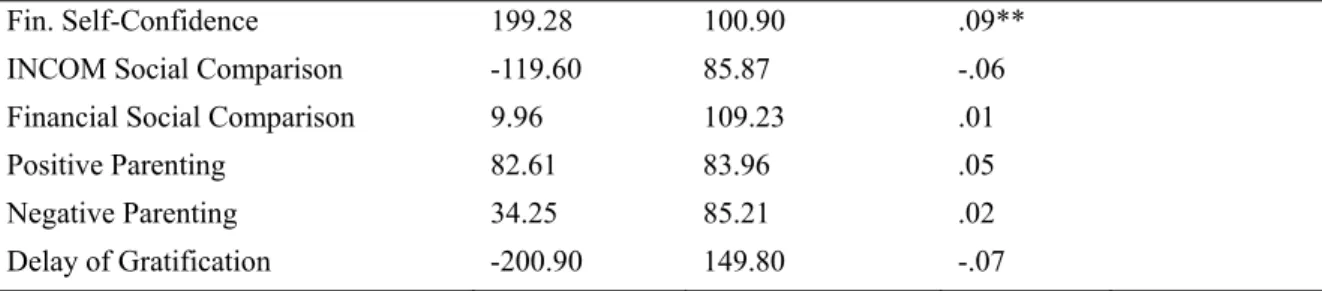
Among the Brazilian sample, the model predicting student loans was not significant [R=.13, R2=.02,
Adj. R2=.00, F(7, 547)=.97, p=.46].
Table 4.Summary of Regression Analyses Predicting Student Loans
Predictor Variable B SE B Β R2 Change
United States Step 1 Gender 2151.21 1668.20 .07 .07*** Year in School 2699.38 573.80 .25 Step 2 Gender 2316.89 1695.37 .08 .04* Year in School 2728.21 578.41 .26***
Student Attitudes Toward Debt -533.20 1786.70 -.02
Fin. Self-Confidence 672.13 1203.90 .03
INCOM Social Comparison -1034.44 1192.64 -.05
Financial Social Comparison 975.91 1241.45 .05
Positive Parenting -1349.97 1052.93 -.08 Negative Parenting -11.73 1129.99 -.00 Delay of Gratification -4698.60 1844.03 -.16** Brazil Step 1 Gender -36.98 100.10 -.02 .00 Year in School -28.03 40.65 -.03 Step 2 Gender -35.94 102.48 -.02 .02 Year in School -30.69 41.39 -.03
144 Published by SCHOLINK CO., LTD
Fin. Self-Confidence 199.28 100.90 .09**
INCOM Social Comparison -119.60 85.87 -.06
Financial Social Comparison 9.96 109.23 .01
Positive Parenting 82.61 83.96 .05
Negative Parenting 34.25 85.21 .02
Delay of Gratification -200.90 149.80 -.07
Note. ***p<.001; **p<.05; *p<.10.
3.6 Predicting Financial Well-Being
Two regression analyses, one for each country, were completed to examine predictors of students’ financial well-being. Gender and year in school were entered on the first step. Predictors on the second step were Student Attitudes toward Debt, Delay of Gratification, Social Comparison, Financial Social Comparison, Parent Teaching, Parent Worries, Credit Card Negatives, and Credit Card Positives. In addition to the psychological variables, the debt-to-income ratio and student loans were also included as predictors on step 3. Because of concern about collinearity between variables, diagnostics were completed. All variance inflation factors were below the accepted threshold of 2.0.
For the American sample, Financial Well-Being was predicted by lower debt to income ratios, less student loan debt, greater financial self-confidence, more positive parenting, and less social comparison [R=.62, R2=.38, Adj. R2=.35, F(13, 241)=11.33, p<.001; See Table 5].
Among the Brazilian sample, Financial Well-Being was predicted by fewer student loans, greater financial self-confidence, less negative parenting, and fewer negative beliefs about credit cards [R=.34,
R2=.11, Adj. R2=.09, F(13, 420)=4.17, p<.001].
Table 5.Summary of Regression Analyses Predicting Financial Well-Being
Predictor Variable B SE B Β R2 Change
United States Step 1 Gender -.12 .11 -.07 .02 Year in School .06 .04 .04 Step 2 Gender --.18 .10 -.10 .25*** Year in School -.05 .03 -.08
Student Attitudes Toward Debt -.14 .11 -.08
Fin. Self-Confidence .25 .07 .23***
Credit Card Positives .06 .08 .05
Credit Card Negatives .04 .07 .04
INCOM Social Comparison -.12 .07 -.11
145 Published by SCHOLINK CO., LTD
Positive Parenting .14 .06 .16* Negative Parenting -.10 .07 -.10 Delay of Gratification .21 .11 .13* Step 3 Gender -.12 .09 -.07 .12*** Year in School .02 .03 .04
Student Attitudes Toward Debt -.08 .10 -.04
Fin. Self-Confidence .28 .07 .26***
Credit Card Positives .04 .07 .03
Credit Card Negatives .08 .06 .07
INCOM Social Comparison -.17 .07 -.15**
Financial Social Comparison -.04 .07 -.04
Positive Parenting .16 .06 .18**
Negative Parenting -.07 .07 -.07
Delay of Gratification .08 .10 .05
Debt to Income Ratio -.55 .16 -.19***
Student Loans -1.58E-5 .00 -.31***
Brazil Step 1 Gender -.02 .05 -.02 .01 Year in School .03 .02 .07 Step 2 Gender -.02 .05 -.02 .10*** Year in School .01 .02 .02
Student Attitudes Toward Debt .05 .07 .04
Fin. Self-Confidence .13 .06 .12*
Credit Card Positives .03 .05 .03
Credit Card Negatives -.11 .04 -.13*
INCOM Social Comparison -.06 .05 -.07
Financial Social Comparison .02 .05 .03
Positive Parenting .02 .05 .02 Negative Parenting -.12 .05 -.15** Delay of Gratification .09 .08 .06 Step 3 Gender -.03 .05 -.02 .01 Year in School .01 .02 .02
Student Attitudes Toward Debt .06 .07 .05
Fin. Self-Confidence .13 .06 .12**
146 Published by SCHOLINK CO., LTD
Credit Card Negatives -.10 .04 -.12**
INCOM Social Comparison -.06 .05 -.07
Financial Social Comparison -.03 .06 -.03
Positive Parenting .02 .05 .02
Negative Parenting -.12 .05 -.14**
Delay of Gratification .08 .08 .05
Debt to Income Ratio -.21 .17 -.06
Student Loans -4.08E-5 .00 -.09*
Note. *** p<.001; **p<.01; *p<.05. 4. Discussion
Overall, the American sample was more financially self-confident, had more positive attitudes toward debt, reported better financial well-being and poorer delay of gratification, and was more likely to engage in social comparison and financial social comparison. American students were more likely to hold negative credit cardattitudes, and less likely to report positives related to credit card use. Further, among those who had credit cards, American students reported less positive control and status related to credit card use.
The present study sought to examine the utility of a theory of planned behavior in predicting credit card debt to income ratios and student loans and, a consequence of behavior, perceived financial well-being. It is interesting that different pieces of the model appear useful in predicting different aspects of financial health. In the United States, both attitudes toward money and social comparison predicted well-being, whereas in Brazil, only attitudes predicted well-being. Prior work has established that social comparison is linked with satisfaction with income and success (McBride, 2010), debt among adults in Great Britain (Lea, Webley, & Walker, 1995), and financial well-being among American college students (Norvilitis & Mao, 2012). Although the present study replicates this finding in predicting well-being among American college students, social comparison does not predict financial well-being or debt among Brazilian college students. Further, in both samples, although attitudes and social comparison were related to perceptions of well-being, perceived behavioral control was not. On the other hand, in the United States, delay of gratification was a predictor of both student loan debt and the credit card debt to income ratio. Although attitudes toward debt were related to the debt to income ratio, attitudes were not related to student loans nor was social comparison related to either type of debt. The importance of behavioral control replicates findings from other work in the United States and Europe that has identified poor delay of gratification, low self-control and compulsive spending as related to increased risk of indebtedness (Livingstone & Lunt, 1992; Lunt & Livingstone, 1991; Norvilitis et al., 2006; O’Guinn & Faber, 1989; Strayhorn, 2002; Watson, 2003).
In the sample from Brazil, none of the hypothesized theory of planned behavior variables were related to either type of debt, although lower levels of financial self-confidence and more positive attitudes
147 Published by SCHOLINK CO., LTD
toward credit cards approached significance in predicting the debt to income ratio. The reasons for this are not clear. It is possible that the lower reliabilities of some of the measures affected the results. However, this was not the case in the regression predicting financial well-being, in which a generally similar pattern to the United States emerged. A second possibility is that there may not have been enough heavily indebted Brazilian students to identify predictors of debt. Although many students in Brazil have credit cards, the absolute dollar amounts of their debts were fairly low. Thus, it is possible that there was a restriction of range problem: because all debts were low, it may have been impossible to distinguish among debtors.
In addition to the theory of planned behavior, the study also examined the contribution of parental modeling and education. Perhaps most striking across the regression analyses is the role of parents in predicting debt to income ratio and financial well-being. Clearly, parents play a large role in shaping attitudes toward money both by the positive behaviors that they teach and model and their own negative behaviors and worries. Parents may not realize that their children are taking note of the parents’ anxiety about money. However, in the United States, positive parenting practices were also related to increased debt to income ratios. It is possible that some students become too comfortable with debt after having many conversations with their parents. Thus, parents must walk a fine line: negative parenting can lead to more debt or poor financial well-being, but so can positive parenting. Perhaps this is a similar effect to that found in research on adolescent sexual behavior: those parents who most often discuss risks associated with sex have teens who are less likely to use condoms and are more likely to have sex (Deptula, Henry, & Schoeny, 2010). The speculation is that this is due to teens becoming overconfident in their knowledge and believing that parents support teen sexual activity. In this same way, it is possible that college students who have heard much about debt from their parents may overestimate their own ability to handle debt. Clearly, this is speculative and, given that it was found in only one culture, warrants further research. Nonetheless, it appears that, instead of waiting until students are in college to educate them about money, appropriate interventions should be developed to assist parents in talking about and modeling healthy financial behaviors well ahead of college.
Credit card debt among American college students may be declining. Norvilitis, Szablicki, and Wilson (2003) reported credit card debt of $1937, among those with credit cards. A few years later, mean credit card debt was $1401 (Norvilitis et al, 2006). In the present study, mean credit card debt was lower, dropping to $900. Further, in the previous studies, 77 % and 74 % of students reported holding at least one major credit card. Only 56% of American students in the present study reported having at least one major credit card. The reason for this decline is unclear, but is likely related to legislation limiting credit card availability for college students. However, growing awareness of the issue and increasingly negative attitudes toward credit cards and debt may also play a role. Whatever the cause, it appears that American students are less positive about the use of credit cards than in the past.
148 Published by SCHOLINK CO., LTD
On the other hand, students in Brazil have more positive attitudes toward credit cards. Although the debt to income ratio is similar among students who hold credit cards, more Brazilian students possess cards and they report greater endorsement of the positive qualities of credit cards and less endorsement of the negative. This may be related to recent growth in the credit card market in Brazil (Mendes-da-Silva, Toshiro Nakamura, & Carrasqueira de Moraes, 2012); that is, because credit cards have only fairly recently become available to college students, it is possible that the negatives have yet to be seen. Similar results were found among Chinese college students. The Chinese students, for whom credit cards are even newer than among Brazilian students, reported positive attitudes and beliefs about credit cards (Norvilitis & Mao, 2012).Indeed, the relatively low number of heavily indebted Brazilian students suggests that the negative effects may have yet to emerge in this group. All of this suggests that governments, colleges, and parents in countries with emerging credit card markets have an opportunity to help their young people avoid the same pitfalls that have befallen students in countries who have had access to credit cards longer. Further research examining what specific steps at what specific ages help to reduce risk would be useful to guide these endeavors. It is noteworthy that the student loans are not predicted by the same factors as the credit card debt and financial well-being. Indeed, with the exception of year in college and delay of gratification in the American sample, there were no significant predictors of student loans in either culture. Given that student loans appear to be increasing in prevalence, at least in the United States, further research on predictors and effects of student loans is necessary. It is possible that student loans are truly simply due to financial circumstances, however, it is also possible that other factors are predictive as well, such as financial priorities or motivational issues.
A secondary benefit of the study is the investigation of the reliability of several Western measures of financial attitudes in a Brazilian sample. Although analyses indicated that not all of the items worked well in both samples, several of the scales were similarly reliable, although reliability tended to be lower throughout the Brazilian sample. Other measures, such as the Student Attitudes Toward Debt scale, were more problematic. Clearly, there is something different about how these scales function in Brazil or about how Brazilian college students think about money.Future research should continue to investigate the utility of these measures in a new culture.
Although the results of the present study are interesting, there are limitations to the study. Most notably, all data are self-report. In both the American and Brazilian samples, a number of participants declined to report their income and debt. It is impossible to know if that group had significantly higher or lower levels of debt or if they are in debt but unaware of the amount. Further, participants described their parents’ financial practices. It is possible that parents might report different perspectives on the education and modeling that they provided. In addition, prior research has identified a relationship between socioeconomic status and financial self-confidence. Socio-economic status was not assessed in the present study, although students’ income was unrelated to financial well-being. Because all
149 Published by SCHOLINK CO., LTD
participants were college students, it is possible that the SES of families in which they were raised may influence these relationshipsand may influence what lessons the parents teach and are able to teach about money. Further, data from each country were collected from one campus. Although the results generally support prior research done on other campuses and in other countries, it is possible that these results may not generalize to either the United States or Brazil as a whole. Finally, the data are correlational. A longitudinal study would better allow examination of the causal relationships involved. Despite the limitations, the study raises interesting questions about the universality of predictors of college student debtand about the implications of positive and negative views of credit cards. It is clear further research is necessary to understand how to best prevent students from becoming burdened by debt.
Acknowledgement
This work is part of the preliminary results of a project proposal of a national indicator of happiness for Brazil. The authors are grateful to the financial support provided by the Conselho Nacional de
Desenvolvimento Científico e Tecnológico (CNPq), which enabled the research supporting this article.
References
Boddington, L., & Kemp, S. (1999). Student debt, attitudes toward debt, impulsive buying, and financial management. New Zealand journal of psychology, 28(2), 89-93.
Caplan, L. J., & Schooler, C. (2007). Socioeconomic status and financial coping strategies: The mediating role of perceived control. Social psychology quarterly, 70(1), 43-58.
Credit Card Accountability Responsibility and Disclosure Act (2009). Retrieved from: http://www.govtrack.us/congress/bills/111/hr627/text
Christie, H., & Munro, M. (2003). The logic of loans: Students’ perceptions of the costs and benefits of the student loan. British journal of sociology of education, 24, 621-636.
Chudry, F., Foxall, G., & Pallister, J. (2011). Exploring attitudes and predicting intentions: Profilingstudent debtorsusing an extendedtheory of plannedbehavior. Journal of applied social
psychology, 41 (1), 119-149.
Davies, E., &Lea, S. E. G. (1995). Student attitudes to student debt. Journal of economic psychology,
16, 663-679.
Depec, Departamento De Pesquisas Econômicas Do Bradesco. (2011), Destaque Depec, No. 10, Year IX, April.
Deptula, D. P., Henry, D. B., & Schoeny, M. E. (2010). How can parents make a difference? Longitudinal associations with adolescent sexual behavior. Journal of family behavior, 24, 731-739. Forbes, J., & Kara, S. (2010). Confidence mediates how investment knowledge influences investing
self-efficacy. Journal of economic psychology, 31, 435-443.
150 Published by SCHOLINK CO., LTD
scale of social comparison orientation. Journal of personality and social psychology, 76, 129-142. Haultain, S., Kemp, S., & Chernyshenko, O. S. (2010).The structure of attitudes to student debt.
Journal of economic psychology, 31, 322-330.
Hayhoe, C. R., Leach, L. J., & Turner, P. R. (1999). Discriminating the number of credit cards held by college students using credit and money attitudes. Journal of economic psychology, 20, 643-656. Hirt, J. B., & Nick, H. (1999). How students manage money: Some developmental implications.
NASPA Journal, 37, 349-360.
Instituto de Economia Gastão Vidigal (2012). Indicadores econômicos do Brasil. Accessed August 2012, Retrieved from http://portal.acsp.com.br/instituto-de-economia.
Kim, D. (2007). The effect of loans on students’ degree attainment: Differences by student and institutional characteristics. Harvard educational review, 77(1), 64-100.
Lange, C., & Byrd, M. (1998). The relationship between perceptions of financial distress and feelings of psychological well-being in New Zealand university students. International journal of
adolescence and youth, 7, 193-209.
Lea, S. E. G., Webley, P., & Walker, C. M. (1995). Psychological factors in consumer debt: Money management, economic socialization, and credit use.Journal of economic psychology, 16, 681-701.
Livingstone, S. M., & Lunt, P. K. (1992). Predicting personal debt and debt repayment: Psychological, social, and economic determinants. Journal of economic psychology, 13, 111-134.
Lunt, P. K., & Livingstone, S. M. (1991). Everyday explanations for personal debt: A network approach.
British journal of social psychology, 30, 309-323.
Luong, M. (2010).The financial impact of student loans. Perspectives on labour and income, 22(1), 29-42.
McBride, M. (2010).Money, happiness, and aspirations: An experimental study. Journal of economic
behavior & organization, 74, 262-276.
Mendes-da-Silva, W., Nakamura, W. T. & Moraes, D. C. (2012). Credit card risk behavior on college campuses: evidence from Brazil. BAR. Brazilian administration review, 9, 351-373.
National Association of Consumer Bankruptcy Attorneys (2012).The student loan “debt bomb”:
America’s next mortgage-style crisis? Washington, DC: Author. Retrieved from
http://nacba.org/Portals/0/Documents/Student%20Loan%20Debt/020712%20NACBA%20student %20loan%20debt%20report.pdf
Nellie Mae (2005).Undergraduate students and credit cards in 2004: An analysis of usage rates and
trends. Braintree, MA: Author. Retrieved from http://www.nelliemae.com/pdf/ccstudy_2005.pdf
Norvilitis, J. M., & MacLean, M. G. (2010). The role of parents in college students’ financial behaviors and attitudes. Journal of economic psychology, 31, 55-63.
151 Published by SCHOLINK CO., LTD
and the United States. International journal of psychology.
Norvilitis, J. M., Merwin, M. M., Osberg, T. M., Roehling, P. V., Young, P., & Kamas, M. M. (2006). Personality factors, money attitudes, financial knowledge and credit card debt in college students.
Journal of applied social psychology, 36, 1395-1413.
Norvilitis, J. M., Szablicki, P. B., & Wilson, S. D. (2003). Factors influencing levels of credit card debt in college students. Journal of applied social psychology, 33, 935-947.
O’Guinn, T. C., & Faber, R. J. (1989). Compulsive buying: A phenomenological exploration. Journal
of consumer research, 16(2), 147-157.
Pinto, M. B., Parente, D. H., & Palmer, T. S. (2001). College student performance and credit card usage. Journal of college student development, 42(1), 49-58.
Raghubir, P., & Srivastava, J. (2008). Monopoly money: The effect of payment coupling and form on spending behavior. Journal of experimental psychology: Applied, 14, 213-225.
Ray, J. J., & Najman, J. M. (2001).The generalizability of deferment of gratification. The journal of
social psychology, 126, 117-119.
Robb, C. A. (2011). Financial knowledge and credit card behavior of college students. Journal of family
and economic issues, 32, 690-698.
Rosenthal, P. (2012). Students finding out what it means to be underwater. The Chicago tribune. Retrieved from http:
//www.chicagotribune.com/business/columnists/ct-biz-0829-phil-20120829,0,861101.column Sallie Mae (2009). How undergraduate students use credit cards: Sallie Mae’s national study of usage
rates and trends 2009. Wilkes-Barre, PA: Author. Retrieved from
http://static.mgnetwork.com/rtd/pdfs/20090830_iris.pdf
Strayhorn, J. M. (2002). Self-control: Theory and research. Journal of the American academy of child
and adolescent psychiatry, 41, 7-16.
Tabachnick, B. G., & Fidell, L. S. (2007).Using multivariate statistics. Boston, MA: Allyn and Bacon. Veludo-de-Oliveira, T. M., Ikeda, A. A., & Santos, R. C. (2004). Compra compulsiva e a influência do
cartão de crédito. Revista de administração de empresas, 44(3), 89-94.
Watson, J. J. (2003). The relationship of materialism to spending tendencies, saving, and debt. Journal
of economic psychology, 24, 723-739.
Zhang, J., & Kemp, S. (2009). The relationships between student debt and motivation, happiness, and academic