1 Universidade Estadual de Ponta Grossa, Faculdade de Odontologia. Rua Cel. Bitencourt, 689, Centro, 84010-290, Ponta Grossa, PR, Brasil.
Corres-pondência para / Correspondence to: CB FADEL. E-mail: <cbfadel@gmail.com>.
2 Universidade Estadual Paulista Júlio de Mesquita Filho, Faculdade de Odontologia de Araçatuba, Programa de Pós-Graduação em Odontologia
Pre-ventiva e Social. Araçatuba, SP, Brasil.
Como citar este artigo / How to cite this article
Satisfaction with the academic experience among graduate students of
a brazilian public university
Satisfação com a vivência acadêmica entre concluintes de uma universidade pública brasileira
ABSTRACT
Objective
The objective was to analyze the satisfaction with the academic experience among graduates of the Biological Sciences and Health area of a Brazilian public university (n=30), Pharmacy (n=45), Physical Education (n=44), Nursing (n=30), Medicine (n=39) and Dentistry (n=35), resulting in a sample of 223 academics.
Methods
The data were collected through the validated instrument - 'Satisfaction Scale with Academic Experience', composed of 35 indicators and three dimensions: 'course satisfaction', 'development opportunity' and 'institution satisfaction', measured by the Five point likert scale. Descriptive statistics and Anova, Kruskal-Wallis and t-tests were applied.
Results
The 'course satisfaction' dimension was the best evaluated (p<0.001), while 'institution satisfaction' was worse. Most of the academics were satisfied with most of the indicators evaluated. Greater satisfaction was attributed to interpersonal relationships, especially those involving the teacher-student relationship and the training of professionals. Worst assessments related to structural aspects such as safety, comfort and equipment supply. Medical students presented the highest overall satisfaction score, differing significantly from the worst scores: Biological Sciences (p<0.001) and Pharmacy (p<0.001). There were also differences between courses in the other dimensions (p<0.05). Regarding the demographic factors, there was no significant divergence (p>0.05).
Conclusion
It is concluded that the investigated students are satisfied with the institution of higher education; However, strategies should still be established to qualify their educational process, especially institutional infrastructure.
Indexing terms: Consumer behavior. Schools. Students, Health Occupations.
RESUMO
Objetivo
Objetivou-se analisar a satisfação com a experiência acadêmica entre concluintes da área das Ciências Biológicas e da Saúde de uma universidade pública brasileira.
Métodos
Estudo transversal, quantitativo foi desenvolvido junto a acadêmicos dos cursos presenciais de Ciências Biológicas (n=30), Farmácia (n=45), Educação Física (n=44), Enfermagem (n=30), Medicina (n=39) e Odontologia (n=35), resultando em uma amostra de 223 acadêmicos. Os dados foram coletados através do instrumento validado - ‘Escala de Satisfação com a Experiência Acadêmica’, composto por 35 indicadores e três dimensões: 'satisfação com o curso', 'oportunidade de desenvolvimento' e 'satisfação com a instituição', com mensuração pela escala
likert de cinco pontos. Aplicou-se estatística descritiva e testes de Anova, Kruskal-Wallis e teste t.
Resultados
A dimensão 'satisfação com o curso' foi a melhor avaliada (p<0,001), enquanto a 'satisfação com a instituição' a pior. A maioria dos acadêmicos mostrou-se satisfeita com a grande parte dos indicadores avaliados. Atribuiu-se maior satisfação às relações interpessoais, em especial as envolvendo o relacionamento docente-discente e a capacitação de profissionais. Piores avaliações relacionaram-se a aspectos estruturais como Cristina Berger FADEL1
ORCID iD 0000-0002-7303-5429 Juliana Aparecida de SOUZA1
ORCID iD 0000-0003-3488-3924 Danielle BORDIN2
ORCID iD 0000-0001-7861-0384 Cléa Adas Saliba GARBIN2
ORCID iD 0000-0001-5069-8812 Artênio José Ísper GARBIN2
ORCID iD 0000-0002-7017-8942 Nemre Adas SALIBA2
ORCID iD 0000-0001-9608-1631
INTRODUCTION
Academic satisfaction refers to the subjective evaluation of all experience associated with education, it’s defined as a psychological state resulting from the confirmation or not of the expectations of the student with
the lived academic reality1,2. It is also an important instrument
for evaluation by educational institutions, by through it is possible to obtain consistent views on the quality of the products of the institutional work, that is, on the scope of
the objectives and the function institutions and courses3,4.
The university experience is related to variables of different origins, which directly or indirectly impact on the commitment of the academic to their work values, their
autonomy and search for professionalization5. Difficulties
found in this process, such as lack of personal resources, inappropriate academic repertoire, the lack of a defined professional project and the absence of support from the institution may imply difficult academic experiences4. The perception of academics about the confrontation of university demands and their degree of contentment
depends on personal and situational indicators6.
The variables cover the degree of contentment of the academic with all the training experience, as well as more specific aspects related to the quality of teaching, the curriculum, the relationship with teachers and colleagues, administration, facilities and pedagogical resources of the university, thus providing the student's perception of the academic and intellectual environment of his /
her institution4,7,8. Because it includes different areas of
the student's experience in relation to higher education, satisfaction is considered multidimensional.
Research has indicated that students' perception of their academic satisfaction interferes with their level of involvement with the institution, in the rates of permanence and avoidance of universities, a fact that reiterates satisfaction as an important psychosocial variable that mediates the
social and academic integration of the institution student9.
In a number of studies, academic content research has emerged as a supporting element in planning, evaluating
institutional effectiveness and its educational methods, allowing universities to restructure programs and services assigned to students and the consequent qualification of their educational process. In this way, the impact of academic experience on university students in general and, in particular, on higher education graduates is exposed as a
relevant research object5.
Considering these aspects and taking into account, the scarcity of literature related to the subject, this study aimed to analyze the satisfaction with the academic experience among graduates of the large area of Biological Sciences and Health of a public university in the South of Brazil.
METHODS
This is a cross-sectional survey-type study, using a quantitative methodology, developed with academic students of the following courses: Biological Sciences (n=76), Pharmacy (n=50), Physical Education (n=80), Nursing (n=47), Medicine (n=47) and Dentistry (n=60) from a public university in the State of Paraná, Brazil. Because it was a convenience sample, all of the final scholars were considered to compose the study (n=360).
The final sample consisted of 223 students, with a response rate of 62%, considered adequate to studies
with the same methodological approach5,10. The loss of
individuals was due to absence at the time of application of the questionnaire (n=75), by the refusal to participate in the study (n=15) or dropout (n=47).
The base year for the consultation was 2014. This study was approved by the Ethics Committee on Human Research, through an opinion no. 572.627/2014, respecting the dictates of resolution 466/12 of the National Health Council.
The subjects were previously informed about the objectives of the research, their character of voluntariness and of non-identification, as well as on the form of collection, analysis and destination of the data. Those who acquiesced in their participation made so by completing a
segurança, conforto e suprimento de equipamentos. Estudantes de medicina apresentaram o maior escore de satisfação geral, divergindo significativamente dos piores escores: Ciências Biológicas (p<0,001) e Farmácia (p<0,001). Foram verificadas também diferenças entre os cursos nas demais dimensões (p<0,05). Em relação aos fatores demográficos não houve divergência significativa (p>0,05).
Conclusão
Conclui-se que os acadêmicos investigados apresentam-se satisfeitos em relação à instituição de ensino superior; contudo, devem ainda ser estabelecidas estratégias que visem qualificar o seu processo educacional, em especial, a infraestrutura institucional.
Free and Informed Consent Term.
The data were collected by a trained researcher, in a collective manner in the classroom, at a time considered appropriate for each group of academics. A simple demographic questionnaire and an instrument with national scientific validation, nominated 'Scale of Satisfaction with
Academic Experience' – ESEA8 were used. It is composed of
35 indicators on different aspects of academic life, divided into three dimensions: 'course satisfaction', 'development opportunity' and 'institution satisfaction'. The student is asked to express his / her degree of satisfaction, noting one of the alternatives, in a likert five-point scale where the extremes are presented: (1) not satisfied and (5) to totally satisfied.
In order to obtain the general level of satisfaction of the students and in each dimension, the values of the standard values and standard deviation were taken from the results of each individual according to the likert scale and each of their training indicators, and these were presented in graph.
For the data presentation, respondents' answers were grouped into three categories, considering the value 1 as totally dissatisfied; 2, 3 and 4 partially satisfied; and 5 fully satisfied; and analyzed according to descriptive statistics through frequency, mean, standard deviation, median and amplitude distributions.
Analyzes were performed in order to evaluate significant differences in satisfaction among: general satisfaction and courses; overall satisfaction and demographic factors (gender and age). Previously the analyzes, the age variable was categorized into three groups: 20 to 25 years; 26 to 30 years and more than 30 years.
In the statistical analysis, a normality test (Kolmogorov-Smirnov) was performed in order to define the use of parametric or non-parametric test. The 'course satisfaction', 'institution satisfaction' and 'overall satisfaction' dimensions, in all courses analyzed and for all ages were normal, and the test applied was Anova with Tukey-Kramer post test. For the 'development opportunity' dimension, which did not present normal distribution, the non-parametric Kruskal-Wallis test was applied. The independent t-test was considered for gender analysis. A significance level of 5% was considered.
RESULTS
The sample consisted of individuals with a mean age of 21.5 years, comprising 84% of the sample between
the age groups of 20 to 25 years and 12% of 26 to 30 years and 4% with more than 30 years, being 135 of the female sex (60%) and 88 (40%) from male sex, from Biological Sciences (n=30), Pharmacy (n=45), Physical Education (n=44), Nursing (n=30), Medicine (n=39) and Dentistry (n=35).
Graph 01 shows the results of the students' perception, by dissociation in dimensions. The mean overall satisfaction was 3.34, differing significantly from 'course satisfaction' (p<0.001) and 'institution satisfaction' (p<0.05). The highest mean was found for the 'course satisfaction' dimension (3.63), and when compared with the 'institution satisfaction' and 'opportunity for development' dimensions, there was a significant difference (p<0.001). The 'institution satisfaction' and 'opportunity for development' dimensions had a mean of 3.18 and 3.19 respectively, and when compared, there was no significant difference between their scores (p> 0.05).
Figure 1. Mean, median, amplitude and standard deviation of academic satisfaction according to the dimensions. Paraná, 2014.
In general, it has been observed that most students are satisfied with most of the variables that guide their course, their institution, and their opportunity for development. However, when analyzing the standard deviation of the indicators, it was verified that the responses presented a considerable variation, demonstrating that perception of satisfaction is quite different among the individuals, having a considerable low number of satisfaction.
indicator referring to this group had a mean score lower than the average of general satisfaction. Still, it is worth
mentioning that in all analyzed variables the amplitude value was four.
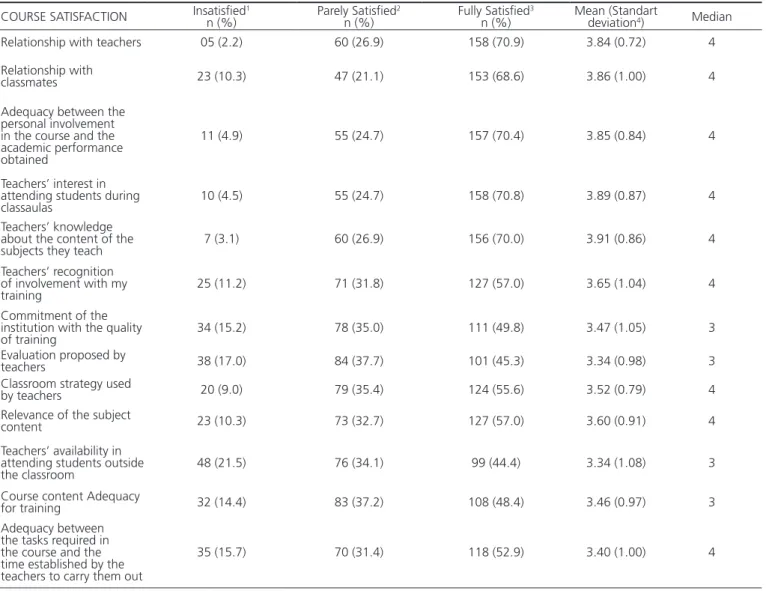
Table 1. Distribution of academic perceptions in absolute and relative frequencies, mean and standard deviation, according to course satisfaction (n=223). Paraná, 2014.
COURSE SATISFACTION Insatisfiedn (%) 1 Parely Satisfiedn (%) 2 Fully Satisfiedn (%) 3 Mean (Standart deviation4) Median
Relationship with teachers 05 (2.2) 60 (26.9) 158 (70.9) 3.84 (0.72) 4
Relationship with
classmates 23 (10.3) 47 (21.1) 153 (68.6) 3.86 (1.00) 4
Adequacy between the personal involvement in the course and the academic performance obtained
11 (4.9) 55 (24.7) 157 (70.4) 3.85 (0.84) 4
Teachers’ interest in attending students during
classaulas 10 (4.5) 55 (24.7) 158 (70.8) 3.89 (0.87) 4
Teachers’ knowledge about the content of the
subjects they teach 7 (3.1) 60 (26.9) 156 (70.0) 3.91 (0.86) 4
Teachers’ recognition of involvement with my
training 25 (11.2) 71 (31.8) 127 (57.0) 3.65 (1.04) 4
Commitment of the institution with the quality
of training 34 (15.2) 78 (35.0) 111 (49.8) 3.47 (1.05) 3
Evaluation proposed by
teachers 38 (17.0) 84 (37.7) 101 (45.3) 3.34 (0.98) 3
Classroom strategy used
by teachers 20 (9.0) 79 (35.4) 124 (55.6) 3.52 (0.79) 4
Relevance of the subject
content 23 (10.3) 73 (32.7) 127 (57.0) 3.60 (0.91) 4
Teachers’ availability in attending students outside
the classroom 48 (21.5) 76 (34.1) 99 (44.4) 3.34 (1.08) 3
Course content Adequacy
for training 32 (14.4) 83 (37.2) 108 (48.4) 3.46 (0.97) 3
Adequacy between the tasks required in the course and the time established by the teachers to carry them out
35 (15.7) 70 (31.4) 118 (52.9) 3.40 (1.00) 4
Note: 1Insatisfied, 2Parely Satisfied, 3Fullly Satisfied, 4Mean Standart deviation
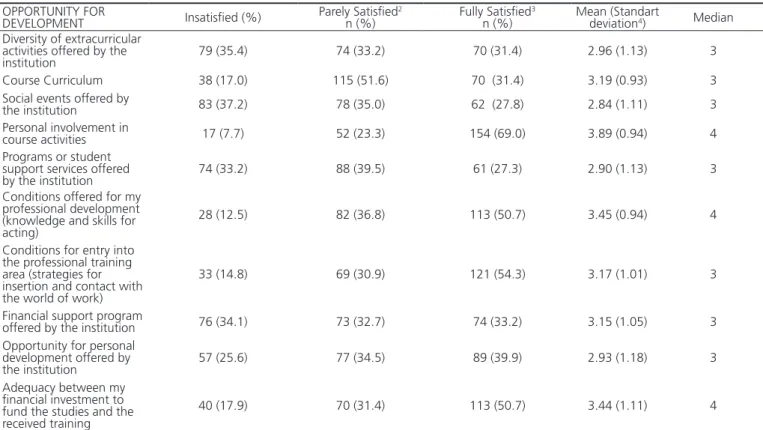
In the 'opportunity for development' dimension, the indicators responsible for raising the average were 'personal involvement in course activities'; 'conditions offered for my professional development'; 'adequacy between my financial investment to fund the studies and the training received'. While the main responsible for lowering the average were 'diversity of extracurricular activities offered by the institution'; 'social events offered by the institution'; 'student support programs or services offered by the institution'; 'financial support program offered by the institution' (Table 2).
Table 2. Distribution of academic perceptions in absolute and relative frequencies, mean and standard deviation, according to the opportunity of development (n = 223). Paraná, 2014.
OPPORTUNITY FOR
DEVELOPMENT Insatisfied (%) Parely Satisfied
2
n (%) Fully Satisfied
3
n (%) Mean (Standart deviation4) Median
Diversity of extracurricular activities offered by the
institution 79 (35.4) 74 (33.2) 70 (31.4) 2.96 (1.13) 3
Course Curriculum 38 (17.0) 115 (51.6) 70 (31.4) 3.19 (0.93) 3
Social events offered by
the institution 83 (37.2) 78 (35.0) 62 (27.8) 2.84 (1.11) 3
Personal involvement in
course activities 17 (7.7) 52 (23.3) 154 (69.0) 3.89 (0.94) 4
Programs or student support services offered
by the institution 74 (33.2) 88 (39.5) 61 (27.3) 2.90 (1.13) 3
Conditions offered for my professional development (knowledge and skills for acting)
28 (12.5) 82 (36.8) 113 (50.7) 3.45 (0.94) 4
Conditions for entry into the professional training area (strategies for insertion and contact with the world of work)
33 (14.8) 69 (30.9) 121 (54.3) 3.17 (1.01) 3
Financial support program
offered by the institution 76 (34.1) 73 (32.7) 74 (33.2) 3.15 (1.05) 3
Opportunity for personal development offered by
the institution 57 (25.6) 77 (34.5) 89 (39.9) 2.93 (1.18) 3
Adequacy between my financial investment to fund the studies and the received training
40 (17.9) 70 (31.4) 113 (50.7) 3.44 (1.11) 4
Note: 1Insatisfied, 2Parely Satisfied, 3Fullly Satisfied, 4Mean Standart deviation
Table 3. Distribution of academic perceptions in absolute and relative frequencies, mean and standard deviation, according to satisfaction with the institution (n = 223). Paraná, 2014.
INSTITUTION
SATISFACTION Insatisfied
1
n (%) Parely Satisfied
2
n (%) Fully Satisfied
3
n (%) Mean (Standart deviation4) Median
Audiovisual resources and equipment available in the
institution 51 (22.9) 60 (26.9) 112 (50.2) 3.39 (1.12) 4
Attendance and clarity of the information offered by
the secretary's employees 52 (23.3) 73 (32.7) 98 (44.0) 3.25 (1.09) 3
Equipment and software offered by the computer
lab 82 (36.8) 67 (30.0) 74 (33.2) 2.86 (1.25) 3
Attendance and clarity of information provided by
library staff 26 (11.7) 49 (22.0) 148 (66.3) 3.81 (1.08) 4
Available library collection 60 (26.9) 78 (35.0) 85 (38.1) 3.15 (1.08) 3
Security offered by the institution (concierge,
security) 125 (56.1) 60 (26.9) 38 (17.0) 2.36 (1.21) 2
Physical infrastructure of
classrooms 82 (36.8) 64 (28.7) 77 (34.5) 2.98 (1.16) 3
Institutional physical
infrastructure 58 (26.0) 88 (39.5) 77 (34.5) 3.10 (0.94) 3
Institution cleaning 47 (21.1) 60 (26.9) 116 (52.0) 3.43 (1.12) 4
Services offered by the
library 26 (11.7) 60 (26.9) 137 (61.4) 3.64 (0.97) 4
Comfort of the
institution's facilities 74 (33.2) 89 (39.9) 60 (26.9) 2.83 (1.00) 3
Location of the different sectors that make the
institution up 63 (28.3) 71 (31.8) 89 (39.9) 3.15 (1.09) 3
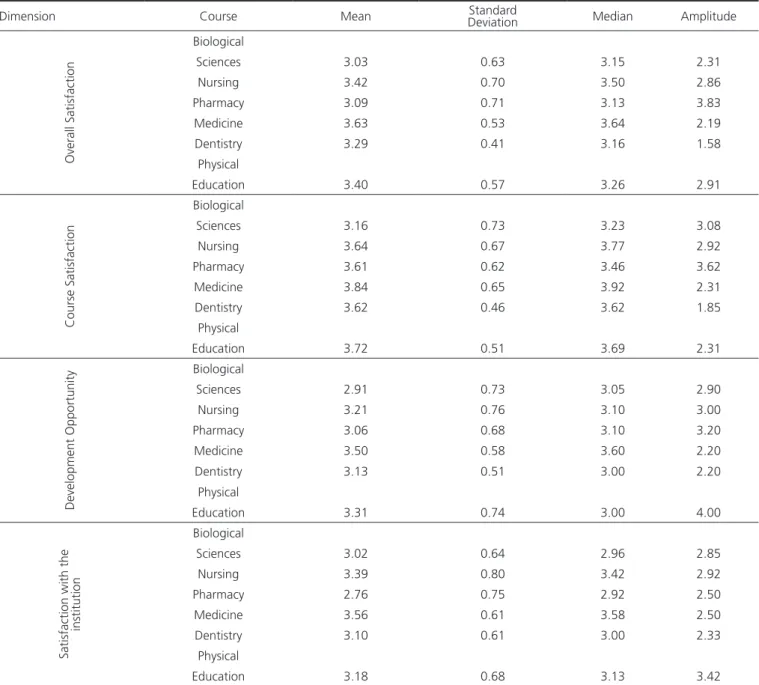
Table 4 shows the satisfaction of the different courses analyzed, according to dimensions. Medical students presented 'overall satisfaction' significantly higher than Biological Science students (p<0.001) and Pharmacy (p<0.001), and there was no significant difference among the other courses (p>0.05). In the dimension 'course satisfaction', Biological Sciences students presented satisfaction significantly worse than those of Medicine (p<0.01) and Physical Education (p<0.05), among the other courses there were no significant differences p>0.05). Regarding the 'opportunity for development'
dimension, the best satisfaction score was for Medicine with significant difference for Biological Sciences (p<0.01) and Pharmacy (p<0.05), the scores of the other courses did not diverge significantly (p>0.05). Finally, in the dimension 'institution satisfaction', the Pharmacy course was the one that presented the worst scores disagreeing with the scores of Medicine (p<0.001), Nursing (p<0.01) and Physical Education (p>0.05) respectively, among the other courses there was no significant difference (p>0.05).
Overall satisfaction with sex and age was analyzed and no significant differences were found (p>0.05).
Table 4. Mean, median, amplitude and standard deviation of academic satisfaction, according to size and course. Paraná, 2014.
Dimension Course Mean DeviationStandard Median Amplitude
Overall Satisfaction
Biological
Sciences 3.03 0.63 3.15 2.31
Nursing 3.42 0.70 3.50 2.86
Pharmacy 3.09 0.71 3.13 3.83
Medicine 3.63 0.53 3.64 2.19
Dentistry 3.29 0.41 3.16 1.58
Physical
Education 3.40 0.57 3.26 2.91
Course Satisfaction
Biological
Sciences 3.16 0.73 3.23 3.08
Nursing 3.64 0.67 3.77 2.92
Pharmacy 3.61 0.62 3.46 3.62
Medicine 3.84 0.65 3.92 2.31
Dentistry 3.62 0.46 3.62 1.85
Physical
Education 3.72 0.51 3.69 2.31
Development Opportunity
Biological
Sciences 2.91 0.73 3.05 2.90
Nursing 3.21 0.76 3.10 3.00
Pharmacy 3.06 0.68 3.10 3.20
Medicine 3.50 0.58 3.60 2.20
Dentistry 3.13 0.51 3.00 2.20
Physical
Education 3.31 0.74 3.00 4.00
Satisfaction with the
institution
Biological
Sciences 3.02 0.64 2.96 2.85
Nursing 3.39 0.80 3.42 2.92
Pharmacy 2.76 0.75 2.92 2.50
Medicine 3.56 0.61 3.58 2.50
Dentistry 3.10 0.61 3.00 2.33
Physical
DISCUSSION
In institutional terms, all the courses are periodically inserted in the self-evaluation institutional process in response to a request from the Special Commission for Higher Education Evaluation from Paraná State System of Education. Conducted by an Own Evaluation Commission - CPA, with the participation of faculty representatives from different areas of knowledge, student representatives, and members of the external community, this internal evaluation process aims to guide university management in terms of actions for its improvement. However, the strict evaluation directed to the entire academic body of the large area of Biological Sciences and Health hadn’t been performed yet.
The data obtained in the present study show that the dimension best evaluated by the students was ' course satisfaction', and the indicators related to the teaching staff are the main responsible for raising this index. Data corroborate the concept reached by the institution's last CPA report and with studies which state that, despite the diversity of variables related to student satisfaction, none
has more relevance than the teaching staff11-15.
The mastery of the content taught, as well as the availability to attend and to solve the doubts of the students during the classes are important factors that guide
the good performance of the teachers16 and influence
positively in the academic satisfaction, as observed in the present study.
In addition, other aspects can generate high satisfaction and contribute to creativity, learning and a
friendly atmosphere in the classroom17. Among them,
humor, teacher-student relationship and recognition of
involvement in the students17,18, which encompasses
knowledge and interest in the characteristics and difficulties presented by academics, empathy, ability to arouse students' interest in the course and labor market, as well as diffusion of academic and professional principles
and experiences19.
Regarding student and teacher interaction, academic efforts to approach academics are mandatory in the area of adaptation to higher education, learning, reduction of university dropout, and contentment with
course3,17,20-22. Academic-teaching relationship has greater
relevance in the initial period of university courses, when the students seek integration and social recognition, resulting in greater dissatisfaction with the environment, academic routine, colleagues and teachers; when
compared to the final stage, with greater concern about
the future professional performance19. This fact may justify
the high rates of total satisfaction found in the present study, because it is a study with graduates.
In addition, other aspects can generate high satisfaction and contribute to the Other indicator highlighted in the 'course satisfaction' dimension refers to the adequacy between the personal involvement in the course and the academic performance achieved. Academic achievement is directly related to the personal situations
routinely experienced by students15. Thus, even in the face
of non-motivating personal and educational contexts, students can manage internal conflicts through principles-embedding techniques that aim to behavioral adjustments reflecting a satisfactory academic performance. Adequate management of personal conflicts may lead to deep involvement, commitment and persistence, factors associated with higher levels of academic achievement
and learning quality23. In addition, students' perception of
their academic satisfaction affects the degree of personal involvement with the course and guides the decision of
university dropout8.
Still in relation to this dimension, interpersonal relationships, both with colleagues, teachers and employees are emphasized regarding adaptation and
empathy with higher education19-21. In general, studies
usually relate adequate indexes of integration and satisfaction among colleagues also with a low level of
conflict19,24.
When the dimensions 'course satisfaction' and 'opportunity for development' are compared a significantly lower value was verified, linked to the average index of the second dimension mentioned. This finding suggests that the inherent aspects of the conditions that support the growth, development and improvement of the formative capacities and the professional abilities, such as the pedagogical project and the extracurricular activities promoted by the study institution, appear to be less impacting than the aspects which involve the interpersonal relationship and the qualification of professionals involved
in the training of students5,10.
In the 'opportunity for development' dimension, the high satisfaction score of the indicators titled personal involvement in the course activities and the conditions offered for professional development are highlighted.
Voss et al.25 point out the high degree of importance
The great majority of the courses analyzed by this research is in the phase of discussion and re-orientation of their pedagogical proposals, with a view to the curricular integration, and of favoring the approach of their students with the reality of the health services. This institutional movement has encouraged the participation of students in internal decision-making processes, which leads to their personal involvement and the construction of new social relations and may be motivating the results achieved.
Indicators of this same dimension presented high levels of dissatisfaction related to different ways to the complementary opportunities offered by the institution. This result is in line with the last internal institutional evaluation carried out for health courses and exposes weaknesses in the social support organs and fostering academic propulsion. On the other hand, studies show, for the most part, a non-expressive relation between academic dissatisfaction and complementary institutional
activities4,13; despite the fact that they constitute an
important instrument for reducing stressful episodes due to university graduation and favor the recognition of academics as social individuals, inducing the creation of bonds of affection and making the academic journey less
stressful5,12.
Another dimension evaluated in the study was the 'institution satisfaction', which showed significantly lower values when compared to the general satisfaction scores and the 'course satisfaction' dimension. Indicators related to safety technology and study environments were the ones that obtained the most negative repercussions,
which corroborate with results found in other studies13,26.
In Brazil, in general, the complex of public education institutions, despite the recognition that constitute an important social, scientific and cultural heritage, have been constantly criticized in the structural and economic aspects, due to the slowness of transformations that respond to the needs of adaptation to a co-participative management society.
The findings of the study in question corroborated
Souza and Reinert's13 research, which demonstrated
that the thematic infrastructure and support services presented low expressiveness, resulting in student dissatisfaction. It is therefore suggested that there is a need to promote strategies aimed at improving aspects involving the whole ' institution satisfaction' dimension, in particular the security, comfort and supply of electronic equipment, aspects that received the worst evaluation by the researchers investigated, with a view to improving the
quality of teaching and truly satisfy the academics’ desires. Despite a lack of literature with similar results, some studies have also found a considerable degree of dissatisfaction with the above-mentioned questions, arguing that changes are the responsibility of university management and not a responsibility that should be attributed to the coordination of the courses or to the
leader of the involved sectors26,28.
As to satisfaction in this dimension, the performance of institutional human resources was the main responsible for raising its index. In fact, the relationship between the performance of workers and the success of academics in different moments of formation, in the public and private spheres, is well established in
literature26,27.
In relation to the results of the comparison with the satisfaction among the students of the different courses, the expanded satisfaction of the graduates of Medicine may be related to specific conditions of this course in the institution under study: in the scope of Biological Sciences and Health, the implementation of the Medicine course is the most recent, in 2009, with strong investments to carry out works to expand the physical space, hiring new teachers and employees.
Considering satisfaction as a multidimensional, its analysis was performed in different dimensions according to sex and age. However, the results showed no difference. Explanatory for the non-difference between the ages is the fact that the majority of respondents are in the same age range of young adults, which makes it impossible to schedule them with intervals of age, as they are often carried out in studies that deal with satisfaction in more heterogeneous scenarios.
As a limitation of the study in question we can refer to the geographic scope of the research which was restricted to only an educational institution in a Brazilian state. It is possible that if the study is expanded to other educational institutions in other Brazilian locations, there is a greater subsidy that contributes to the improvement of the services offered by the aforementioned students.
CONCLUSION
Aware that the academic satisfaction research is fundamental for the planning and improvement of institutional proposals assigned to students, it is hoped that the recognition of the satisfaction and dissatisfaction perceptions exposed by undergraduates in Biological Sciences and Health with the academic experience can contribute to the establishment of strategies which aim to qualify their educational process.
Collaborators
CB FADEL outlined the study, such as treated information collected and wrote the article. JA SOUZA carried out the collection and tab the data, and wrote the article. D BORDIN tried the information collected and wrote the article. CAS GARBIN, AJI GARBIN and NA SALIBA wrote and review critical the article.
REFERENCES
1. Elliott KM, Shin D. Student satisfaction: An alternative approach to assessing this important concept. J Higher Educ. 2002;24(2):197-209.
2. Jaradeen N, Jaradeen N, Jaradat R, Safi AA, Al Tarawneh F. Students satisfaction with nursing program. Bahrain Med Bullet. 2012;34(1):1-6.
3. Mota NF, Agra AL, Viana JML, Takashi MH, Oguisso T, Freitas GF. Perfil de estudantes da Escola de Enfermagem da Universidade de São Paulo (1980-81). Acta Paul Enferm. 2010;23(1):48-52.
4. Hirsch CD, Barlem ELD, Barlem JGT, Silveira RS, Mendes DP. Fatores preditores e associados à satisfação dos estudantes de enfermagem. Acta Paul Enferm. 2015;28(6):566-72.
5. Santos AAA, Polydoro SAJ, Scortegagna SA. Integração ao ensino superior e satisfação acadêmica em universitários. Psicol.: Ciên Prof. 2013;33(4):780-793.
6. Cunha SM, Carrilho, DM. O processo de adaptação ao ensino superior e o rendimento acadêmico, Psicol Esc Educ. 2005;9(2):215-224.
7. Astin AW. What matters in College? Four Critical Years revisited. San Francisco: Jossey-Bass Publishers; 1993.
8. Schleich ALR, Polydoro SAJ, Santos AAA. Escala de satisfação com a experiência acadêmica de estudantes do ensino superior. Aval Psicol. 2006;5(1):11-20.
9. Karemera D, Reuben LJ, Sillah MR. The effects of academic environment and background characteristics on student satisfaction and performance: the case of south carolina state University’s School of Business. College Stud J. 2003;37(2):298-311.
10. Santos AAA, Suehiro ACB. Instrumentos de avaliação da integração e da satisfação acadêmica: estudo de validade. Rev Galego-Portuguesa de Psic Educ. 2007;14(1):107-119.
11. Palmer RS, Holt MD. Examining student satisfaction with wholly online learning. J Comp Assist Learning. 2009;25:101-113. doi: 10.1111/j.1365-2729.2008.00294.x
12. Lo CC. How student satisfaction factors affect perceived learning. J Comp Assist Learning. 2010;10(1):47-54.
13. Souza AS, Reinert JN. Avaliação de um curso de ensino
superior através da satisfação/insatisfação discente. Avaliação, 2010;15(1):159-176.
14. González AJ, Carrillo BT, Zepeda FJR. Evaluación de la satisfacción de los estudiantes de la Universidad Autónoma de Nayarit. Rev Fuente. 2011;3(6):46-56.
15. Manzoor H. Measuring student satisfaction in public and private universities in Pakistan. Glob Health Action. 2013;13(3):1.
16. El Ansari W, Oskrochi R. What matters most? Predictors of student satisfaction in public health educational courses. Public Health. 2006;120:462-473..
17. Quadros AL, Lopes CM, Silva FAB, Correa JMM, Pio JM, Torres NO, et al. A percepção de professores e estudantes sobre a sala de aula de ensino superior: expectativas e construção de relações no curso de química da UFMG. Ciência & Educ. 2010;16(1):103-114.
18. Roncaglio SM. A relação professor-aluno na educação superior: a influência da gestão educacional. Psicol Cienc Prof. 2004;24(2):100-111.
19. Bardagi MP, Hutz CS. Rotina acadêmica e relação com colegas e professores: impacto na evasão universitária. PSICO. 2012;43(2):174-184.
20. Gault J, Redington J, Schlager, T. Undergraduate business internships and career success: are they related? J Mark Educ. 2000;22(1):45-53.
21. Beyers W, Goossens L. Concurrent and predictive validity of The Student Adaptation to College Questionnaire in a sample of European freshmen students. Educ Psychol Meas. 2002;62(3):527-538.
22. Santos BS, Morosini MC, Cofer J. Fatores de persistência de estudantes de uma universidade particular brasileira. Clabes. 2014;4:1-7.
23. Deci EL, Ryan R. M. The “what” and “why” of goal pursuits: Human needs and the self determination of behavior. Psychological Inq. 2000;11:227-268.
24. Igue ÉA, Bariani ICD, Milanesi PVB. Vivência acadêmica e expectativas de universitários ingressantes e concluintes. Psico-USF. 2008;13(2):155-164.
26. Adubeiro NCFA. Avaliação da satisfação dos estudantes do curso de Radiologia da Escola Superior de Tecnologia da Saúde do Porto [dissertação]. Coimbra: Faculdade de Economia da Universidade de Coimbra; 2010.
27. Xavier EM, Duarte EN. Percepção da qualidade dos serviços oferecidos pela biblioteca setorial de areia-PB, campus II da UFPB: visão do cliente interno. Biblionline. 2008;4(1):2.
28. Wiers J, Stensaker B, Grogaard J. Student satisfaction: towards
an empirical deconstruction on the concept. Quality Higher Educ. 2002;8(2):183-195.