Received: 24 may. 2018 / Approved: 01 jan. 2019 Responsible editors: Julio Araujo Carneiro da Cunha
& André Torres Urdan
Evaluation: Double Blind Review e-ISSN: 2177-5184
DOI: https://doi.org/10.5585/remark.v18i4.16382
ROPOSITION AND TEST OF AN EXPLANATORY MODEL OF INNOVATION PERCEPTION AND IT´S CONSEQUENCES
Murilo Junio Rezende Pereira1
Luiz Rodrigo Cunha Moura2
Gustavo Quiroga Souki3
Nina Rosa da Silveira Cunha4 Abstract
Objective: To propose and test a theoretical model to measure the innovation perception and the
intention to renew the consumer’s annuity of its members.
Method: A survey was carried out with fans of soccer clubs from all over Brazil and a sample of 883
elements was obtained. Data were analyzed using multivariate statistical techniques and structural equations modeling, attempting to validate the proposed model at the level of the scales used and the nomological chain.
Originality/Relevance: Model development for an innovation perception by consumer’s measurement,
as well as the verification and test. This study provide club managers with information on the variables that impact the perception and behavior of the fans will lead to the clubs better strategic planning in the quest to make the club a profitable organization.
Results: Tested model has shown that the benefits provided by the Fan Loyalty Program generate a
innovation perception triggering the perception of this products values. Perceived innovation and value positively impact the member's satisfaction, which leads them to renew the program annuity.
Theoretical/Methodological Contributions: the innovations incorporated in the sporting sector are
new actions that have the need for a models establishment that can support the manager’s decision process. Researchers should establish a continuing effort to comprehend how the perception of innovative products impacts consumers, which is important to assess the innovative products diffusion, not only by their past behavior, but also by future behavior intention, one of the present study objects. Keywords: Innovation. Innovations Adoption Model. Perceived Innovation. Fan Loyalty Program. Soccer.
How to cite the article:
Pereira, M., Moura, L., Souki, G., & Cunha, N. (2019). Proposition and Test of an Explanatory Model of Innovation Perception and It´s Consequences. Brazilian Journal of Marketing, 18(4), 25-50.
https://doi.org/10.5585/remark.v18i4.16382
1 Universidade de Coimbra - Portugal. Mestre em Administração pelo Centro Universitário UNA. Doutorando em Gestão
pela Universidade de Coimbra, Portugal. [email protected]
2 Fundação Cultural Pedro Leopoldo – FPL, Minas Gerais, Brasil. Doutor em Administração pela Universidade Federal de
Minas Gerais – UFMG. Professor Colaborador do Mestrado em Administração da Fundação Cultural Pedro Leopoldo, Brasil. [email protected]
3 Universidade do Algarve – Portugal. Doutor em Administração pela Universidade Federal de Lavras – UFLA.
Pós-Doutorando Gestão (especialidade de Marketing) pela Faculdade de Economia da Universidade do Algarve, Portugal. [email protected]
4 Universidade Federal de Viçosa – UFV, Minas Gerais, Brasil. Doutora em Economia Rural pela Universidade Federal de
Viçosa – UFV. Professora Titular da Universidade Federal de Viçosa – UFV, Brasil. [email protected]
Pereira, M. J. R., Moura, L. R. C., Souki, G. Q., & Cunha, N. R. da S.
1 Introduction
The great expansion of the soccer’s popularity in Brazilian daily life during the 20th century generated a sports market in Brazil that moves a representative resources number, especially for the country’s first division soccer teams. This part of the economy goes through player negotiations nationwide and worldwide, sponsorship, advertising quotas and training centers, tickets and products sale for consumers. The top 20 Brazilian clubs generated revenue equivalent to an amount of 3.1 billion Reais (Reis et al., 2014).
In the last years, Brazilian clubs have been implementing fan loyalty programs and renovation in order to generate more revenue for their associations. It is important to emphasize the need for clubs to create strategies so fans can renew their fan club membership annually, which creates a possibility of revenue. These actions may occur through the development of in-service innovations and products tied to supportive loyalty programs. In studies conducted in European countries, it was identified that there may be social and local aspects that impact the behavior of adherence to innovative products and services (Truong, 2013).
Facing the high financial dependence scenario of Brazilian clubs on the transfer of television resources, their management tends to seek new ways to generate more revenues. Managers must assess which variables or attributes of their services and products have a positive or negative impact on the process of joining and maintaining the fan members quotas (Bdo, 2016; Yoshida et al., 2013).
Fan member programs generate monthly revenue for clubs as well as other money values on game days through the expenditure of supporters in bars, in parking lots and with entertainment in the stadiums. Today, more than 1 million people are fan loyalty programs customers (Futebol Melhor, 2016), which earn priority tickets, get differentiated drink prices on stadiums, among other services and products that are consumed on game days. Soccer clubs have to develop products and services that raise revenue on Match Day, and the fan member program enables the number of fans present at the stadiums to be expanded (Silva & Campos Filho, 2009).
In the sports segment, it has been recognized that the application of new stadium processes, the automated ticket gates development and food processes and the implementation of services linked to loyalty soccer programs are innovative actions (Yoshida et al., 2013). Business innovation is an important tool that enables organizations to generate value for their products (Davila et al., 2012).
Proposition and test of an explanatory model of innovation perception and it´s consequences
Studies are being developed with the purpose to measure the perception of the products innovation and services available in the market seeking identify the established characteristics of innovative products and services that influence their diffusion to the market, as well as to establish other variables that tend to impact the adoption of them (Im et al., 2003; Moura et al., 2008; Chakrabarti & Baisya, 2009; Wang & Cho, 2012).
This present study main purpose is to develop and test an explanatory model of the products innovation perception by the fan loyalty programs customers. It seeks to identify the consequences and existing relations of the innovation perceived by the clients in perceived value terms, satisfaction and intention in renewing their supporter member annuity.
This work is justified because the innovations incorporated in the sporting world are new actions that have the need for a models establishment that can influence the manager’s decision process (Yoshida et al., 2013). Besides that, researchers should establish a continuing effort to comprehend how the perception of innovative products impacts consumers behavior (Krof & Reilly, 2011), which is important to assess the innovative products diffusion, not only by their past behavior, but also by future behavior intention, one of the present study objects (Van Rijnsoever & Castaldi, 2011). Xie and Notish (2007) and Jung and Kim (2005) also pointed out that measuring innovation perception variables of products in real segments outside the student environment would be necessary to validate the studies. Also Zolfagharian and Paswan (2009) identified that consumers understand the innovation at different levels in the service segments, which suggests that new research is possible. In addition, social behaviors that tend to influence the behavior of the same product or service in different regions (Truong, 2013), which would justify the work being applied in the Brazilian territory.
Also in academic terms, this study’s main theoretical contribution is the model development for a product perception or service innovation by consumers measurement, as well as the verification and test, not only of the model in its totality, but also its separated parts, through concepts and scales that were previously used and tested separately and which served as the basis for their preparation.
This study is justified too because providing club managers with information on the variables that impact the perception and behavior of the fans will lead to the clubs better strategic planning in the quest to make the club a more profitable organization (Truong, 2013). It is also highlighted the creation of the Program of Modernization of the Management and Fiscal Responsibility of Brazilian Soccer (PROFUT) by Law n 13.155/2015 which has the goal at the professional soccer sports entities to promote its transparent and democratic management and the significance of its financial equilibrium. It is relevant the organization's ability to
Pereira, M. J. R., Moura, L. R. C., Souki, G. Q., & Cunha, N. R. da S.
continually introduce new products or changes to improve existing ones (Agger & Segrestin, 2007). Considering the number of soccer team fan and the number of people who are affiliated with the fan loyalty programs, there is a less than 1% return rate, showing that there is enormous potential for fans who can join these programs. Therefore, clubs need to invest in actions to properly take advantage of the opportunity generated by fan loyalty programs (Better Soccer, 2016).
2 Theoretical background
This section presents the various constructs that form the hypothetical model to be tested in the research.
2.1 Self-Congruence
Self-congruence is used to explain the effect of self-image on consumer’s behavior. Consumers acquire goods to express their identity, and in consequence, generate an assessment between the symbolic attributes and consumer’s concept. This process is known as self-congruence, in which a perception value of self-image (positive or negative) interacts with a product image´s value perception (positive or negative). Self-esteem leads to a products search that raise the self-image value and consumer self-consistency (Sirgy, 1985). This theory proposes that consumer behavior be determined in part by the congruence resulting from a psychological comparison involving the image of the user product and its self-concept (for example, real self-image and ideal self-image) (Cowart et al., 2008).
The psychological comparison between an innovativeness consumer and a common consumer can be categorized as greater or lesser by self-congruence. Self-congruence will be greater when consumers realize the product’s image corresponds to their own self-image. Studies have identified that self-congruence affects consumer behavior through impacts on consumer self-concept and the need for self-consistency and self-esteem (Fitzmaurice, 2005), playing an important role in the tourism segment (Hosany & Martin, 2012), in the video games segment (Davis et al., 2013), in the automotive segment (Kerssmann et al., 2006) and in the sports event sponsorship segment (Mazodier & Merunka, 2012) and intention to purchase in e-commerce segments (Badrinarayanan et al., 2014).
Self-congruence is a robust precedent of consumer intention to use (Cowart et al., 2008; Rodriguez et al., 2012; Hosany & Martin, 2012; Kerssmann et al., 2006; Mazodier & Merunka, 2012; Badrinarayanan et al., 2014). Here, it is presented a models set for the adoption of innovative investment products and perceived innovation (Hoffman & Broekhuizen, 2010), as
Proposition and test of an explanatory model of innovation perception and it´s consequences
Hypothesis 1 - Self-congruence has a positive effect on satisfaction with the supportive loyalty product.
Hypothesis 2 - Self-congruence has a positive effect on perceived innovation in relation to the supportive loyalty product.
2.2 Propensity of the consumer to innovate / innovative consumers
Rogers's Innovations Diffusion Theory is one of the most widely used models to study and understand the consumer process of adoption and acceptance for innovative products (Hached & Arachchilage, 2016). This theory describes that diffusion is like a process by which an innovation is communicated through certain channels, to the members of a social system (Hameed et al., 2012). His theory is based on five elementary factors that consumers take into account in the adopting an innovation process (Damanpour & Schneider, 2009; Moura et al., 2012; Gutman et al., 2014).
Rogers Model first dimension is relative advantage, which can be understood how innovation is perceived to be better than the existing situation, and can be measured in economic terms, in addition to social prestige, convenience, satisfaction and how the results of an innovation are visible to other individuals. It is very important that the product offers relative advantage in comparison with the other alternatives, and consumers must believe that its use will provide benefits that other products cannot offer. This factor is the most important when assessing a product’s diffusion and service, since it identifies the degree to which consumers perceive the benefits superior to the product that is in use (Rogers, 1983; Solomon, 2010; Moore & Benbasat, 1991; Blackwell et al., 2005). The relative advantage is expected to have a positive effect on innovations adoption rate (Hameed & Counsell, 2014).
The compatibility refers to the consistency relationship that innovation presents with the values, an individual needs and past experiences. It is not only related to difficulties perceived or present in the use, but can also be related to the inappropriate use of an innovation, a fact that can make an innovation be perceived as less beneficial than it really is. Therefore, the greater the compatibility, the greater the probability of fast acceptance (Rogers, 1983; Moore & Benbasat, 1991; Blackwell et al., 2005; Jing, 2016). Positively capability influences the innovations adoption of (Wang & Wang, 2016) and it is positively related to this adoption process (Hameed & Counsell, 2014).
In the complexity case, it demonstrates the difficulty degree perceived at the understanding time and using of innovating resources. The more complex the new product is, the more difficult is to achieve its acceptance. In this aspect, individual differences are evident
Pereira, M. J. R., Moura, L. R. C., Souki, G. Q., & Cunha, N. R. da S.
in the complexity perception, and innovations perceived as being clear to a particular user may be perceived as complex by others. The complexity degree is an important factor in the diffusion process, which demands the product innovation development with a simplicity high level, making the use facilitated (Rogers, 1983; Moore & Benbasat, 1991; Blackwell et al., 2005; Jing, 2016). It is expected that complexity has a negative effect on the innovation adoption rate (Hameed & Counsell, 2014).
The possibility of testing/experimentation refers to the degree to which an innovation can be experienced prior to adoption. More easily demonstrable innovations tend to have a higher adoption rate than non-demonstrable innovations. It is important when the consumer perceives a risk in the purchase or adoption of the new product. Companies must promote actions that allow consumers to use before the purchase, which reduces their risk perception to the product positively impacting the diffusion (Rogers, 1983; Moore & Benbasat, 1991; Blackwell et al., 2005). It is expected that the possibility of testing/experimentation has a positive effect on the innovations adoption rate (Hameed & Counsell, 2014).
The observable advantage dimension refers to the degree in which an innovation is visible to consumers. If consumer are able to observe others benefiting when using a new product, it shows that it is successful and has a high diffusion index. Exposing a working product can increase its diffusion rate (Rogers, 1983; Moore & Benbasat, 1991; Blackwell et al., 2005). It is expected that the observable advantage will have a positive effect on adoption of innovations rate (Hameed & Counsell, 2014). Therefore, the following hypotheses are elaborated:
Hypothesis 4 - Relative advantage has a positive effect on the fan loyalty product perceived innovation.
Hypothesis 5 - Compatibility has a positive effect on the fan loyalty product perceived innovation. Hypothesis 6 - Low complexity has a negative effect on the fan loyalty product perceived innovation.
Hypothesis 7 - The testing possibility has a positive effect on the fan loyalty product perceived innovation.
Hypothesis 8 - The observable advantage has a positive effect on fan loyalty product perceived innovation.
2.4 Innovation perception
Perceived innovation consist in how much consumers believe the product has important innovation attributes, characterizing the product or service as unique (Kleinschmidt & Cooper, 1991; Danneels & Kleinschmidt, 2001). This definition differs from the "consumer's propensity to innovate" concept, which is a consumer characteristic and not of the product and the service
Proposition and test of an explanatory model of innovation perception and it´s consequences
(Roehrich, 2004). The impact in consumption of innovation behavior depends on how customers perceive the new product (Lee & O'connor, 2003).
Perceived innovation generates a positive impact on customer's perception of value (Truong, 2013; Wu & Chen, 2014), also in consumer’s intention to use (Yoshida et al., 2013) as well as on their perception of satisfaction (Yoshida & Nakazawa, 2016).
Hypothesis 9 - Perceived innovation has a positive effect on satisfaction.
Hypothesis 10 - Perceived innovation has a positive effect on perceived value in relation to the fan loyalty product.
Hypothesis 11 - Perceived innovation has a positive effect on the intention to use (renew) the fan loyalty product.
2.5 Consumer’s involvement
Consumer’s involvement is one of the most important factors that shape the type of decision-making behavior that will be adopted by consumers. Involvement is the degree of perceived personal importance and / or interest evoked by stimulation within a personal specific situation (Zaichowsky, 1985).
Consumer’s involvement has a positive impact on the diffusion process of innovation and, consequently, on how innovation products are adopted (Ram and Jung, 1989). The involvement, researched together with the innovation perception, was shown as a precedent of the product adoption process in the fashion sector (Rahman, 2014) and in research focusing on the initial adoptive consumers, a theory that will be dealt with in the next chapter (Reinhardt & Gurtner, 2015).
H12 - Involvement has a positive effect on the intention to use (renew) the fan loyalty product.
2.6 Perceived value
Value is the basis for the company's relationship with the customer (Zeithaml et al., 2001). The value can be defined as the perception of the difference between benefits and costs of maintaining a relationship with a service provider (Sirdeshmukh et al., 2002).
Two dimensions have been defined in the value concept: the first one is associated to the benefits, which include intrinsic and extrinsic factors, perceived quality and other high level abstraction components; and the second is associated with what consumers need to give in order to be entitled to receive the benefits provided by the products. This dimension is associated with the sacrifice in marketing that includes the monetary price and the non-monetary price
Pereira, M. J. R., Moura, L. R. C., Souki, G. Q., & Cunha, N. R. da S.
(Zeithaml, 1988). In addition, there are a strong relationship between consumer innovations that originate in the diffusion factors established by Rogers (1983), with perceived novelty, perceived value, and perceived risk constructs that lead to consumer attitudes toward innovation (Truong, 2013).
Hypothesis 13 - Perceived value has a positive effect on the fan loyalty product satisfaction.
2.7 Satisfaction
Satisfaction is defined as the overall assessment of the product’s performance offered by the customers' perspective (Fornell et al., 1996), occurring when the consumption experience is at least what was expected (Hunt, 1977). Satisfaction can also be defined as the consumer's response to the assessment as to how much the characteristics of a good or service are able to provide it at a pleasurable consumption level, meeting their needs (Oliver, 1997) and associated with profitability and repurchase probability (Chen et al., 2012).
Satisfaction is shown as a strong precedent for the intention to use and to renew the consumption of products and services (Chen et al., 2012; Yoshida et al., 2013; Fang et al., 2014; Ahmad et al., 2015).
Hypothesis 14 - Satisfaction has a positive effect on the intention to use (renew) the supportive loyalty product.
2.8 Intention to reuse (renew)
Intentions represent motivational behavior components, which is the conscious effort degree that a person will exert in order to perform behavior (Ajzen, 1991). The intention to reuse (renewing its participation in the loyalty program) is an attitude exercised by the consumer in order to renew a product or service (Nirmala & Dewi, 2011; Cowart et al., 2008).
Self-congruence is a precedent of consumer’s intention to use (Rodriguz et al., 2012; Hosany & Martin, 2012; Kerssmann et al., 2006; Mazodier & Merunka, 2012; Badrinarayanan et al., 2014). It also presents itself as satisfaction precedent (Tsai et al., 2015). Satisfaction precedes the intention to use (Cowart, Fox & Wilson, 2008; Yoshida et al., 2013; Fang et al., 2014; Ahmad et al., 2015). As well as the involvement (Rahman, 2014; Reinhardt & Gurtner, 2015). In addition, the five factors of Rogers (1983) are precedents of the perceived innovation that impacts the adoption and intention to use the products (Jung et al., 2012; Hasshin et al., 2015).
Proposition and test of an explanatory model of innovation perception and it´s consequences
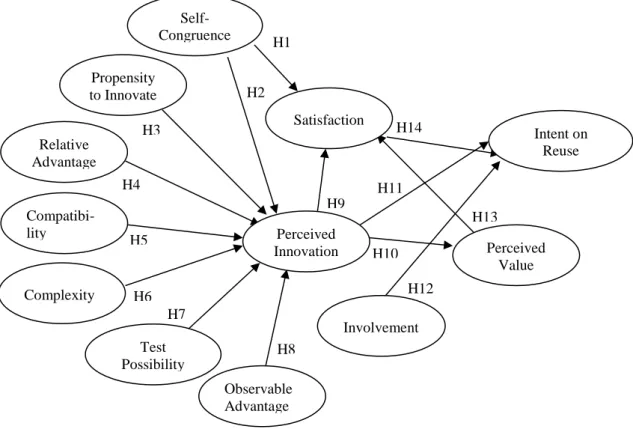
3 Of the proposed conceptual model and its hypoteses
Considering the description of the various constructs related to the innovation perceived by the consumer theme, a hypothetical model (see Fig. 1) was developed.
Figure 1 - Graphical representation of the model used in the research
Source: elaborated by authors
4 Methodology
Considering the study purpose, a quantitative approach was chosen. Therefore, in the questionnaire development, the scales already validated and punctuated in the theoretical framework were considered, and these scales and constructs were structured in the proposed hypothetical model. A scale summary that compose the questionnaire, as well as its origin, can be seen in Table 1. H1 H2 H3 H4 H5 H6 H7 H9 H10 H11 H12 H13 H14 H8 Self- Congruence Perceived Innovation Propensity to Innovate Observable Advantage Relative Advantage Compatibi-lity Complexity Test Possibility Satisfaction Intent on Reuse Perceived Value Involvement
Pereira, M. J. R., Moura, L. R. C., Souki, G. Q., & Cunha, N. R. da S.
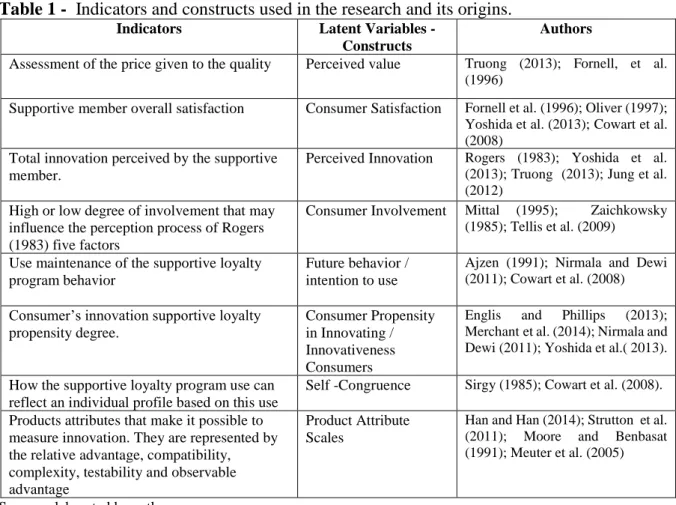
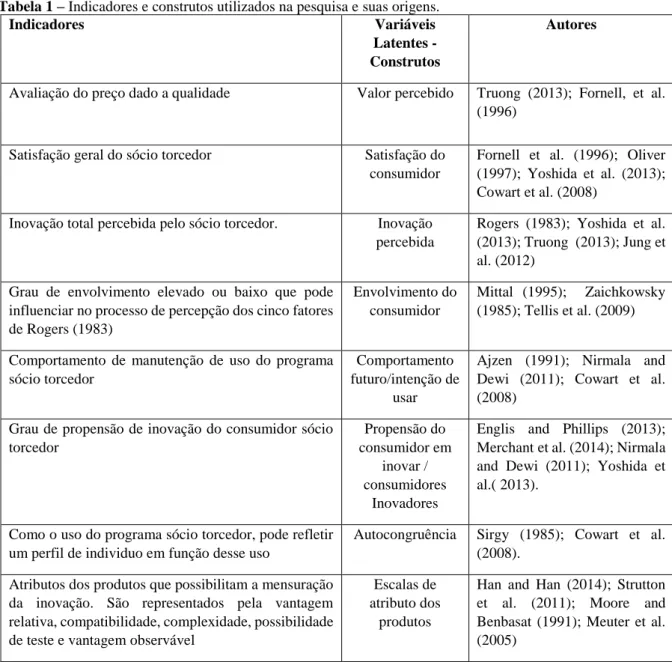
Table 1 - Indicators and constructs used in the research and its origins.
Indicators Latent Variables -
Constructs
Authors
Assessment of the price given to the quality Perceived value Truong (2013); Fornell, et al. (1996)
Supportive member overall satisfaction Consumer Satisfaction Fornell et al. (1996); Oliver (1997); Yoshida et al. (2013); Cowart et al. (2008)
Total innovation perceived by the supportive member.
Perceived Innovation Rogers (1983); Yoshida et al. (2013); Truong (2013); Jung et al. (2012)
High or low degree of involvement that may influence the perception process of Rogers (1983) five factors
Consumer Involvement Mittal (1995); Zaichkowsky (1985); Tellis et al. (2009)
Use maintenance of the supportive loyalty program behavior
Future behavior / intention to use
Ajzen (1991); Nirmala and Dewi (2011); Cowart et al. (2008) Consumer’s innovation supportive loyalty
propensity degree.
Consumer Propensity in Innovating / Innovativeness Consumers
Englis and Phillips (2013); Merchant et al. (2014); Nirmala and Dewi (2011); Yoshida et al.( 2013). How the supportive loyalty program use can
reflect an individual profile based on this use
Self -Congruence Sirgy (1985); Cowart et al. (2008). Products attributes that make it possible to
measure innovation. They are represented by the relative advantage, compatibility, complexity, testability and observable advantage
Product Attribute Scales
Han and Han (2014); Strutton et al. (2011); Moore and Benbasat (1991); Meuter et al. (2005)
Source: elaborated by authors.
In the case of complexity, unlike all other four items in the Rogers Model (relative advantage, compatibility, testability, and observable advantage), the lower this item is, the greater the possibility of adopting innovation. So, from the way that the scale was composed for complexity, a high value (grades between 8 and 10) represent a low complexity and a low value (evaluations between 0 and 2) represent a high complexity.
The scale used was of the interval type using the scaling ranging from 0 to 10 points with the anchors "totally disagree" (for the value 0) and "totally agree" (for the value 10). In order to the scales used in the present study be considered intervals and represent an identical continuum between the values - gradation - they represent, an 11 item scale is preferable to a seven-item scale (Nunnaly & Bernstein, 1994). The scale of 0 to 10 favors the reduction of statistical problems related to the extreme asymmetry, considering that it allows the researcher a better decision given the better visualization in the scale size (Fornell et al., 1996).
The pre-test was performed with 40 fan member respondent supporters and problems of understanding, doubts, blank questions, incorrect questions, were observed.
The data collection was performed through the application of a survey type questionnaire being disclosed on soccer fans Facebook groups and campaigns sponsorship for Facebook users
Proposition and test of an explanatory model of innovation perception and it´s consequences
with keywords, a tool that sent loyalty fan programs user and regionalized segmentation across the country via the Facebook ads tool.
A total of 883 forms were collected, and with Facebook groups publicity and word of mouth advertising were collected 283 forms and with the campaigns sponsorship, 600 forms were collected. The campaign on Facebook ads was viewed by 101,037 people, of which 2,414 times people clicked ads, but only 600 people filled the form in full.
The form was structured in the jotform forms tool that allows the collection of data from the internet protocol number of the person who sent the form, allowing the geographical verification where the questionnaire was filled. Because it was a national survey, this tool ensured that a verification was performed if the forms were actually filled in the different Brazilian states. Also, to guarantee the national scope of the research, specific links were sponsored with users from the Northeast, Southern Brazil, especially in the city of Recife, Porto Alegre and Salvador those city clubs.
Of the 883 collected forms, those who presented inadequate filling and in an inconspicuous way were eliminated. For this, a questionnaire was established in the questionnaire if the individual who was filling out the form was a supportive member, those who did not declare themselves as members of the supporter program had their questionnaires eliminated. A second applied test used the repetition of an issue in different questionnaire spots. Those loyalties who answered identical numbers or with a difference between -02 to +02 had their questionnaires kept in the sample and the others were eliminated. After checking all, there were 675 forms remaining, eliminating 208 questionnaires. The model tested has 42 variables from 12 constructs and the sample size allows for more than 10 cases for each variable. The sampling used was for convenience and the software used for the data analysis were SPSS and Amos.
5 Results
5.1 Sample data and characteristics treatment
The first analysis item refers to an atypical data or outliers identification, which occurred by calculating the Mahalanobis distance (Mahalanobis D²) which it is necessary to distribute
the test X2 with the freedom degree number (variables involved quantity), which are 42
independent variables with significance level below 0.01 (value of 66.206). All observations above this value are considered atypical multivariate (Hair et al., 2009).
After the test, 120 questionnaires were taken from the sample. The following tests will have as total sample amount of 555 questionnaires and, no more, the 675 initially. Because the
Pereira, M. J. R., Moura, L. R. C., Souki, G. Q., & Cunha, N. R. da S.
electronic forms did not allow questionnaires with blank questions to be sent - the respondent was obliged to fill in all the questions, leaving no missing date.
The next step was to verify the sample normality. For this, the Kolmogorov Smirnov Test (K-S Test) was performed. The results indicate that no indicator or variable that forms this research constructs shows normal distribution, since all the test values of significance presented values below 0.05.
Regarding the respondents, the majority of them are male, with the total of 89% sample, more than 75% between 26 and 45 years old, and the largest income range was concentrated in individuals receiving between 2 to 5 minimum wages in Brazil. Regarding the preferred team, the sample had 36.2% of fans in São Paulo, followed by Cruzeiro, Palmeiras and Atlético-MG fans. In total, the sample was made up with 19 team fans from the Brazilian soccer first, second, third and fourth division.
Considering the place of origin, the sample components live in 13 Brazilian states and the Federal District. The vast majority live in the São Paulo state (total of 53.7%), followed by the Minas Gerais state (total of 28.3%) and Rio Grande do Sul state (total of 10.01%). Although the sample does not present an equal distribution in quotas related to the demographic characteristics of the sample in the Brazilian population terms, it is a positive fact the participation of residents in half of the Brazilian states.
5.2 Unidimensionality, reliability and validity
The next step is related to the exploratory factorial analysis (AFE) for each of the twelve constructs present in the hypothetical model tested. For the AFE execution, there are three assumptions that must be met before results can be considered. The first one is the Kaiser-Meyer-Olkin (KMO) sample suitability test - which should have values greater than 0.70. but values greater than 0.60 are considered acceptable in exploratory studies (Malhotra, 2011; Hair et al., 2009). Another assumption that must be attended or met is related to Bartlett's Test of Strenuousness, which should achieve significant correlation between variables at the 95% level (Hair et al., 2009).
Finally, all the indicators that form the constructs must have a high level of correlation between them. The results obtained indicate that all the assumptions for all AFEs realization of the twelve constructs present in the model tested, presented adequate values, all the constructs presented only one dimension and all the items that form each of the constructs reached values for the component above 0.5.
Proposition and test of an explanatory model of innovation perception and it´s consequences
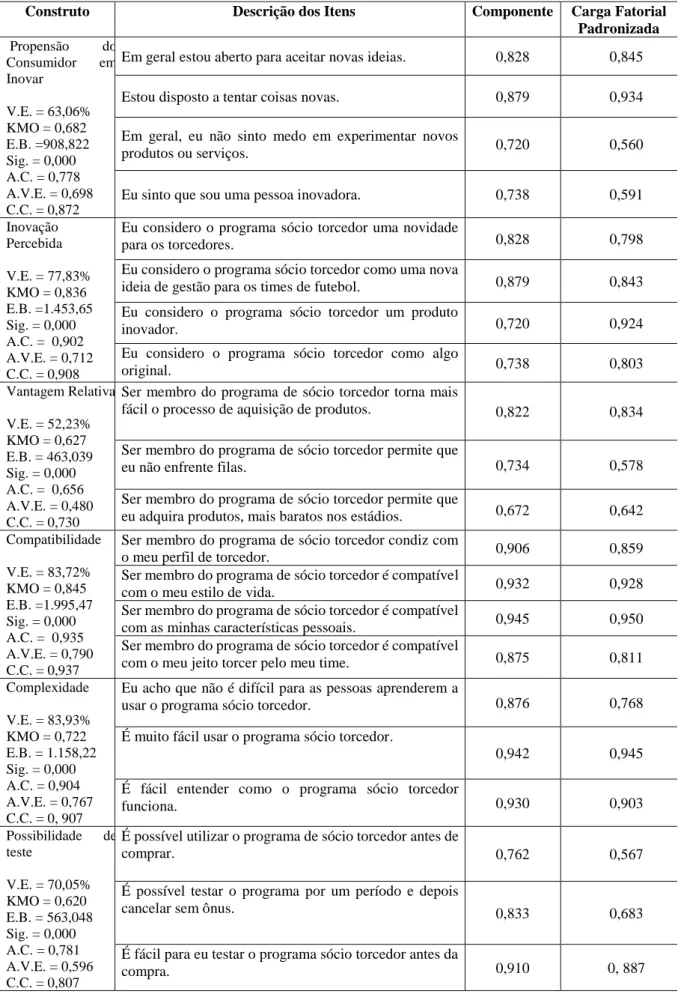
Another item that was analyzed concerns the scale reliability that measures each of the twelve constructs that was performed by calculation the Cronbach Alpha analysis value for each of them. The results considered adequate should be above 0.7, values above 0.6 are valid for exploratory scales, that is, for scales that have not been previously tested or validated (Hair et al., 2009). The results obtained were positive, since all constructs presented values above 0.6 and only the relative advantage presented a value below 0.7 (Table 2).
The next step was to verify the convergent validity for all twelve constructs. The convergent validity shows the strong correlation between the same construct measurements. (Malhotra, 2011; Hair et al., 2009). The average extracted variance (AVE) should have a minimum value of 0.5 and the composite reliability (CC) should have a minimum value of 0.7. The results presented in Table 2 show that there is convergent validity for all constructs, since all the CC values are above 0.7 and all the AVE value are above the 0.5 limit, including for the relative advantage, which presented a 0.48 value for the AVE, which is equivalent to 0.5 when undergoing the rounding process. All the values for the standardized factor load of all items that make up all the constructs presented values for the factorial load above 0.5.
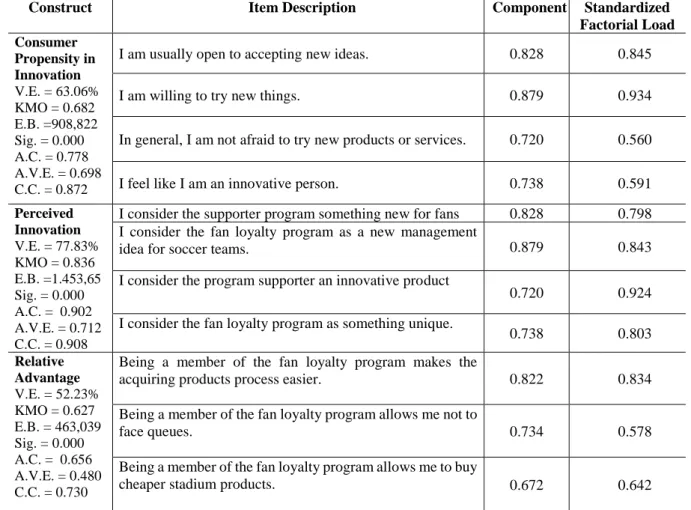
Table 2 - Dimension values, dimensions reliability and validity of the constructs present in
the model tested.
Construct Item Description Component Standardized
Factorial Load Consumer Propensity in Innovation V.E. = 63.06% KMO = 0.682 E.B. =908,822 Sig. = 0.000 A.C. = 0.778 A.V.E. = 0.698 C.C. = 0.872
I am usually open to accepting new ideas. 0.828 0.845
I am willing to try new things. 0.879 0.934
In general, I am not afraid to try new products or services. 0.720 0.560
I feel like I am an innovative person. 0.738 0.591
Perceived Innovation V.E. = 77.83% KMO = 0.836 E.B. =1.453,65 Sig. = 0.000 A.C. = 0.902 A.V.E. = 0.712 C.C. = 0.908
I consider the supporter program something new for fans 0.828 0.798 I consider the fan loyalty program as a new management
idea for soccer teams. 0.879 0.843
I consider the program supporter an innovative product
0.720 0.924
I consider the fan loyalty program as something unique.
0.738 0.803 Relative Advantage V.E. = 52.23% KMO = 0.627 E.B. = 463,039 Sig. = 0.000 A.C. = 0.656 A.V.E. = 0.480 C.C. = 0.730
Being a member of the fan loyalty program makes the
acquiring products process easier. 0.822 0.834
Being a member of the fan loyalty program allows me not to
face queues. 0.734 0.578
Being a member of the fan loyalty program allows me to buy
Pereira, M. J. R., Moura, L. R. C., Souki, G. Q., & Cunha, N. R. da S. Compatibility V.E. = 83.72% KMO = 0.845 E.B. =1.995,47 Sig. = 0.000 A.C. = 0.935 A.V.E. = 0.790 C.C. = 0.937
Being a member of the fan program matches my fan profile. 0.906 0.859 Being a member of the fan program is a compatible with my
lifestyle. 0.932 0.928
Being a member of the fan program is compatible with my
personal characteristics. 0.945 0.950
Being a member of the fan program is compatible with my
fan way of cheering for my team. 0.875 0.811
Completixity V.E. = 83.93% KMO = 0.722 E.B. = 1.158,22 Sig. = 0.000 A.C. = 0.904 A.V.E. = 0.767 C.C. = 0. 907
I don’t think is hard for people to learn how to use the fan
loyalty program 0.876 0.768
It is very easy to use the fan loyalty program.
0.942 0.945
It is easy to understand how the fan loyalty program works. 0.930 0.903
Testing Possibility V.E. = 70.05% KMO = 0.620 E.B. = 563,048 Sig. = 0.000 A.C. = 0.781 A.V.E. = 0.596 C.C. = 0.807
It is possible to use the fan loyalty program before
purchasing. 0.762 0.567
It is possible to test the program for a period and then cancel
without charge. 0.833 0.683
It is easy for me to test the loyalty program before the
purchase. 0.910 0. 887 Observable advantage V.E. = 67.19% KMO = 0.645 E.B. = 449,772 Sig. = 0.000 A.C. = 0.748 A.V.E. = 0.534 C.C. = 0.768
It is easy to watch other fans using the fan card in team’s
games. 0.845 0.741
It is easy to see the fans advantages by using their fan card
loyalty in the games or in the trade. 0.877 0.878
I’ve already seen friends or acquaintances using their fan
loyalty program. 0.730 0.531 Involvement V.E. = 80.20% KMO = 0.856 E.B. =2.801,09 Sig. = 0.000 A.C. = 0.928 A.V.E. = 0.788 C.C. = 0.949
Be a fan member is very important thing to me. 0.942 0.972
Be a fan member means a lot to me. 0.937 0.958
Be a fan member is very interesting to me. 0.903 0.883
Be a fan member is a priority to me. 0.830 0.786
Be a fan member “has to do with” my way of being. 0.860 0.824
Self-Congruence V.E. = 79.13% KMO = 0.703 E.B. = 872,716 Sig. = 0.000 A.C. = 0.868 A.V.E. = 0.698 C.C. = 0.872
Fans like me also participate in the loyalty program of their
teams. 0.898 0.839
I identify myself (recognize) with other fans who also
participate in the social-fan program of their teams. 0.925 0.935 A typical supporter’s image who participates in the fan
loyalty program combines highly with the image I have of myself 0.844 0.717 Perceived Value V.E. = 86.70% KMO = 0.735 E.B. = 1.315,17 Sig. = 0.000 A.C. = 0.920 A.V.E. = 0.804 C.C. = 0.925
The fan loyalty program is priced well considering the
benefits offered to me. 0.929 0.884
I think the fan loyalty program is a good relation with its
costs. 0.954 0.964
Considering all the costs and all the benefits, I think it is
worth it to pay to be a fan loyalty member. 0.910 0.837
Proposition and test of an explanatory model of innovation perception and it´s consequences V.E. = 83.59% KMO = 0.819 E.B. = 1.999,84 Sig. = 0.000 A.C. = 0.932 A.V.E. = 0.812 C.C. = 0.945
I am pleased to participate in my club’s fan loyalty program.
0.941 0.950
I am pleased with my decision to participate in the fan
loyalty program. 0.909 0.907
I find the fan loyalty program provided services to be
satisfactory. 0.892 0.855 Intention to reuse (Renew) V.E. = 79.13% KMO = 0.751 Sig. = 0.000 E.B. =1.818,72 A.C. = 0.954 A.V.E. = 0.877 C.C. = 0.955
I intend to participate in the program for a long time. 0.942 0.893
At the end of my annuity validity I intend to renew my
participation in the fan member program. 0.972 0.979
If my yearly fan program annuity ended today, I would
renew it. 0.958 0.935
Source: Elaborated by authors.
Notes: 1) V.E. is the variance explained by the factor. 2) KMO is the value of the KMO. 3) E.B is the value of Bartlett’s test of stiffness. 4) Sig. Is that of Barlett’s statistical sphericity test. 5) A.C. is the Cronbach Alpha value. 6) A.V.E. is the average variance extracted. 7) C. C. is the composite reliability.
After verifying the convergent validity, the discriminant validity was verified, which is obtained by comparing the square roots of the AVEs with the correlations between them. This technique establishes that the average variance values extracted from two constructs should be greater than the square of the correlation between them (Hair et al., 2009).
Each construct correlations do not exceed the AVEs roots, the results indicate the discriminant validity existence among the twelve constructs. The data analysis final part concerns the nomological validity verification of the tested model, which was performed through the structural equations modeling (SEM). The results are shown in Table 3.
Pereira, M. J. R., Moura, L. R. C., Souki, G. Q., & Cunha, N. R. da S.
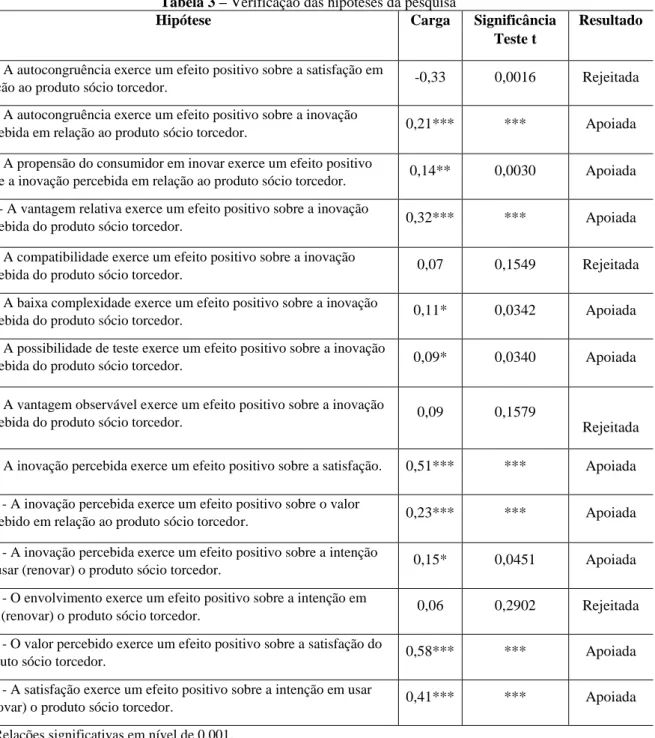
Table 3 - Search hypotheses verification.
Hypotheses Charge Test T
Significance
Results
H1 - Self-congruence has a positive effect on satisfaction with the fan
loyalty product. -0.33 0.0016 Rejected
H2 - Self-congruence has a positive effect on perceived innovation in
relation to the fan loyalty product. 0.21*** *** Supported
H3 - The consumer's propensity to innovate exerts a positive effect on
the perceived innovation in relation to the fan loyalty product. 0.14** 0.0030 Supported H 4 - Relative advantage has a positive effect on the fan loyalty product
perceived innovation. 0.32*** *** Supported
H5 - Compatibility has a positive effect on the perceived fan loyalty
product perceived innovation. 0.07 0.1549 Rejected
H6 - Low complexity has a positive effect on the fan loyalty product
perceived innovation. 0.11* 0.0342 Supported
H7 - The possibility of testing has a positive effect on the fan loyalty
product perceived innovation. 0.09* 0.0340 Supported
H8 - The observable advantage exerts a positive effect on the fan loyalty
product perceived innovation. 0.09 0.1579 Rejected
H9 - Perceived innovation has a positive effect on satisfaction. 0.51*** *** Supported H10 - Perceived innovation has a positive effect on the perceived value
in relation to the fan loyalty product. 0.23*** *** Supported
H11 - Perceived innovation has a positive effect on the intention to use
(renew) the fan loyalty product. 0.15* 0.0451 Supported
H12 - Involvement has a positive effect on the intention to use (renew)
the fan loyalty product. 0.06 0.2902 Rejected
H13 - Perceived value has a positive effect on the fan loyalty product
satisfaction. 0.58*** *** Supported
H14 - Satisfaction has a positive effect on the intention to use (renew)
the fan member product. 0.41*** *** Supported
Source: Elaborated by authors.
*** Significant relationship at the 0.001 level. ** Significant relationship at the 0.01 level. * Significant relationship at the 0.05 level.
According to Table 3, from fourteen relationships present in the model, eleven were statistically significant. It is concluded that, then, the nomological validity was partially achieved.
The factor indicated on the results that impact perceived innovation perception are: relative advantage, complexity and testing possibility. Results that do not fully address Rogers' theory five factors (1983) are found in the literature, as in the case of cloud service adoption process in which a same questionnaire applied to different user profiles of the consumer chain presented only two or three Rogers's theory (1983) construct with significant values (Hashin et
Proposition and test of an explanatory model of innovation perception and it´s consequences
al., 2015). In the implementing a mobile learning platform process, only three factors were found to be statistically significant (Joo et al., 2014) and in the technological innovations case, only relative advantage, compatibility and complexity influenced the adopting process new technologies (Wang & Wang, 2016). On meta-data study based, it was identified that the factor that most impacts the innovations adoption considering the literature analysis was the innovation perceived with (statistically significant in 79% of the studies), followed by the observable advantage (70%), Testability (64%), compatibility (54%) and complexity (48%). Thus, the aggregate results of several studies indicate that these factors influence the rate innovations adoption (Hameed & Counsell, 2014). It can be affirmed that, although only three of Roger’s five factors (1983) presented statistical significance from the theoretical point of view, the factors are partially in agreement with what is in the theory.
Regarding the compatibility, the fact of supporting a soccer team probably leads to many emotions and passions for the consumer. However, the Fan Loyalty Program has functional advantages to its customers. Thus, there may have been a gap between the functional perception of this product and the emotional content of the construct compatibility by means of their questions regarding the supporting form, its personal characteristics and etc. In the case of the observable Advantage construct, it was found that the respondents have difficulty observing other people using the product and obviously the advantage that it receives. In this case, it may be that the communication of clubs about the advantages of Fan Loyalty Program being using by clubs fans, as well as the fact that many benefits are obtained directly via the internet, makes that respondents have difficulty observing other members using the Fan Loyalty Card.
Perceived innovation has also as its precedent the self-congruence that presented significance with 0.001 values and 0.23 load. Self-congruence is identified as an intention precedent to use by consumers (Cowart et al., 2008; Rodriguez et al., 2012; Hosany & Martin, 2012; Kerssmann et al., 2006; Mazodier & Merunka, 2012; Badrinarayanan et al., 2014). Self-congruence was found as a precedent in the adopting innovative investment products process (Hoffman & Broekhuizen, 2010). Self-congruence shows as a direct and robust precedent of perceived innovation among video games consumers (Davis et al., 2013). Self-congruence presents itself as a direct perceived innovation precedent and an intention to renew indirect precedent to the extend that it presents a statistical significance like this construct.
Another set up that precedes the perceived innovation is the consumer's propensity to innovate, which presented statistical significance. The consumer's propensity to innovate is shown as a direct precedent of perceived innovation in a study that has as purpose to measure
Pereira, M. J. R., Moura, L. R. C., Souki, G. Q., & Cunha, N. R. da S.
innovation in a work environment (Yuan & Woodman, 2010) and in an adopting e-books process (Jung et al., 2012).
Out of the seven constructs that precede perceived innovation, five of them present statistical significance: relative advantage, testing possibility, complexity, self-congruence and consumer propensity to innovate. The relative advantage and the self-congruence are those that present the highest values loads in relation to the perceived innovation.
Perceived value has as its precedent the perceived innovation. Truong (2013) identified that in some countries the consumer's propensity to innovate was a precedent for consumer perceptions of innovative products. Such identification is confirmed in the present study because the consumer's propensity to innovate is a perceived innovation precedent and is a perceived value precedent. Is concluded that in the present model based on statistical significance, perceived innovation is a perceived value precedent.
In relation to satisfaction, it was proposed in the model that three constructs would be its precedents. Perceived innovation presented statistical significance, which is in accordance with Yoshida et al. (2013), who identified the innovation perceived as a soccer fans' satisfaction precedent. Perceived value is also a statistically significant satisfaction predecessor, so with Fornell et al. (1996) results and with the study developed by Truong (2013). The self-congruence that also presented statistical significance, but with a negative load value, which goes against the theory that supported that the greater the self-congruence with the product, the greater the satisfaction (Cowart et al., 2008; Tsai et al., 2015).
The intention construct in renewal was proposed in the model having the satisfaction, perceived innovation, and involvement constructs as precedents. For the two first constructs case, the results are statistically significant and are in line with the theory (Cowart et al., 2008; Yoshida et al., 2013). But, the involvement did not present statistical significance and does not conform to the theory, since it was identified that consumer involvement was a precedent of intention to use (Rahmam, 2014; Reinhardt & Gurtner, 2015).
Results indicate that both perceived innovation and perceived value strongly influence satisfaction, which in turn strongly influences the intention to renew. Satisfaction showed R² values of 71.27%, which means that the model presents a good explanation index for the referred construct. As for the R² perceived innovation values, was obtained 32.87%, which, although a value well below innovation, presented a reasonable value given the constructs number that precede it. Perceived value had a remarkably low R² value of 5.47%. Already the intention to renew reached variance value explained R² of 12.64%.
Proposition and test of an explanatory model of innovation perception and it´s consequences
Whereas the involvement construct showed no statistical significance and its load value reached 0.06. This result is not in accordance with the theory, considering that it was identified that, in studies with a focus on innovation, the consumer involvement is presented as a precedent of the intention to use. Such result was found by Rahmam (2014) and Reinhardt and Gurtner (2015). In the present study, such construct showed no statistical significance, which, for this sample, it cannot be stated that, when the greater the involvement, the greater the intention will be to renew the product partner-supporter. It is noteworthy to emphasize that the studied involvement was the involvement with the product partner-supporter and not the involvement with the club.
Finally, the GFI (Goodness of Fit Index), X2/degree of freedom and RMSEA (Root Mean
Square Error of Approximation) indices were analyzed. The results indicate that in the last two
indices case, the values obtained are adequate. The X2/degree of freedom was 2.01 (ranging
from 1 to 3) and the RMSEA index was 0.04270 allowing a variation between 0.03 and 0.08 (HAIR et al., 2009). About the GFI index, the result obtained was 0.87, value close to the appropriate minimum of 0.90. It should be emphasized that more complex models with samples larger than 250 elements should have a less restrictive assessment in relation to the values indicated as adequate for the fit indices (HAIR et al., 2009). The model tested has a total of twelve constructs, being formed by 42 indicators.
6 Final considerations
From the theoretical point of view, the present study addresses the work gap developed by Yoshida et al. (2013), who developed a perception model of innovation in a student league club and not in a professional league. Another gap concerns the need to test innovation perception models in samples with the broad public and not restrict to exclusive samples in the university environment (Xie & Notish, 2007; Jung & Kim, 2005). The proposed and tested innovation model was applied in a sample of individuals who cheer for teams from the main professional soccer divisions.
The innovation diffusion theory established by Rogers (1983) and the models perceived innovation measurement modeling are usually used in the literature in technology and industry environments (Moore & Benbasat, 1991; Jung et al., 2012; Han, 2014; Joo & Lim, 2014; Yang, 2015; Hashim et al., 2015). The perceived innovation measurement in a product with a different nature to the technology environment in the Brazilian professional soccer environment, makes it possible to assess the proposed theories in a singular and specific cultural and demographic environment. Innovation perceived by the supporter member presented as precedent the relative
Pereira, M. J. R., Moura, L. R. C., Souki, G. Q., & Cunha, N. R. da S.
advantage, the testing possibility, complexity, self-congruence and consumer propensity to innovate. It’s noted that, in the present work, the perceived innovation presented itself as a robust precedent of the fan loyalty satisfaction.
It is important to assess the innovative products diffusion, not only by their past behavior, but also by future intention behavior (Van Rijnsoever & Castaldi, 2011). The present study identified in the sample studied that the intention to renew of those fans who initially adopted their fan loyalty programs is highly related to product satisfaction.
Consumer satisfaction has been seen as a crucial factor for the success of the most varied types of organizations, especially by directly influencing consumer loyalty (Oliver, 1997; Terblanche, 2006). In the current study, it is important to give a managerial approach, so insights can be established in order to develop the supportive loyalty product within the Brazilian soccer clubs. As demonstrated, the supportive member receives loads that positively impact their satisfaction. It is necessary to point out what can be developed or improved by the clubs with the purpose of acting on these variables to maximize them and so that it is services possible to maintain and / or increase revenues.
Considering that the relative advantage perceived by the supportive member is important, clubs should seek to enhance this perception by seeking to keep the sites for the exclusive tickets purchase always stable and unlocked. Exclusive stadium rows access should always be organized and cleaned with highly trained staff to serve these fan members. The discount program between partners should seek to establish an effective advantage relationship, with real and perceptible discounts for each partner profile. These actions can positively accentuate the relative advantage perception between the services range available to partners and non-members.
It is possible to create strategies that reinforce the self-congruence and supporters involvement so that these consumers can remain faithful to the program. So clubs can enhance specific services such as exclusive meetings and parties between club members and club members. Increase campaigns that reinforce the image that fan loyalty programs members represent some status level among other fans. Develop a shirt that, with highlights, refer to those fan loyalty program members.
The fact that, the sample is not probabilistic, is one of this work great limitations due to the impossibility of generalizing the results. The questionnaire presented a large number of issues, which may have caused the withdrawal of many respondents throughout the process of its completion and also the recent performance of the soccer team can influence the level of questionnaires answered by their supporters. Thus, it cannot be assured that the perception
Proposition and test of an explanatory model of innovation perception and it´s consequences
about the constructs measured in this research is the same among respondents who completed the questionnaire and among those who dropped out and did not complete the filling out. The same occurs in relation to the supporters who did not participate in the research, but that would have a greater opportunity to participate in case their team had a better performance in field and the supporters who completed the questionnaire. Do they have the same perceptions about the constructs measured in the research? Finally, it occurs that internet access is not homogeneous in Brazil considering the different geographical regions of the country. Thus, the respondents’ opinions in certain regions may differ in relation to the population in general. Thus, it is perceived that all these factors contribute so that the research may present some kind of vies in relation to the obtained results.
To future studies, the present study presented some gaps that can be explored in new studies. Although the theory demonstrates that self-congruence is a robust consumer satisfaction precedent and that perceived innovation was not a direct intention to renew precedent, in the present study the opposite has been identified.
Other studies have analyzed different constructs on perceived innovation terms and intent to use to adopt a product or service. These constructs were identified as degree of novelty, perceived risk, trust and brand equity among others (Yoshida et al., 2013; Truong, 2013; Nirmala & Dewi, 2011). New studies analyzing and testing the insertion or exchange of some of these constructs with the original model constructs may mean a theoretical gain in consumer assessment terms of innovation and its consequences.
References
Aggeri, F. & Segrestin, B. (2007). Innovation and project development: an impossible equation? Lessons from an innovative automobile project development. R&d Management,
37(1), 37-47.
Ahmad, J., Hussain. M. & Rajput, A. (2015). Customer loyalty framework of telecommunication service market. International Journal of Managing Value and Supply
Chains, 6(1), 69-78.
Badrinarayanan, V., Becerra, E. P. & Madhavaram, S. (2014). Influence of congruity in store-attribute dimensions and self-image on purchase intentions in online stores of multichannel retailers. Journal of Retailing and Consumer Services, 21(6), 1013-1020.
BDO Rcs Auditores Indepentes (2015). 8º O valor das marcas dos clubes brasileiros: finanças
dos clubes.
https://www.bdobrazil.com.br/pt-br/publicacoes/publicacoes/9%C2%BA-valor-das-marcas-dos-clubes-brasileiros. last acessed March 25, 2017.
Blackwell, R. D., Miniard, P. W. & Engel, J. F. (2005). Consumer behavior. Florence: South-Western College Pub.
Pereira, M. J. R., Moura, L. R. C., Souki, G. Q., & Cunha, N. R. da S.
Chakrabarti, S. & Baisya, R. K. (2009). Purchase of organic food: role of consumer innovativeness and personal influence related constructs. Management Review, 21(1), 18-29.
Chen, R. F., Hsiao, J. L. & Hwang, H. G. (2012). Measuring customer satisfaction of internet banking in Taiwan: scale development and validation. Total Quality Management &
Business Excellence, 23(7-8), 749-767.
Cowart, K. O., Fox, G. L. & Wilson, A. E. (2008). A structural look at consumer innovativeness and self‐congruence in new product purchases. Psychology & Marketing, 25(12), 1111-1130.
Damanpour, F. & Schneider, M. (2009). Characteristics of innovation and innovation adoption in public organizations: Assessing the role of managers. Journal of public administration
research and theory, 19(3), 495-522.
Danneels, E. & Kleinschmid, E. J. (2001). Product innovativeness from the firm's perspective: its dimensions and their relation with project selection and performance. Journal of Product
Innovation Management, 18(6), 357-373.
Davila, T., Epstein, M. & Shelton, R. (2012). Making innovation work: how to manage it,
measure it, and profit from it. New Jersey, NJ: FT Press.
Davis, F. D. (1989). Perceived usefulness, perceived ease of use, and user acceptance of information technology. MIS quarterly, 13(3), 319-340.
Davis, R., Lang, B. & Gautam, N. (2013). Modeling utilitarian-hedonic dual mediation (UHDM) in the purchase and use of games. Internet Research, 23(2), 229-256.
Englis, B. G. & Phillips, D. M. (2013). Does innovativeness drive environmentally conscious consumer behavior? Psychology & Marketing, 30(2), 160-172.
Fang, Y., Qureshi, I., Sun, H., McCole, P., Ramsey, R. & Lim, K. H. (2014). Trust, satisfaction, and online repurchase intention: the moderating role of perceived effectiveness of e-commerce institutional mechanisms. Mis Quarterly, 38(2), 407-427.
Fitzmaurice, J. (2005). Incorporating consumers' motivations into the theory of reasoned action.
Psychology & Marketing, 22(11), 911-929.
Fornell, C., Johnson, M. D., Anderson, E. W., Cha, J. & Bryant, B. E. (1996). The American customer satisfaction index: nature, purpose, and findings. Journal of Marketing, 60(1), 7-18.
Futebol Melhor. (2016). Torcedômetro. Movimento por um fubebol melhor.
http://www.futebolmelhor.com.br. last acessed March 22, 2017.
Gutman, L. F. D., Joia, L. A. & Moreno Jr., V. A. (2014). Antecedentes da intenção de uso de sistemas de home broker sob a ótica dos investidores do mercado acionário. Revista de
Administração, 49(2), 353-368.
Hair Jr., J. F., Black, W. C., Babin, B. J., Anderson, R. E. & Tathan, R. L. (2009). Multivariate
Proposition and test of an explanatory model of innovation perception and it´s consequences
Hameed, M. A. & Arachchilage, N. A. G. (2016). A model for the adoption process of information system security innovations in organisations: a theoretical perspective. ACIS
2016 proceedings.
Hameed, M. A. & Counsell, S. (2014). Establishing relationships between innovation characteristics and it innovation adoption in organisations: a meta-analysis approach.
International Journal of Innovation Management, 18(1), 1450007-1-1450007-41.
Hameed, M. A., Counsell, S. & Swift, S. (2012). A conceptual model for the process of IT innovation adoption in organizations. Journal of Engineering and Technology
Management, 29(3), 358-390.
Han, I. & Han, S. (2014). Adoption of the mobile campus in a cyber university. The
International Review of Research in Open and Distributed Learning, 15(6), 237-256.
Hashim, K. F., Tan, F. B. & Rashid, A. (2015). Adult learners' intention to adopt mobile learning: a motivational perspective. British Journal of Educational Technology, 46(2), 381-390.
Hashim, H. S., Hassan, Z. B. & Hashim, A. S. (2015). Factors influence the adoption of cloud computing: a comprehensive review. International Journal of Education and Research,
3(7), 295-306.
Hoffmann, A. O. & Broekhuizen, T. L. (2010). Understanding investors' decisions to purchase innovative products: drivers of adoption timing and range. International journal of
Research in marketing, 27(4), 342-355.
Hosany, S. & Martin, D. (2012). Self-image congruence in consumer behavior. Journal of
Business Research, 65(5), 685-691.
Hunt, H. K. (1977). CS/D: overview and future research direction. In Hunt, H. K. (Ed.),
Conceptualization and Measurement Of Consumer Satisfaction and Dissatisfaction, (pp.
455-488), Cambridge: MSI.
Im, S., Bayus, B. L. & Mason, C. H. (2003). An empirical study of innate consumer innovativeness, personal characteristics, and new-product adoption behavior. Journal of
the Academy of Marketing Science, 31(1), 61-73.
Jing, F. (2016). An empirical study on the features influencing users' adoption towards personal health records system. ICSSSM 2016 proceedings.
Joo, Y. J., Lim, K. Y. & Lim, E. (2014). Investigating the structural relationship among perceived innovation attributes, intention to use and actual use of mobile learning in an online university in South Korea. Australasian Journal of Educational Technology, 30(4), 427-439.
Jung, H. & Kim, W. (2005). Investigating the effects of consumer innovativeness on shape of consideration sets: focusing on comparison between consideration sets of innovators and non-innovators. In Menon, G., Rao, A. R. & Duluth, M. N. (Eds.), Advances in Consumer
Pereira, M. J. R., Moura, L. R. C., Souki, G. Q., & Cunha, N. R. da S.
Jung, J., Chan-Olmsted, S., Park, B. & Kim, Y. (2012). Factors affecting e-book reader awareness, interest, and intention to use. New Media & Society, 14(2), 204-224.
Kleinschmidt, E. J. & Cooper, R. G. (1991). The impact of product innovativeness on performance. Journal of Product Innovation Management, 8(4), 240-251.
Kressmann, F., Sirgy, M. J., Herrmann, A., Huber, F., Huber, S. & Lee, D. J. (2006). Direct and indirect effects of self-image congruence on brand loyalty. Journal of Business Research,
59(9), 955-964.
Kroff, M. W. & Reilly, M. (2011). Exploring consumer perceptions of product innovativeness.
Review of Management Innovation & Creativity, 4(9), 101-117.
Lee, Y. & O'connor, G. C. (2003). The impact of communication strategy on launching new products: the moderating role of product innovativeness. Journal of Product Innovation
Management, 20(1), 4-21. http://dx.doi.org/10.1111/1540-5885.t01-1-201002
Malhotra, N. K. (2013). Marketing research: an applied orientation. Upper Saddle River, NJ: Prentice Hall.
Mazodier, M. & Merunka, D. (2012). Achieving brand loyalty through sponsorship: The role of fit and self-congruity. Journal of the Academy of Marketing Science, 40(6), 807-820. Merchant, A., Rose, G. & Rose, M. (2014). The impact of time orientation on consumer
innovativeness in the United States and India. Journal of Marketing Theory and Practice,
22(3), 325-338.
Meuter, M. L., Bitner, M. J., Ostrom, A. L. & Brown, S. W. (2005). Choosing among alternative service delivery modes: an investigation of customer trial of self-service technologies.
Journal of Marketing, 69(2), 61-83.
Mittal, B. (1995). A comparative analysis of four scales of consumer involvement. Psychology
& Marketing, 12(7), 663-682.
Moore, G.C. & Benbasat, I. (1991). Development of an instrument to measure the perceptions of adopting an information technology innovation. Information systems research, 2(3), 192-222.
Moura, L. R. C., Torres, E. P., Cunha, N. R. da. S., Moura, L. E. L. de & Caixeta, L. V. (2008). Desenvolvimento e teste de uma escala para mensuração das características que incentivam a adoção de novos produtos: um estudo sobre os carros bi-combustíveis. EMA
2008, proceedings, Curitiba, Brasil.
Moura, L. R. C., Torres, E. P., Cunha, N. R. S. da, Moura, L. E. L. de & Caixeta, L. V. (2012). Desenvolvimento e teste de uma escala para mensuraçao das características que incentivam a adoçao de novos produtos: um estudo sobre os carros bi-combustíveis.
Nucleus, 9(1), 209-224.
Nirmala, R. P. & Dewi, I. J. (2011). The effects of shopping orientations, consumer innovativeness, purchase experience, and gender on intention to shop for fashion products online. Gadjah Mada International Journal of Business, 13(1), 65-83.
Proposition and test of an explanatory model of innovation perception and it´s consequences
Nunnally, J. C. & Bernstein, I.H. (1994). Psychometric theory. New York, NY: McGraw-Hill. Oliver, R. L. A. (1997). Satisfaction: a behavioral perspective on the consumer. Boston, MA:
Irwin/McGraw-Hill.
Rahman, S. U., Saleem, S., Akhtar, S., Ali, T. & Khan, M. A. (2014). Consumers' adoption of apparel fashion: the role of innovativeness, involvement, and social values. International
Journal of Marketing Studies, 6(3), 49-64.
Ram, S. & Jung, H. S. (1989). The link between involvement, use innovativeness and product usage. In Srull, T. K. (Ed.), Advances in Consumer Research, v. 16, (pp. 160-166). Provo, UT: Association for Consumer Research.
Reinhardt, R. & Gurtner, S. (2015). Differences between early adopters of disruptive and sustaining innovations. Journal of Business Research, 68(1), 137-145.
Reis, R. M., Remédios, J. L. D., Telles, S. D. C. C. & Costa, L. P. da (2014). The football business in Brazil: connections between the economy, market and media. Motriz: Revista
de Educação Física, 20(2), 120-130.
Rodriguez, A., Bosnjak, M. & Sirgy, M. J. (2012). Moderators of the self-congruity effect on consumer decision-making: a meta-analysis. Journal of Business Research, 65(8), 1179-1188.
Roehrich, G. (2004). Consumer innovativeness: Concepts and measurements. Journal of
Business Research, 57(6), 671-677.
Rogers, E. M. (1983). Diffusion of innovations. New York, NY: The Free Press.
Rouseff, D., Levy, J. F. V., Dias, M., Barbosa, N., Hilton, G. & Adams, L. I. L. (2015). Lei nº 13.155, de 4 de agosto de 2015.
Silva, C. V. D. G. F. & Campos Filho, L. A. N. (2006). Gestão de clubes de futebol brasileiros: fontes alternativas de receita. Sistemas & Gestão, 1(3), 195-209.
Sirdeshmukh, D., Singh, J. & Sabol, B. (2002). Consumer trust, value, and loyalty in relational exchanges. Journal of marketing, 66(1), 15-37.
Sirgy, M. J. (1985). Using self-congruity and ideal congruity to predict purchase motivation.
Journal of business Research, 13(3), 195-206.
Solomon, M. R. (2014). Consumer behavior: buying, having, and being. Upper Saddle River, NJ: Pearson.
Strutton, H. D., Lumpkin, J. R. & Vitell, S. J. (2011). An applied investigation of Rogers and Shoemakers perceived innovation attribute typology when marketing to elderly consumers. Journal of Applied Business Research, 10(1), 118-131.
Tellis, G. J., Yin, E. & Bell, S. (2009). Global consumer innovativeness: cross-country differences and demographic commonalities. Journal of International Marketing, 17(2), 1-22.