Alternative
polyadenylation in CD2
expression
Inês Boal Carvalho
Mestrado de Biologia Celular e Molecular
Departamento de Biologia2013
Orientadora
Dra. Alexandra Moreira, Investigadora Principal, GR-IBMC
Co-orientadora
Dra. Mafalda Pinto, Bolseira pós-doutoramento,
CAGE-IBMC
Acknowledgements
Em primeiro lugar quero agradecer à Alexandra, minha orientadora, por me ter recebido no laboratório e por me ter incentivado para a ciência. Foi também uma experiência muito valiosa e um motivo de orgulho ter sido incluída no nascimento de um novo grupo de investigação. Por fim, gostava de agradecer por me ter dado liberdade de escolha nos temas a abordar e me ter direccionado sempre que precisei e ainda pela amizade com que sempre me tratou.
Em segundo lugar tenho de agradecer à minha principal companheira nesta “journey” – Baldi. Apesar de ter sido uma long, e por vezes bumpy, road sem ti tudo isto não teria tido metade da piada nem produtividade. As Ineses inseparáveis são a risota mas também, e principalmente, discutem muito ciência!
Tenho ainda de agradecer às outras colegas do GR: à Isabel, obrigada por teres chegado e “revolucionado” o laboratório com o teu know-how, a tua honestidade e a tua boa-disposição. E já agora aos teus “patinhos” Ana e Éder, para além de divertidos muito interessados.
Obrigada também à Vânia e Andrea pela ajuda e disponibilidade!
Tenho de agradecer ao João Relvas e ao grupo Glial Cell Biology, todos sempre disponíveis para me ajudar com células, indicações, reagentes...
Agradeço também à Terese Summavielle, incansável em ajudar-me e ensinar-me com a maior paciência!
Ao CAGE e TECs, em especial à Rita e Liliana, sempre muito disponíveis para me ajudar e ao Alexandre por todo o apoio.
Agradeço à minha família pela paciência em tolerar os meus horários por vezes pouco funcionais.
Aos meus amigos, em especial à Fi por teres sido a melhor amiga mais paciente e compreensiva do mundo e, mesmo eu estando ausente a maior parte do tempo, nunca teres deixado de estar do meu lado.
Por fim agradeço ao Francisco, por todo o apoio tanto a nível científico como emocional.
Table of Contents
Abbreviations ... 4 Abstract ... 6 Sumário ... 7 Introduction ... 1 Gene Expression ... 1 Transcription control ... 1 Post-transcriptional regulation ... 2Alternative polyadenylation (APA) ... 4
RNA-binding proteins (RBPs) and microRNAs (miRNAs) ... 5
APA modulation in different tissues and cell states ... 8
APA in the nervous system ... 9
APA in the immune system ... 10
CD2 ... 11
Aims ... 13
Material & Methods ... 14
In silico analysis ... 14
Human PBMCs isolation... 14
Human T lymphocytes extraction ... 14
Cell Culture ... 15
Cell Activation ... 15
Wistar rat tissue handling ... 15
Human tissue handling ... 15
Total RNA extraction ... 16
RT-PCR ... 17
3’RACE ... 18
Cloning into TOPO® vector ... 20
Transformation of competent bacteria ... 20
Colony PCR ... 20
Real-time qPCR ... 21
Northern blot analysis ... 21
Antibodies ... 21
Protein extraction for western blot analysis... 22
SDS-PAGE (PolyAcrilamid Gel Eletrophoresis) ... 22
Brain sections immunohistochemistry ... 23
Results... 25
Human CD2 mRNA has two different APA sites in the 3’-UTR and putative binding sites for RBPs and miRNAs ... 25
CD2 mRNA isoforms are conserved in several mammal species ... 28
Human primary T lymphocytes express two CD2 mRNAs differing in their 3’-UTR lengths ... 30
CD2 proximal PAS is preferentially used upon T cell activation ... 32
CD2 mRNA and protein are expressed in human and rat brain ... 35
Rat CD2 APA is tissue- and developmental-specific ... 39
Discussion ... 40
CD2 undergoes APA ... 41
CD2 mRNA sequence conservation in mammal species ... 43
CD2 mRNA isoforms are differentially expressed upon T cell activation ... 44
CD2 expression and APA ... 45
Working models ... 47
Abbreviations
A Adenine
APA Alternative Polyadenylation
APS Ammonium Persulfate
BDNF Brain-derived Neurotrophic Factor
Bp Basepair
BSA Bovine Serum Albumine
C Cytosine
CD Cluster of Differentiation
Clcn1 Chloride Channel 1
CPSF Cleavage and Polyadenylation Specificity Factor CstF Cleavage Stimulation Factor
CF Cleavage Factor
C2 Complement 2
dNTP Deoxyribonucleotide
DNA Deoxyribonucleic Acid
EDTA Ethylenediamine Tetraacetic Acid ELAV Embryonic Lethal Abnormal Vision
F Forward
G Guanine
GABA γ-Aminobutyric Acid
HRP Horseradish Peroxidase
hnRNP F Heterogeneous Nuclear Ribonucleoprotein F
Ig Immunoglobulin
MHC Major Histocompatibility Complex
MRC Medical Research Council
mRNA Messenger RNA
miRNA / miR MicroRNA
mAbs Monoclonal Antibodies
NOVA Neuro-Oncological Ventral Antigen
NK Natural Killer
Nt Nucleotide
ON Overnight
PA Polyadenylation
PAP Polyadenylation polymerase PABP Polyadenylation Binding Protein PAGE Polyacrylamide Gel Electrophoresis
PCR Polymerase Chain Reaction
PMSF Phenylmethylsulfonyl Fluoride PTB Polypyrimidine Tract Binding-protein PBMCs Peripheral Blood Mononuclear Cells
PHA Phytohemagglutinin
qPCR Quantitative Polymerase Chain Reaction
R Reverse
RACE Rapid Amplification of cDNA Ends
RT Reverse Transcriptase
RNA Ribonucleic Acid
RNA Pol II RNA Polymerase-II
RBPs RNA-binding protein
SDS Sodium Dodecyl Sulfate
S.E.M. Standard Error of the Mean
snRNP Small Nuclear Ribonucleoprotein Particles
SMA Spinal Muscular Atrophy
SMN2 Survival of Motor Neuron 2
T Thymine
TEMED Tetramethylethylenediamine
TF Transcription Factor
TSS Transcription Start Site
TCR T Cell Receptor
U Uracil
UTR Untranslated Region
USE U-rich Sequence Elements
Abstract
Gene expression in eukaryotes is regulated at different levels, including transcription and RNA processing. Alternative polyadenylation (APA) in the 3’-UTR, during 3’end pre-mRNA processing, has a fundamental role in gene expression in a variety of cellular programs: cellular differentiation and proliferation, leukocyte and neuron activation, and cancer. This important step in 3’end processing is mediated by several cis-elements and trans-acting factors. Trans-acting factors comprise RNA-binding proteins (RBP) that act as modulators. It has been reported that the shortening of the 3’-UTR through APA causes the loss of microRNAs (miRs) target sites in the mRNAs, decreasing the chance for silencing/degradation of the mRNA molecules, therefore resulting in the production of higher amounts of protein. Human T lymphocytes stimulated through T cell receptors express preferentially mRNA isoforms with shorter 3’-UTRs. CD2 encodes a transmembrane glycoprotein present in T cells that acts as an adhesion molecule and as a signal transducer during the immunological synapse formation. There are two mRNA isoforms for human CD2 generated by APA, differing in its 3’-UTR length. However, the physiological functionality of the formation of multiple CD2 mRNA species is still undisclosed. We show that CD2 3’-UTR sequence presents a high degree of conservation among several mammals. Analysis of the 3’-UTR led to the finding of a putative binding site for miR-320 in the longer 3’-UTR and several binding sites for RBPs, including NOVA1, a protein characteristically expressed in the brain. We observed that CD2 APA in the 3’-UTR is dependent on T cell activation, as proximal polyadenylation signal (PAS) is more efficiently used in activated T cells. Additionally, it has been described the expression of immune molecules in neurons, but their role in this system is still unknown. As the nervous system is similar to the immune system concerning many phenomenological, functional and molecular properties, the presence of CD2 in the brain and the involvement of APA in its expression were investigated. We found that CD2 is expressed in cerebellum, cortex, hippocampus and thalamus in human brains. We additionally found that the two CD2 mRNAs are present in the thymus and in a differentiated brain cell line however only the shorter CD2 isoform is produced in undifferentiated brain cells.
Two working models for CD2 mRNA APA concerning the nervous and immunological systems were constructed based on the evidences found.
Sumário
A expressão génica em eucariotas é regulada a diferentes níveis, incluindo transcrição e processamento de RNA. Poliadenilação alternativa (APA) na 3'-UTR, durante o processamento a 3’ do pré-mRNA, tem um papel fundamental para a expressão dos genes numa variedade de programas celulares: diferenciação celular e proliferação, activação de leucócitos e neurónios, e desenvolvimento de cancro. Este passo fundamental no processamento da extremidade 3' é mediado por vários elementos cis e factores trans. Factores trans compreendem proteínas de ligação ao RNA (RBP), que agem como moduladores. Tem sido relatado que o encurtamento da 3'-UTR através de APA provoca a perda de locais de ligação de microRNAs (miR) em moléculas de mRNA, diminuindo a possibilidade de silenciamento / degradação das das mesmas, resultando assim na produção de quantidades mais elevadas de proteína. Linfócitos T humanos estimulados através de receptores de células T expressam preferencialmente isoformas de mRNA isoformas com 3'-UTRs menores. O CD2 codifica uma glicoproteína transmembranar, presente nas células T que actua como uma molécula de adesão e como um transdutor de sinal durante a formação de sinapses imunológica. Existem duas isoformas de mRNA para CD2 humano gerados por APA, diferindo no comprimento da sua 3'-UTR. No entanto, a funcionalidade fisiológica da formação de múltiplas espécies de mRNA de CD2 é ainda desconhecida. Nós mostramos que a sequência 3'-UTR de CD2 apresenta um elevado grau de conservação entre vários mamíferos. A análise da 3'-UTR levou à descoberta de um local de ligação putativo para miR-320 e para várias RBPs a nível da 3'-UTR, incluindo NOVA1, uma proteína caracteristicamente expressa no cérebro. Observou-se que a APA do CD2 na 3'-UTR é dependente de activação de células T, sendo o sinal de poliadenilação proximal é preferencialmente utilizado em células T activadas. Para além disto, tem sido descrita a expressão de moléculas do sistema imunológico em neurónios, mas o seu papel neste sistema é ainda desconhecido. Tendo em conta que o sistema nervoso é semelhante ao sistema imunitário relativamente a muitas propriedades fenomenológicas, funcionais e moleculares, a presença de CD2 no cérebro e o envolvimento de APA na sua expressão, foram investigados. Descobrimos que o CD2 é expresso em cerebelo, córtex, hipocampo e tálamo no cérebro humano. Adicionalmente, verificou-se que os dois mRNAs de CD2 estão presentes no timo e numa linha celular de cérebro diferenciada, no entanto, apenas a isoforma curta do CD2 é produzida na mesma linha celular mas num estado indiferenciado.
Dois modelos de trabalho de APA das isoformas de mRNA do CD2 para os sistemas nervoso e imunológico foram construídos com base nas evidências encontradas.
Introduction
Gene Expression
Gene expression on eukaryotes requires the precise regulation of a series of events during development and differentiation. There are two main levels at which gene expression regulation can occur: transcriptional and post-transcriptional. The transcriptional control involves chromatin remodeling, DNA binding of regulatory proteins and interaction with the transcription machinery, whereas post-transcriptional regulation requires a fine-tuning of pre-mRNA processing, mRNA stability and export, and translation mechanisms. RNA-binding proteins and miRNAs play an essential role on post-transcriptional regulation [1-4].
Transcription control
Eukaryotic genomic DNA is assembled as chromatin in the nucleus and wrapped around an octamer of histones. Histone modifications modulation directly influences the chromatin structure and is critical for gene expression regulation by determining the accessibility of the DNA to be transcribed [5, 6]. DNA hypermethylation is associated with inactive chromatin and transcriptional repression by preventing the binding of RNA polymerase II (Pol II) and transcription factors (TFs) to the promoter. At this stage, if chromatin remodeling occurs and DNA becomes hypomethylated, this enables the binding of Pol II and TFs to the exposed promoter, allowing transcription initiation [7]. This type of epigenetic regulation has been shown to be an important feature for tissue-specific regulation, although in most cases the DNA methylation state and consequently the availability of the chromatin is constant across different cell types [1]. The most basic type of transcriptional control consists in the sequence-specific binding to a promoter of regulatory proteins that may act both as activators, enhancers or silencers [8]. The gene promoter consists of a region that overlaps the transcription start site (TSS) and that has a regulatory proximal region where TFs typically bind. This binding may activate, promote or prevent the transcription of the correspondent gene [1, 8].
Post-transcriptional regulation
The production of mature mRNAs demands several nuclear processes that endow with opportunities for regulation [9]. The production of a functional mRNA molecule requires correct transcription termination coupled with polyadenylation (PA) at the 3’end, and the splicing of introns and ligation of exons [10]. Splicing is accomplished by the spliceosome complex, which is formed by small nuclear ribonucleoprotein particles (snRNPs). Production of different mRNAs and consequently distinct protein isoforms occurs by alternative splicing, which is a highly regulated process that allows the production of several mRNA isoforms and contributes for protein diversity. Alternative splicing has thus a key role on several cellular processes such as cell death, cell growth, development, differentiation and disease, among others [11].
PA is of vital importance in pre-mRNA processing, allowing transcripts export to the cytoplasm and contributing for mRNAs stability and efficient mRNA translation [12]. The molecular mechanisms behind this intricate process are now clear. PA starts with the endonucleolytic cleavage at the pre-mRNA 3’end directed by cis-elements localized upstream and/or downstream of the PAS, U-rich regions and U/GU-rich regions respectively. The AAUAAA sequence is the canonical PAS that is recognized by the 3’-end processing machinery that cleaves the pre-mRNA and extends it by addition of a PA untemplated tail 15-30 nucleotides downstream of the PAS [10, 13, 14]. The core machinery responsible for the correct 3’-end processing consists of four main protein complexes: cleavage and polyadenylation specificity factor (CPSF), cleavage stimulation factor (CstF), cleavage factor (CF) CF Im and CF IIm, plus other associated
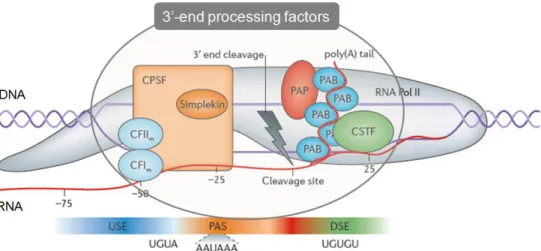
proteins. The CPSF is composed by several subunits and is responsible for recognizing the PAS and catalyzing the cleavage reaction. The CstF complex recognizes U/GU-rich regions located downstream of the PAS [15, 16]. This elaborated 3’-end processing machinery comprises about 25 protein factors and around 60 individual proteins, such as symplekin, PA polymerase (PAP) and PA binding protein (PABP) (Figure 1) [10, 17]. The correct assembly and function of the 3’-end machinery is essential to produce a mature mRNA [10, 18, 19].
Figure 1 | Core pre-mRNA 3’end processing machinery and cis regulatory elements. The two cleavage factors (CF) and CPSF bind to the upstream and to the PAS regions respectively. CstF binds downstream of the PAS, and PAB proteins bind to the PA tail in the pre-mRNA. Adapted from Elkon et al, 2013.
Alternative polyadenylation (APA)
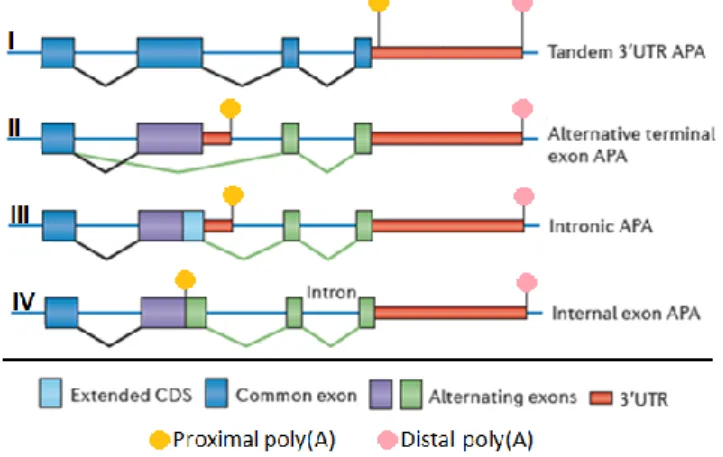
It has been known for some time that one gene may possess multiple PAS, that are used to produce different mRNA isoforms, by a mechanism named alternative polyadenylation [20, 21]. APA thus consists of a major gene expression regulatory mechanism for determining the downstream post-transcriptional fate of a mRNA molecule [20]. APA is recognized as a critical cellular mechanism, playing a direct role in gene regulation and it is now established that APA is not an exception but the rule, as it occurs in over half the human genes [22, 23]. Most genes possess the canonical PAS located at the 3’-UTR, but additional PAS may be present across the mRNA sequence [24]. There are four types of APA regarding the location of the PAS in the mRNA sequence [20]. Cleavage and PA in the 3’-UTR can occur in two different ways: with the PAS being located in tandem in the 3’-UTR or in an alternative terminating exon. A less frequent type of APA is the intronic APA, and even less frequent is the internal exon APA (Figure 2) [14, 15]. Whilst APA has an impact in the production of different proteins [25], when it occurs in the 3’-UTR it also plays a crucial role, tightly regulating gene expression [21, 26].
Genome-wide methodologies have shown that shorter 3’-UTR mRNA transcripts resulting of APA are often associated with cell proliferation and transformation, while longer isoforms are more common in differentiated cells [27-29]. Human primary cells use frequently distal PAS, whereas upon cell activation and in cancer the proximal PAS is more often used, resulting in an overall 3’-UTR shortening [27, 28]. It has been shown that in proliferating cells, such as embryonic and cancer cells, the proximal PAS is more frequently used, because eliminating large parts of the 3’-UTR enables the transcripts to escape miRNA targeting/degradation [28, 29]. In fact, it has been observed that shorter transcripts generally produce higher levels of protein [27, 28].
Figure 2 | Four different mechanisms of APA
depending on the PA sites location. The APA
marked with I corresponds to the simplest form of APA, in which PA sites are located in the same terminal exon. The transcripts produced differ only in the 3’-UTR length, and the protein produced is the same. APA as in shown in II, III and IV may affect the coding region. The situation defined as II in the figure uses PA sites in alternative terminating exons. III uses an intronic PA site and IV involves cleavage in an internal exon. APA II-IV is dependent on splicing. Adapted from Elkon et al., 2013.
RNA-binding proteins (RBPs) and microRNAs (miRNAs)
Two major regulators affecting pre-mRNA processing and metabolism, operating at the 3’-UTR level, are miRNAs and RBPs [20]. These trans-acting factors have a major impact in mRNA expression by interacting with cis-elements located within the 3’-UTR [20, 22].
RBPs - Recent experiments show that RBPs binding sites are enriched in the 3’-UTR regions of the mRNA, between the first and last PA sites, suggesting a clear link between APA and RBPs for gene expression regulation [29, 30]. RBPs associate with mRNAs and are the main players in post-transcriptional control. RBPs are involved in every step linking transcription to translation, determining the fate of the nascent mRNAs: splicing, PA, localization, stability and translation efficiency [31, 32]. Curiously enough, the genome regions encoding for these proteins are among the most conserved in the human genome [33]. In fact, a deregulated production of these proteins or factors required for RBPs assembly in the RNA, or the emergence of mutations, may have severe consequences and cause disease [34]. This arises either by the occurrence of mutations causing pre-mRNA processing, eg, splicing, defects or by RNA gain of function caused by disruption of alternative splicing [34]. An example of cis-acting mutations disrupting splicing is in the spinal muscular atrophy (SMA), a fatal autosomal recessive disorder. In this case, a single nucleotide substitution in the survival of motor neuron 2 (SMN2) gene, located in a splicing signal, is crucial for this disease [35]. Another critical splice change happens when a premature termination codon is inserted in the Clcn1 (a chloride channel) gene, leading to loss of function, and thus causing myotonia (delayed relaxation of the skeletal muscles) [36].
Many RBPs have been characterized for a long time and some of them were shown to have a critical function in PA [37, 38] and APA [39, 40]. More recently, with genome-wide methodologies, the importance of RBPs in APA has been further clarified [41] . The U1 snRNP (U1) protein, better known for its role in splicing, also plays an essential role in APA, specifically in the correct formation of mRNAs 3’ends, by preventing premature cleavage in PAS located in introns [42]. Another study links PTB (polypyrimidine tract binding protein) and PA efficiency in 3’end processing. It was shown in this study that PTB and CstF directly compete for the binding to the U-rich sequence element (USE) upstream of the C2 complement PAS, decreasing gene expression by deficient PA. Hence, when PTB is overexpressed there is a marked reduction in the efficient mRNA 3’end processing, with PTB acting as a negative
regulator [43]. PTB was more recently shown to also regulate pro-thrombin PA, by binding to an USE [44].
One other RBP that has a function in splicing but it is also important in the APA mechanism is SRp20. This protein belongs to the conserved SR protein family and has been shown to affect recognition of an alternative 3’-terminal exon by interacting with a PA factor binding to an APA site. This study was conducted in the gene coding for calcitonin and calcitonin gene-related peptide, whose pre-mRNA is alternatively processed in a tissue-specific manner. In thyroid C cells exon 4 is included, generating an mRNA with four exons and usage of the exon 4 PA site. In neuronal cells the exon 4 is excluded producing an mRNA with 5 exons (1-3 and 5-6) using exon 6 PA site. In this case, if SRp20 is overexpressed, the cells will include exon 4. In thyroid C cells, the addition of a mutant SRp20 form inhibits exon 4 inclusion, because this SRp20 mutant form will inhibit the binding of CstF to the exon 4 PA site preventing cleavage and addition of the PA tail [45].
Some RBPs thus have multiple functions, both in splicing and PA, and the relative cellular concentrations of specific RBPs modulate these pre-mRNA processing mechanisms.
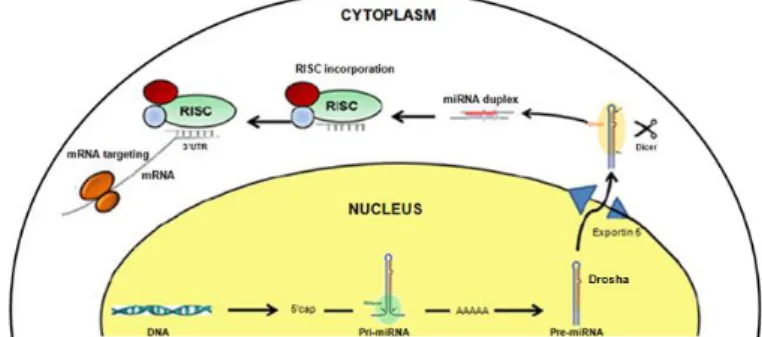
miRNAs - miRNAs have been pointed out as extremely significant elements in post-transcriptional regulation. miRNAs consist of a class of highly conserved small non-coding RNAs of about 23 nt long [46]. miRNAs genes are mostly intronic, although some have been reported to locate in intergenic regions. The miRNAs biogenesis mechanics have been elucidated (Figure 3). miRNAs genes are transcribed in the nucleus by RNA Pol II or RNA Pol III and processed by Drosha. miRNAs are then exported into the cytoplasm, where they undergo further processing by Dicer resulting in an unstable miRNA duplex. Finally the duplex unwinds and one of the strands is incorporated into the RISC complex, becoming functional and targeting the mRNAs molecules [47].
The negative regulation (degradation or silencing) of the mRNA occurs by miRNAs targeting mRNAs. This occurs by 6-8 nt complementarity to recognition sequences that are mainly present in the 3’-UTR. It is estimated that around 30% of the human transcriptome is under miRNA regulation [48].
It is now well established that these small RNA molecules control several physiological and pathological processes, such as development, differentiation, proliferation and cancer cell progression [49, 50]. miRNAs are correlated with human cancers both by aberrant expression and by directly regulating oncogenes or tumor-suppressor genes. For example, a recent study found that miR-320 is significantly downregulated in
prostate cancer and when overexpressed in these cells causes a decrease in tumorigenesis both in vitro and in vivo. This miRNA targets genes of the Wnt/β-catenin pathway decreasing the levels of cancer stem cell markers [50]. Recent evidence shows that miRNA regulation plays a crucial role in overall APA patterns shifts, by degrading longer isoforms, from a normal cellular state to cancer cell transformation state [49].
Figure 3 | miRNAs biogenesis. The primary-miRNA is transcribed in the nucleus, digested by RNAse and processed by Drosha forming the pre-miRNA hairpin precursor. This pre-miRNA is exported by the exportin 5/Ran GTP complex into the cytoplasm, and is processed by Dicer into a miRNA duplex. The unwinding of this duplex and incorporation of one of the miRNA strands into RISC, makes it become functional and able to target mRNA molecules. Adapted from Arora et al. 2013.
APA modulation in different tissues and cell states
Pre-mRNAs can undergo alternative processing according to the development pattern, overall cell state or in a tissue-specific manner resulting in differential gene expression [51, 52]. APA can shape gene activity by altering the resultant protein, stability and localization or translation efficiency of a transcript. This often occurs in a tissue- or developmental stage-specific manner [53, 54].
Most alternative cleavage and PA events vary amid tissues and the majority of tissue-specific APA appears to be species specific, suggesting that the change in PAS choice is conserved in mammals [21, 52]. In fact, recent studies found that tissue-specific APA events are widespread and that human tissues have an overall PA site selection specificity [24, 55]. These different APA patterns have also been characterized in diverse developmental stages and, recently, global APA changes revealed to be associated with certain human diseases [26, 56]. Namely, in cases of dedifferentiation and increased proliferation, overall APA favors a general shortening in the 3’-UTR length [28]. When a gene generates shorter 3’-UTR isoforms through APA this facilitates the deletion of cis regulatory elements that may be targeted by RBP or miRNAs [20].
Recent genome-wide studies revealed that in the brain, nervous system, ovulated oocytes and zygotes, transcripts usually show mRNA 3’-UTR lengthening through APA, unlike what was observed in blood, ovaries, placenta, developing spermatocytes and proliferating T cells, where the tendency is to preferentially use the proximal PA site [20, 24]. A recent study on gene expression analysis determined that the embryonic development is accompanied by the production of transcripts exhibiting longer 3’-UTRs while generation of induced pluripotent stem cells from differentiated cells is marked by an overall shortening of the 3’-UTR [24].
Furthermore, coordinated changes in APA have been detected in specific situations such as T-cell activation and neuronal activity [27, 57].
APA in the nervous system
Long 3’-UTR transcripts are characteristic from the nervous system and brain, reflecting a preferential usage of distal PA sites [54, 58].
One of the first examples of APA modulation was found in the nervous system, more specifically in the brain-derived neurotrophic factor (BDNF) gene, essential for neurons survival. This neurotrophic factor has two PA sites, and generates two transcripts differing in their 3’-UTR length. These transcripts have different translation efficiencies, thus APA provides a precise temporal and spatial control of protein expression within neurons [24, 59].
Another study evaluating the transcriptome produced in hippocampal neurons after membrane depolarization showed a striking shift in the general APA pattern, preferentially producing shorter 3’-UTR transcripts. These transcripts were truncated mRNAs with functions differing from the original full-length isoforms [57].
NOVA2, a RBP characteristically expressed in the brain with a known role in alternative splicing events, has been shown to also participate in APA, favoring longer 3’-UTR isoforms production [60], which indicates that RBPs play roles in both splicing and PA. ELAV, a brain specific RBP, produces the same lengthening effect by repressing cleavage at proximal APA sites [61].
Another interesting aspect of APA in the brain resides in the fact that, according to the latest data, brain-specific APA sites seem to lack in most cases the canonical PAS [56] and thus may be more prone to regulation. Other recent studies show that, in the human brain, gene expression variation mainly occurs in an age-dependent manner, correlating to robust developmental changes [61].
APA in the immune system
APA consists of a common regulatory mechanism in several physiological processes, namely in immune responses [27].
Using genome-wide RNA-Seq methodologies it was shown that upon T cell activation there is a general increased usage of the proximal PA site. Accordingly, mRNAs with seed matches to proliferation-associated T cell miRNAs, show a shortening of their 3’-UTRs suggesting that this could be a mechanism of escaping gene silencing by miRNAs [27]. One of the most well established examples of how APA has a functional role at the immunity level regards B cells, T cells and monocytes. After stimulation of these cells, the increased levels of CstF-64 promoted the usage of weaker, proximal immunoglobulin heavy chain (IgM) PA sites [25]. Regarding CstF-64, it was also shown that plasma B cells exhibited lower levels of this trans-acting protein than those found in their precursors (pre-B cells), causing a different usage of APA signals in the Ig genes [25]. In this case, the production of different transcripts constitutes a cellular- and developmental stage-specific APA mechanism [25].
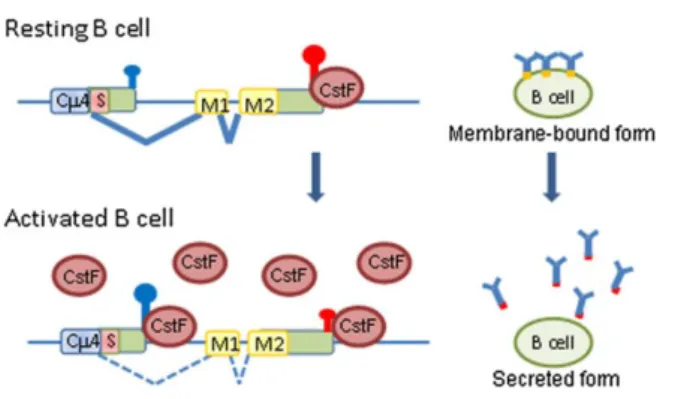
Regarding the IgM heavy chain, there are two mRNA transcripts being produced through alternative processing. One encodes for the secreted form and another for the membrane-bound form and they differ in their 3’ends (Figure 4). APA coupled to alternative splicing regulates the production of one or the other. The secreted form is produced when there is usage of the intronic PA site, favored by increased levels of CstF-64, while the membrane-bound IgM emerges when the cleavage happens at the distal site in plasma cells [24].
Linking cancer and immunity, and more specifically B cells, there is the example of certain mantle cell lymphomas. In this pathological situation a shift in the APA pattern occurs in B cells leading to the shortening of cyclin D1 3’-UTR, possibly enabling its escape from miRNA targeting which in turn results in a cyclin D1 overexpression [28].
Figure 4 | APA in IgM heavy chain. In a resting state, the cell presents regular levels of CstF, favoring the distal PA site. After receiving a stimulus, the cells become activated and have an increased level of CstF which accumulates near the proximal weaker PA site, forcing its usage. The cleavage at this region generates only secreted IgM isoforms. Adapted from Giammartino et al., 2011.
CD2
The main step to develop an adaptive immune response is the binding of the T-cell receptor (TCR)/CD3 exposed on the surface of T lymphocytes to a specific peptide-major histocompatibility (pMHC) complex [62]. This occurs whenever an antigen is presented to T cells by antigen-presenting cells (APCs). Auxiliary signals are needed at this point, being provided by adhesion molecules, namely CD2 and its ligand CD58 [62]. This binding helps to define the distance between membranes and supports T cell activation by facilitating the TCR-pMHC complex interaction. Thus, CD2 plays a critical role in the immunological synapse formation, needed for the emergence of immune responses [63], acting both as an adhesion and as a signaling molecule, initiating an intracellular signaling cascade.
Signaling can be induced by the clusters formed in membrane microdomains, through CD2-CD58 interaction [64]. Thus, CD2 binding increases T cell proliferation and cytokine secretion, in a ZAP70-dependent process [65]. Inhibition of this interaction results in an abortive T cell response. This inhibition is relevant in autoimmune diseases, such as rheumatoid arthritis in which T cells show higher expression levels for CD2 and CD58. Molecules that provide inhibition of this interaction may act as immunosuppressants and monoclonal antibodies (mAbs) against CD2 inhibit T cell activation or adhesion [63] . However, in mice, T cells deficient for CD2 appear to be only mildly affected, suggesting that CD2 may play a somewhat redundant role in T cell activation [64]. Recent studies state that the combined deficiency in co-receptors CD2 and CD28 leads to profound defects in activation and proliferation of T cells [64], while lack of CD28 alone is not able to fully impair T cell functioning. These two molecules seem to set off overlapping, though distinct, initial steps of T cell activation. Both CD2 and CD28 help to span the distance of 15 nm which corresponds to the distance required for the TCR-peptide/MHC complex to be formed [62].
CD2 is a glycoprotein expressed in T cells, thymocytes, NK cells and a subset of thymic B cells. CD2 and its ligand belong to the immune-globulin superfamily (IgSF) surface receptors. These co-receptors’ extracellular domains are comprised of a N-terminal non disulfide bonded Ig variable (V) domain and a membrane-proximal truncated Ig constant-2 (C2) domain containing two intrachain disulfide bonds. Besides the extracellular domain, CD2 contains a transmembrane domain and a cytoplasmic domain [65].
The most important feature of CD2 for this work is the fact that the gene coding for CD2 is able to produce two different mRNA isoforms through APA in the 3’-UTR.
Hence, since CD2 is expressed and has a functional role at the immune synapse, we addressed the question of whether APA is relevant for CD2 expression and if this protein is expressed at the nervous synapse. We investigated if regulation of CD2 expression is tissue-specific, showing different APA patterns in T lymphocytes and in the brain.
Aims
There are three main goals in this project:
Understanding how APA regulates CD2 expression in human primary T cells in a resting vs. activated state.
- In silico analysis for CD2 mRNA and genomic sequences conservation will be evaluated and APA sites and predicted binding sites for microRNAs and RNA-binding proteins (RBPs) in the 3-’UTR of CD2 will be identified
- Mapping the 3’ends in both activated and resting states of T cells by 3’RACE, and perform RT-qPCR to quantitatively evaluate the proximal or distal PA site usage in the two cellular states.
Ascertain if this cluster of differentiation, typically an adaptive immunity molecule, is present in the brain.
- Detection methods will be used, such as RT-PCR and immunohistochemistry to investigate the presence of CD2 in different rat and human brain tissue, and in which neuronal cells CD2 is expressed. Evaluate a possible tissue- and developmental-specific APA in rat thymus (immune system) and brain cells (nervous system).
- 3’RACE will be performed on samples from thymus and a brain cell line in different differentiation states.
Material & Methods
In silico analysis
The UCSC genome browser was accessed to check for APA sites and CD2 mRNA isoforms coding and 3’-UTR sequences. Conservation values were assessed by gathering the sequences retrieved in NCBI nucleotide database using the Geneious v4.8 software [66].
The prediction of putative binding sites for RBPs and miRNAs was determined using the SFmap and micro.org database, respectively. The miRNAmap database was used to confirm expression tissues.Primers were designed in NCBI’s tool Primer-BLAST, and analyzed in the bioinformatic appliance OligoAnalyzer (Integrated DNA Technologies, Inc).
Human PBMCs isolation
Human blood buffy coats were obtained from volunteer blood-donors (Hospital S.João). Peripheral blood mononuclear cells (PBMCs) were extracted using Lympholyte®-H (Cedarlane labs), according to the manufacturer’s instructions. This protocol provides a density gradient separation medium that isolates lymphocytes and monocytes from human peripheral blood. Cells were counted on an automated cell counter (Countess®, Life Technologies).
Human T lymphocytes extraction
The isolated PBMCs were resuspended at approximately 1 x 10⁸ cells/mL. Primary T lymphocytes were extracted from the PBMCs cell suspension using EasySep negative selection kit (STEMCELL technologies). With this kit unwanted cells are recognized by specific antibody complexes which recognize CD14, CD16, CD19, CD20, CD36, CD56, CD66b, CD123 positive cells. Unwanted immunolabelled cells are retained in a specific fraction using magnetic beads while T cells are enriched by separating the desired fraction into a new tube. T cells were counted as previously described and cultured at 1 x 10⁶ cells/mL.
Cell Culture
Cells were grown and maintained in culture at 37 ºC with 5% CO2 atmosphere, at a
concentration between 1 to 2 x 10⁶ cells/mL, in RPMI 1640 medium modified with glutaMAX and phenol red, and supplemented with 10% fetal bovine serum (FBS) and 5% of pen/strep antibiotic (penicillium/streptomycin). All the reagents mentioned are from Gibco®, Life Technologies cell culture.
Primary T lymphocytes were kept in culture for 48 h.
Jurkat T cell line cells were split in a 1:3 ratio every 2-3 days.
Cell Activation
Both primary T cells and Jurkat T cells (1 x 10⁶ cells/mL) were activated with PHA (phytohemagglutinin) in a final concentration of 1 µg/mL, for 48 h. Activated cells were harvested for further RNA extraction.
Wistar rat tissue handling
Fresh rat tissue was obtained from Teresa Summavielle’s laboratory and used immediately for total RNA extraction.
Cryopreserved rat brain sections were obtained from Teresa Summavielle’s laboratory, and processed for immunohistochemistry analysis.
Human tissue handling
Prepared paraffin slides of different human brain sections and fresh-frozen Human brain tissue were obtained from the Medical Research Council (MRC), UK brain bank network. Tissue samples were maitained at - 80 ºC until processing for total RNA extraction.
Total RNA extraction
The total RNA enriched with small RNAs from cell suspensions or tissue samples was extracted using mirVanaTM kit protocol (Ambion, Life Technologies), briefly described below.
For Cell suspensions, primary T lymphocytes and/or Jurkat T cells were counted and 102 to 107 cells were pelleted and further washed in cold PBS 1 x, before proceeding to RNA extraction. Cells were lysed in the lysis/binding buffer, provided in the kit.
For tissue samples approximately 250 mg of tissue was obtained from each sample and the remaining frozen at – 80 ºC. Tissue samples were homogenized in the kit’s lysis/binding buffer using a plastic pestle (brain tissue is very soft, and a plastic pestle is enough to disrupt the tissue).
For organic extraction, lysates (either tissue or cell suspensions), were incubated with a miRNA Homogenate Additive and extracted with one volume of Acid-Phenol:Chloroform to one volume of lysate. The aqueous phase was recovered to continue with the total RNA isolation procedure. 1.25 volumes of 100% ethanol were then added to the samples and mixed thoroughly. This mixture was passed through a filter cartridge and the samples/columns were washed using miRNA wash solution 1. At this point the DNA is removed by performing a DNase (DNase I recombinant, RNase-free, 10 U/ μL, Roche) treatment on column for 15 min. Samples were then washed again with miRNA wash solution1. Another wash step was performed using miRNA solution 2, and flow-through was discarded. RNA was eluted with 100 μL of 95°C pre-heated elution solution.
RNA quantification was performed in a NanoDropTM 1000 Spectrophotometer (Thermo Scientific) and the RNA stored at -80 ºC.
RT-PCR
Reverse transcription reaction
cDNA was prepared using SuperScript III™ Reverse Transcriptase enzyme (Invitrogen, Life Technologies) and 1 μg of total RNA following manufacturer’s guidelines. Shortly, the RNA was denatured for 5 minutes at 65 ºC with 1 μL of dNTPs (10 mM), 1 μL of 50 μM Random Hexamers and Nuclease-free water (Ambion) to a final volume of 14 μL. Samples were placed on ice for another 5 minutes. A reverse transcription mix was prepared with 4 μL of the cDNA synthesis buffer (5x), 1 μL of DTT (0.1 M), 0.5 μL of RNaseOUT™ Recombinant RNase Inhibitor (40 units/μl) and 0.5 μL of SuperScript III RT (200 units/μl, Invitrogen), added to the samples to a final volume of 20 μL and gently mixed. The samples were incubated for 10 minutes at 25 ºC, 60 minutes at 50 ºC and 10 minutes at 70 ºC to inactivate the RT enzyme. Negative reactions, without SuperScript III, were performed to discard genomic DNA contamination. cDNAs were stored at -20 ºC.
PCR
For PCR reactions 2 μL of cDNA was used, with 2 μL of GoTaq buffer (5x), 2 μL of MgCl2 (25 mM), 1 μL dNTPs, 1 μL of each primer (forward and reverse) and 0.2 μL of
GoTaq DNA Polymerase (5 U/ μL, Promega). Initial denaturation was performed at 95 ºC for 2 minutes followed by 30 cycles of: 95 ºC for 1 minute, annealing with each primer pair optimized temperature for 30 seconds (see Table 1) and extension at 72 ºC for 1 minute. Final extension was performed at 72 ºC for 5 minutes. PCR samples were analysed by gel electrophoresis on a 1.5% agarose gel stained with SYBR Safe® (Life Technologies).
Table 1 | Sequences of primers used for PCR reactions.
Target Primer pair Sequence 5’ – 3’
Human CD2 hCD2 F hCD R TCGGAGAAATGATGAGGAGCTG TGCTGGATTCTGAGGGGTTG Human 18S (reference gene) h18S F h18S R GCAGAATCCACGCCAGTACAAGA CCCTCTATGGGCCCGAATCTT Rat CD2 ratCD2 F ratCD2 R CTCCATCAGGCACACAGGTT ATTAGGGGGTGGCAACGAAA Rat YWHAZ (reference gene) ratYWHAZ F ratYWHAZ R GATGAAGCCATTGCTGAACTTG GTCTCCTTGGGTATCCGATGTC
3’RACE
Reverse transcription reaction
cDNA for 3’RACE reaction was prepared as described above, using SuperScript III enzyme (Invitrogen) and 1 μg of total RNA following manufacturer’s guidelines. However, during the denaturation step at 65 ºC, 1 μL of 10 μM oligonucleotide Adaptor Primer (AP) was added to the reaction. Everything else was done as mentioned before for the reverse transcription reaction in RT-PCR reaction.
3’RACE
This reaction was performed using 2 μL of cDNA, 1 μL forward primer (10 μM), 1 μL of Anchor primer (10 μM), 1 μL of dNTPs (10 mM), 10 μL of Phusion HF Buffer (5x), 0.5 μL of PhusionTM Hot Start polymerase (2 U/μL, New England Biolabs) and
Nuclease-free water to a final volume of 50 μL. Initial denaturation was performed at 98 ºC for 30 seconds, followed by 35 cycles performed with the following temperatures: 15 seconds at 98 ºC (denaturation), 20 sec for annealing (temperature specific for each primer pair, see Table 2) and 30 seconds at 72 ºC for extension. Final extension step was performed at 72 ºC for 7 minutes. 3’RACE reactions were analyzed by gel electrophoresis on a 1.5% agarose gel like mentioned above (see RT-PCR method). The interest bands were cut from the agarose gel and the DNA purified with the QIAquick Gel Extraction kit (Qiagen), according to manufacturer’s instructions. DNA quantification was performed in a NanoDropTM 1000 Spectrophotometer (Thermo Scientific).
Table 2 | Sequences of primers used for 3’RACE reactions.
Target Primer Sequence 5’ – 3’
Human CD2 hCD2 F AGACAAGAGCCCACAGA Rat CD2 ratCD2 F 1 ratCD2 F 2 GTCAACTGTCCAGAGAAAGGTC CTCCATCAGGCACACAGGTT Oligo (dT)
Adaptor primer AP GACCACGCGTATCGATGTCGACTTTTTTTTTTTTTTTTVN
Cloning into TOPO® vector
DNA obtained from the gel extraction was prepared for TOPO® TA Cloning Reaction (Invitrogen, Life Technologies). First, dATPs were added to the purified DNA in a mixture of 15 μL DNA, 2 μL dATPs (10 mM), 8 μL GoTaq buffer (5x), 8 μL MgCl2 (25
mM), 0.4 μL GoTaq enzyme and Nuclease-free water to a final volume of 40 μL. Reaction of dATPs addiction was performed at 72 ºC for 10 minutes. PCR product was then purified using QIAquick PCR Purification kit (Qiagen) and DNA was eluted in nuclease-free water. Cloning was performed using TOPO® TA Cloning kit (Invitrogen, Life Technologies), with a mixture of 5 μL DNA, 0.5 μL vector and 0.5 μL of salt solution, incubated for 20 minutes at room temperature (RT).
Transformation of competent bacteria
For transformation, 5 μL of the TOPO-cloning reaction were mixed with 50 μL of TOP10 chemically competent E.coli (Invitrogen, Life Technologies). Cells were incubated on ice for 10 minutes and then incubated at 42 ºC for 1 minute (heat shock) and put back on ice for 5-10 minutes. 200 μL of LB medium were added and cells incubated for at least 30 minutes at 37 ºC in an orbital shaker. The cells were plated and grown in LB plates with kanamicin (100 μg/mL) at 37 ºC, overnight (ON). The colonies were then screened by colony PCR analysis.
Colony PCR
For colony PCR, at least 16 colonies were chosen for analysis. Each colony was immediately incubated in the PCR mixture (1 μL of M13 F and M13 R primers, 0.5 μL dNTPs (10 mM), 2 μL MgCl2 (25 mM), 2 μL GoTaq Buffer (5x), and 0.06 μL of GoTaq
DNA Polymerase (5 U/μL, Promega), and nuclease-free water to a final volume of 10 μL. Initial denaturation was carried for 5 minutes at 95 ºC, followed by 30 cycles with 30 seconds at 95 ºC (denaturation), 30 seconds at 55 ºC (annealing) and 2 minutes at 72 ºC (extension). Final extension was performed at 72 ºC for 5 minutes. After incubation in the PCR mixture, the selected colonies were streaked to a LB agar plate with kanamicin and incubated at 37 ºC ON. Colony PCR products were analyzed in an agarose gel, and the confirmed positive were selected. The positive plated colonies were scrapped and incubated in 3 mL of LB medium supplemented with kanamicin (100 μg/mL) and grown in an orbital shaker incubator at 37ºC ON.
Mini-preps (QIAprep® Miniprep, Qiagen) of the selected positive clones were prepared according to manufacturer’s guidelines and plasmid DNA sent for sequencing.
Table 3 | Sequences of primers used for colony PCR.
Target Primer Sequence 5’ – 3’
M13 M13 F M13 R
AGCATCAAATGGCGTGGAGA AGCATCAAATGGCGTGGAGA
Real-time qPCR
For quantification of CD2 mRNA isoforms the standard curve method was performed. First, a standard curve with 10-fold serial dilutions of cDNA was created to evaluate and optimize primer pair efficiency. For this reaction 2 μl of cDNA diluted at least three times was analyzed by real-time PCR (1 μl of each primer (10 pmol), 2 μl of cDNA, 10 μl of iQ SYBR green supermix (BioRad), and nuclease-free water to a final volume of 20 μl. Experiments were quantitated by the comparative CT method (2∆Ct) to evaluate overall expression levels. To access the ratio between both mRNA CD2 isoforms a variant of this expression was applied consisting of 2∆Ct CD2 total /2∆Ct CD2 pA2.
Northern blot analysis
Premade Northern blot (BD Biosciences, Clontech), containing approximately 2 μl of polyA+ RNA per lane from different rat tissues was initially prehybridized for 2 hours and then hybridized in Prehybridization/Hybridization buffer (Ambion) for 18 hours at 42 ºC with a CD2 full length specific probe. The blot was washed with decreasing concentrations of saline-sodium citrate (SSC). First wash solution with 0.01 % SDS and the other solutions with 0.1% SDS. Finally the membrane was exposed to an autoradiography X-ray film (Kodak) and intensifying screen at -80 ºC for labelled RNA visualization. The levels of CD2 mRNA were normalised to the levels of β-actin mRNA retrieved with a β-actin specific probe.
Antibodies
Monoclonal antibodies used were OX34 (IgG2a) (Jefferies et al 1985, JEM 162) or OX54 (IgG1) (Clark 1988, JEM 167), both recognizing rat CD2, for human CD2 recognition the monoclonal antibody used was RFT11 (Royal Free Hospital, London, U.K). As negative control antibodies OKT3 (IgG2a) (Hoffman 1980, PNAS 77) against human CD3, and OX21 (IgG1) reacting to Human C3b inactivactor (Hsiung 1982, Biochem J 203).
Protein extraction for western blot analysis
All procedures were performed at 4 ºC. Cortex, cerebellum, striatum and hippocampus were homogenized in dissection buffer (50 mM Tris-acetate, pH 7.4, 10% sucrose, 5 mM EDTA and 1 mM PMSF, a serine protease inhibitor), the homogenate was centrifuged at 800 x g for 20 minutes, and the supernatant recovered and centrifuged at 16,000 x g for 30 minutes. The pellet obtained was resuspended in Triton X-100 lysis buffer (10 mM Tris-Cl pH 7.4, 150 mM NaCl, 1 mM EDTA, 1 mg/ mL BSA, 1 mM PMSF and 1% Triton X-100) and kept on ice for 30 minute to ensure full lysis. Following a centrifugation at 11,000 x g for 10 minutes, the supernatant was recovered. Protein lysates were quantified using Bradford’s Bio-Rad Colorimetric Protein Assay (Bio-Rad) according to the manufacturer’s instructions. Briefly the protein levels in our samples were determined by measuring the OD595 nm of a colorimetric reaction between an
acidic dye and our protein solution. The comparison a calibration curved with pre-made BSA standards allows for determination of the protein concentration. Protein lysates were stored at -80ºC until Western Blot analysis.
SDS-PAGE (PolyAcrilamid Gel Eletrophoresis)
Protein lysates were separated by SDS-PAGE using discontinuous 3% (stacking) and 10% (separating) polyacrilamid gels. The separating-gel solution was prepared with 10% acrylamid/bisacrylamid (30:0.8), 1.5 M Tris-Cl pH 8.8, 10% SDS, 10% APS and 0.1% TEMED, and the stacking-gel solution with 3% acrylamid/bisacrylamid, 1 M Tris-Cl pH 6.8, 10% SDS, 10% APS and 0.2% TEMED. APS and TEMED were only added just before gel casting. For gel casting, first the separating gel was added and covered with a ddH2O layer until complete polymerization (approximately 45 minutes). After
polymerization of separating gel the ddH2O layer was removed, the stacking solution
gel was added, the comb placed and the gel allowed to polymerize for about 15 minutes. After removing the comb, running buffer (25 mM Tris-Cl, 192 mM glycine and 0,1% SDS) was added to the chamber and the gel loaded with 24 L of each sample, with the same amount of protein, and non-reducing buffer (0.5 M Tris-Cl pH 6.8, 5% SDS, 20% glycerol and 0.05% bromophenol blue). Samples were previously boiled for 5 minutes. The gel ran for 1 hour and 10 minutes at 150 Volts (V).
Western blot
Proteins were transferred (transfer buffer composed by 25 mM Tris-Cl, 192 mM glycin and 20% methanol, pH 8.3) to the nitrocellulose membranes Hybond C-extra (Amersham, GE Life Sciences) for 1 hour at 100 V, 4º C in a Mini Trans-Blot (Bio-Rad) apparatus. The membrane was removed and molecular weight markers were indicated. The membrane was incubated in a TBS-T solution (20 mM Tris-Cl, 137 mM NaCl, 0.1% Tween 20, pH 7.6) with 5 % powder milk for 1 hour, washed for 15 minutes, and washed again twice for 5 minutes, agitating in a TBS-T solution. The primary antibody diluted in TBS-T was added and was left incubated at room temperature for 1 hour, agitating. Membrane was washed again and the secondary diluted antibody (1:50000 goat anti-mouse-HRP in TBS-T) was added and incubated for 1 hour. Membrane was washed as before. Excess washing buffer was discarded and the membrane put in a cling-film mixed with a solution in a ratio of 40:1 of the detection solutions A and B from ECL Plus kit (Amersham, GE Life Sciences) for 5 minutes. Membrane was transferred to a new cling-film sheet and put on an exposing cassette. The film was exposed under red light for a few seconds.
Brain sections immunohistochemistry
Cryopreserved wistar rat brain sectionsBrain sections were washed four times with PBS to remove the cryoprotection solution. The UltraVision Detection System Anti-Polyvalent, HRP/DAB (ThermoScientific) was used. Briefly, after washing, the samples were incubated in a hydrogen peroxide 3% solution for 15 minutes to reduce non-specific background and washed three times with PBS. Ultra V Block reagent was applied and sections were left incubating for 5 minutes at room temperature and a 2% BSA solution was applied for 1 hour to block nonspecific background staining. The BSA solution was then removed and sections were incubated with the primary antibody for 2 hours and then washed four times in PBS. Next, the Biotinylated Goat Anti-Polyvalent component was applied and incubated for 10 minutes, at which point another four washes with PBS were done. Then Streptavidin-Peroxidase was applied and incubated for 10 minutes, washing again after this incubation period. 1-2 drops of DAB Chromogen was added to 1 mL of DAB Substrate and mixed agitating, and finally applied to the brain sections left incubating for 5 minutes. After another PBS wash, the sections were transferred to gelatinized slides where they were left drying out for 6 hours at 4 ºC. Finally the slides were assembled with permanent mounting medium (Histomount, National Diagnostics).
Human brain paraffin slides
Paraffin slides were incubated at 60 ºC for 30 minutes, after this time the slides were subjected to depparaffinazation/rehydration by being submersed in xylene for 5 minutes twice, then in absolute ethanol for 5 minutes as well, decreasing the ethanol concentration; in 96% ethanol for 3 minutes twice, and 5 minutes in 70% ethanol. The slides were then rehydrated in ddH2O and the antigen retrieval was performed
incubating the slides in citrate buffer (10 mM, pH 6) for 1 hour in a water bath at 100 ºC. Slides were left cooling at RT for about 20 minutes and then washed with TBS-T (50 mM Tris, 150 mM NaCl, 0.05% Tween 20, pH 8.4) for 1 minute. The slides were cleaned, not allowing the tissues to dry, and the samples were delimited with a PAP pen (abcam ab2601). Staining was performed using UltraVision Detection System Anti-Polyvalent, HRP/DAB (ThermoScientific) like mentioned for cryopreserved wistar rat brain sections. For dehydration, slides were washed in increasing ethanol concentrations (70%, 96%, 100%) for 3 minutes and then washed in xylene twice for 1 minute. To finish, coverslips were mounted with DPX Mounting Medium (Leica, Biosystems).
Results
Human CD2 mRNA has two different APA sites in the
3’-UTR
and putative binding sites for RBPs and miRNAs
CD2 encodes a transmembrane glycoprotein present mostly in T cells, acting both as an adhesion molecule and as an activating signal transducer during the immunological synapse formation [64, 67]. To identify putative CD2 PA sites in the 3’-UTR a bioinformatic analyses for the CD2 3’-UTR was performed, using the UCSC Genome database (genome.ucsc.edu/ ), detecting the presence of two PA sites (Figure 1).
Figure 1 | Predicted PA sites for human CD2. A. The scheme represents the location at the chromosome level and genomic sequence of human CD2. The red bar represents the region where CD2 gene is located, in chromosome one. The genomic sequence encoding for this protein is 14,766 bp long. Under the schematic representation of the chromosome, black boxes represent exons (5 exons) and the space in between exons corresponds to introns. The narrow black box at the end represents the 3’-UTR. Two predicted PA sites are depicted in purple surrounded by a blue rectangle. Adapted from UCSC Genome Bioinformatics. B. Schematic representation of CD2 mRNA isoforms, with different 3’-UTR Lengths. I. Short CD2 mRNA isoform II. Long CD2 mRNA isoform.
To evaluate the presence of trans-acting factors potentially binding to CD2 3’-UTR, two other bioinformatic tools were utilized. Putative binding sites for RBPs were predicted using SFmap (sfmap.technion.ac.il/), which consists of a computational tool able to map RBPs predicted to bind to the sequence inserted. In this case, only the 3’-UTR sequence was inserted because the goal is to understand if there are any RBPs regulating the PAS usage in the 3’-UTR. Three RBPs possessing putative binding sites were identified with a high score in CD2 3’-UTR: hnRNP F, SRp20 and NOVA1 (Figure 4).
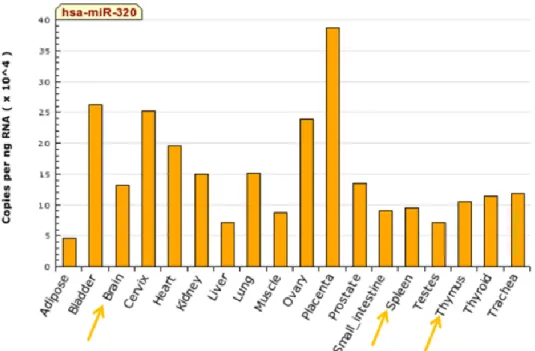
Finally, putative miRNAs targeting CD2 3’-UTR were unveiled using microRNA.org, a site that provides knowledge on predicted miRNAs targets, with experimentally observed expression patterns. We found miR-128, miR-544, miR-137, miR-216b and miR320 as potential miRNAs targeting CD2 3’-UTR (Figure 2). After retrieving the putative miRNAs targeting CD2 3’-UTR, it was important to evaluate the pattern of expression of these miRNAs, thus miRNAs expressed in brain and T cells were selected, as these were our models of study, using miRNAMap database (Figure 3). miR-320 was selected as a miRNA of interest to study in CD2 regulation, because although it is widely expressed in several tissues and cells, it is the only miRNA from those previously identified that is expressed in both T and nervous cells. Moreover, miR-320 potentially targets only the longer 3’-UTR, leading to the question of whether CD2 APA has a role in CD2 miR-320 silencing.
After gathering this data a schematic representation of CD2 3’-UTR was made, highlighting the two PA sites and putative binding sites for RBPs - Srp20, NOVA1 and hnRNP F and a miRNA - miR-320 (Figure 4).
Figure 2 | Predicted miRNAs targeting CD2 3’-UTR. Representation of CD2 3’-UTR mRNA sequence 445 nt long. The
two PA sites are underlined with a red outline (AAUAAA) and possibly targeting miRNAs are shown on top of the sequence. Adapted from microRNA.org.
Figure 3 | miRNA-320 expression profile. Expression pattern for miR-320 in human tissues, through real-time PCR. From the miRNAs depicted in Figure 2, only miR-320 is expressed in both in T cells (thymus and spleen) and in the brain. Adapted from miRNAmap.mbc.nctu.edu.tw/ .
Figure 4 | CD2 3’-UTR sequence. 3’-UTR sequence of CD2 cDNA, showing two canonical PAS (AATAAA) in red, and
the respective cleavage sites marked by a darker red arrow. In purple, yellow and green boxes are identified putative binding sites for hnRNP F, NOVA1 and SRp20, respectively. In blue the potential miR-320 targeting region.
CD2 mRNA isoforms are conserved in several mammal species
To further underline the importance of these APA sites and putative binding sites for trans-acting factors, CD2 mRNA sequence conservation was evaluated. CD2 mRNA sequences from several different mammalian species were gathered from NCBI nucleotide database (ncbi.nlm.nih.gov/nuccore). Sequence alignments were performed using the default settings of MUSCLE 3.6 running in Geneious v4.8 [66].
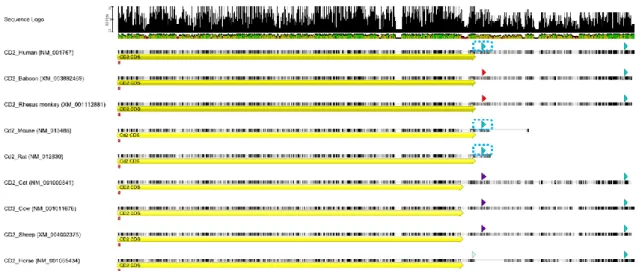
CD2 mRNA coding and 3’-UTR sequence present a high level of conservation among several mammals, revealing a 70,9% pairwise percent identity value for the CD2 sequence including its 3’-UTR (Figure 5). The proximal pA1 signal (AAUAAA) is the canonical signal, conserved in human, mouse and rat, however the distal pA2 signal was not annotated in rodents.
Figure 5 | CD2 mRNA sequence alignment in several mammals. CD2 mRNA coding (yellow long arrow) and 3’-UTR sequence conservation among several mammals, revealing a 70,9% pairwise percent identity value. Blue arrows surrounded with a blue dashed line identify the proximal pA1 signal (AAUAAA), which is conserved in human, mouse and rat. The downstream blue arrows present in every sequence except for the CD2 mRNA sequence in rodents, highlight the distal pA2 signal, conserved in all other mammal species depicted.
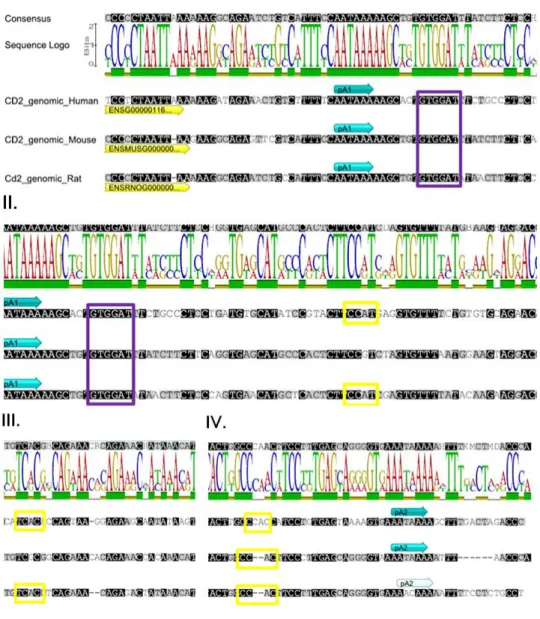
The genomic 3’-UTR sequences from rodents and human, including the proximal and distal PAS, were aligned and the overall 3’-UTR sequence of CD2 was shown to be conserved. The high level of conservation is reflected in a 66,2% of pairwise percent identity and 53,2% of identity. The three aligned sequences showed a conserved proximal pA1 signal (AATAAA) while the pA2 signal was only conserved in human and mouse (AATAAA) but not in rat (AACAAA) (Figure 6). Furthermore, two possible CD2 transcripts with different 3’-UTR lengths were found for the different species in NCBI nucleotide database. Taken together, these results suggest that CD2 might be subjected to APA in the 3’-UTR, originating two mRNA of different 3’-UTR lengths.
Interestingly, this analysis also revealed that hnRNP F putative binding sites are also conserved (Figure 6 I) and that some level of conservation is present in the potential NOVA1 binding sites (Figure 6 II, II, IV).
Figure 6 | Close-up on genomic alignment for CD2 3’-UTR sequences (human, mouse and rat). I. 3’-UTR
sequence showing the proximal conserved pA1 signal (blue arrow, AATAAA) and a putative binding site for hnRNP F (purple box, GTGGAT). II. and III. 3’-UTR sequence presenting two conserved putative binding sites in human and rat for NOVA1 (yellow boxes, CCAT [II.] and TCAC [III.]). IV. 3’-UTR sequence depicting a putative binding site for NOVA1 (yellow box, CCAC) and the predicted pA2 signal (blue arrow, AATAAA). The rat genomic sequence shows a weaker PAS (light blue arrow, AACAAA). Adapted from Geneious software.
Human primary T lymphocytes express two CD2 mRNAs
differing in their 3’-UTR lengths
CD2 expression in human T lymphocytes may be regulated by several so far unexplored pre-mRNA processing mechanisms. CD2 may undergo APA, since in humans two possible CD2 transcripts with 3’-UTR lengths of about 70 and 440 nt were found in the UCSC genome database (see Figure 1), with the shorter transcript containing a canonical PAS upstream of the predicted cleavage site and the longer transcript possessing another canonical PA site. To determine which of these isoforms are expressed in human primary T cells subjected to different conditions and map their 3’ends we performed 3’RACE analyses (position of RACE forward primer is depicted in Figure 7).
Figure 7 | Schematic representation of CD2 mRNAs. I. CD2 longer mRNA depicting five exons in the coding region, two PAS and respective cleavage sites at the 3’-UTR. II. CD2 shorter mRNA isoform, showing the location of the primer pair for 3’RACE analysis. Forward primer located at the beginning of the 5th
exon and reverse primer binding to the PA tail. III. CD2 longer mRNA isoform, with the respective primer pair used for 3’RACE. The primer pair used is the same for mapping both isoforms.
We kept human primary T cells isolated from PBMCs from healthy donors in culture for 48 h in two different conditions: resting and activated with PHA (phytohaemagglutinin). Figure 8 shows a representative experiment: in resting and activated primary T lymphocytes both CD2 transcripts were clearly identified, with 370 and 750 nt, as expected for the proximal and distal PAS, respectively.
Figure 8 | CD2 products of a 3’RACE reaction for primary human T lymphocytes. The first
lane corresponds to the DNA ladder, with molecular weights in base pairs (bp). The other two lanes correspond to resting and activated human primary T cells, showing both two CD2 mRNA isoforms. The short isoform is about 370 bp and the long isoform is about 740 bp. Primer pair used in this reaction is depicted in Figure 7.
The amplicons obtained were confirmed by sequencing, and the mRNA 3’ends mapped (Figure 9). We found that, in both resting and activated states, human T cells express two CD2 mRNAs with 3’-UTRs of different lengths, due to APA.
Figure 9 | Mapping of CD2 PAS in the 3’-UTR. Sequencing results for CD2 3’RACE products. After cloning the
3’RACE products illustrated in Figure 8, the plasmids were sequenced using a forward primer located near the 3’end of exon 5 (light blue box). The short CD2 mRNA isoform uses the proximal PAS (in bold, colored red) located 23 nt downstream of the coding region and is cleaved for PA tail addition 40 nt downstream. The long CD2 mRNA isoform uses the pA2 signal and is cleaved for PA tail addition 12 nt downstream.
CD2 proximal PAS is preferentially used upon T cell activation
Previous studies have unveiled a global mRNA shortening upon activation of T lymphocytes in mice [27].
To determine if in humans the choice of the PAS of CD2 was affected by the cell activation state, and since the 3’RACE technique is not quantitative, we analyzed the expression levels of the two CD2 mRNA isoforms in human primary T lymphocytes and in a Jurkat T cell line, both in a resting and activated (with PHA) states by RT-qPCR. Two specific primer pairs were designed as depicted in Figure 10.
Figure 10 | Scheme of primer pairs used in RT-qPCR analyses. I. CD2 mRNA sequence depicting five exons in the coding region, two PAS and respective cleavage sites at the 3’-UTR. II. Short CD2 mRNA isoform is amplified by the primer pair located at the terminal exon (exon 5). III. Long CD2 mRNA isoform will be amplified by both the primer pair designed for the coding region and by the primer pair designed at the 3’-UTR. The primer pair in the coding region will hence amplify both mRNA isoforms, while the primer pair located at the 3’-UTR will amplify only the long isoform.
We started by comparing the overall CD2 expression levels in human primary T cells and the Jurkat cell line by RT-qPCR, using the primer pair located at the terminal exon (indicated as Total in Figure 11), in resting (R) and activated (A) states. This primer pair quantifies both CD2 mRNAs, ie, total CD2. It is clear that CD2 mRNA is present in much higher levels in primary T cells when compared to values obtained from the T cell line (Figure 11, compare levels of Total CD2 mRNA in A and B). We then quantified the levels of expression for the longer CD2 mRNA. In Jurkat cells, there is a very low expression level for the longer isoform in a resting state. We can also observe that upon activation with PHA, there is a slight increase in CD2 mRNA levels, while the longer isoform is less produced (Figure 11 B). This effect is not observed for human