www.scielo.br/rbg
THE GPR METHOD APPLIED TO ARCHEOLOGY IN THE CITY OF GURUPÁ-BRAZIL
Karolina Almeida Correia
1, Marcos Welby da Silva
1and Fernando Marques
2ABSTRACT.In this work we used the GPR method to investigate new archaeological areas in the Gurupá, Brazil, in order to identify and locate artifacts of a population who occupied the archipelago of Marajó before the arrival of the European colonizers. The GPR profiles were acquired on three areas: the Fort of Santo Antônio de Gurupá, the Jacupi Site, and the quilombola community of Gurupá-Miri. The GPR data analysis presented here enabled the identification of a discontinuous pattern that possibly is related to an old trench that surrounded the Fort of Santo Antônio de Gurupá in the 19th century. On the Jacupi Site and in the quilombola community of Gurupá-Miri shallow anomalies were identified and these anomalies may be associated with point objects such as pots, ceramics, and funeral urns. Although the archaeological activities were already initiated in these locations, the method served as an a priori investigation for the excavation process, and it is impossible to confirm the anomalies in the Jacupi Site and in the Gurupá-Miri area before the end of the excavation process.
Keywords: GPR (Ground Penetration Radar), archaeology, Gurupá city.
RESUMO.Este trabalho foi realizado utilizando o radar de penetração do solo como ferramenta para identificar feições arqueológicas no município de Gurupá no oeste do Pará, com o intuito de contribuir e facilitar as prospecções arqueológicas na região. As sondagens de GPR (Ground Penetration Radar) se concentraram em três áreas de levantamento, no Forte de Santo Antônio de Gurupá, no Sítio Jacupi e em Gurupá-Miri. Com a análise dos dados de GPR foi possível identificar um padrão descontínuo associado ao fosso (trincheira) em volta do Forte de Santo Antônio de Gurupá, no Sítio Jacupi, enquanto em Gurupá-Miri foram identificadas anomalias rasas que podem estar associadas a objetos pontuais como vasilhas, cacos de cerâmica e urnas funerárias. Embora as atividades arqueológicas tenham sido iniciadas no local, o método serviu para uma investigação a priori antes do processo de escavação, e até o final deste trabalho não é possível confirmar as anomalias no sítio de Jacupi e Gurupá-Miri.
Palavras-chave: GPR (Radar de penetração de solo), arqueologia, Gurupá.
1Universidade Federal do Pará, Programa de Pós-Graduação em Geofísica-CPGf, Rua Augusto Corrêa, 01, Belém, PA, Brazil – E-mails: [email protected],
INTRODUCTION
Since the 19th century the archipelago of Marajó (PA) has been a reference for studies of Amazonian people who inhabited the region long before the European colonization. Archaeological researches indicate that material remains of millenary cultures can still be found and studied in this region (Pinho & Santos, 2014).
The application of geophysical studies for mapping and delimiting sites of interest in archaeological work areas contributes to better research planning and to lower costs related to excavations of possible subsurface targets.
Several near surface geophysical methods are available to the Archaeologist. Among them, the Ground Penetrating Radar (GPR) has been used in many archaeological areas, because it generates fast and reliable target location with low survey costs.
The first works of geophysics applied to archeology in the Amazon that have been registered were realized in 1977 in the Island of the Marajó (Alves, 1979). In these studies the surveys were of correlated electrical and electromagnetic methods. In the year 1999, Barradas et al. (1999) carried out a survey on the site PA-JO-49 Cacoal, located in Ananás, Marajó Island, Pará. The applied methodology consisted of acquisitions magnetic and electromagnetic (GPR), with the objective of identifying sites for excavation archaeological The magnetic method presented satisfactory results, due to the clay composition of the targets investigated. The GPR results provided the approximate depth and extent of the anomalies identified by the magnetic method, however, the results presented were considered unsatisfactory and it is concluded that only the use of GPR would not be enough to identify anomalies in the study area, thus showing that only the application of the GPR method may not be sufficient to obtain good interpretations of the study area.
Souza (2012) has applied the GPR method to archaeological surveys in two areas: the Faciola Palacete in Belém (Pará, Brazil) and the Port of Cargill in Santarém (Pará, Brazil). The GPR results indicated target locations for future excavations. The radargram analysis identified shallow anomalous zones that could be associated with the archaeological features sought in these areas, as well as other underground geological structures. The method presented, with great resolution, the location of archaeological fragments, and it was able to delimit the basis of the geological structures (that were identified by hummocky reflections on the radargrams).
Fernandes (2015) used the ground penetration radar method to locate and map funeral urns. The research aimed
at guiding the archaeological excavations and assisting the protection procedures of archaeological sites in the region of direct influence of the Dardanelos hydroelectric project, near Aripuana (Mato Grosso, Brazil). The 3D analysis performed from the 2D reflection profiles provided a clear differentiation between the targets of interest and tree roots from their different signatures. Anomalies generated by roots usually are elongated, whereas anomalies attributed to archaeological artifacts usually present point patterns.
The GPR method and inductive electromagnetic results that Rodrigues et al. (2009) used to explore three archaeological sites of shells located between Laguna and Jaguaruna cities of the southern coast of Santa Catarina, Brazil, allowed the identification of anomalous regions related to point targets, as well as continuous targets, correlated with the shell structure. In addition to this applied study, GPR numerical modeling was used to evaluate the performance of the method in relation to the materials found in that environment, as well as to aid in the interpretation of the actual results.
Aragão (2006) used GPR, magnetometry, and scintillometry at the archaeological sites called Bittencourt, Jambuaçu and Jaburu, that are respectively located in Abaetetuba, Moju and Almeirim, which are municipalities in the Brazilian state of Pará. The magnetic measurements were used to indicate the sites for excavation, and the GPR profiles were used to confirm the anomalies detected by the magnetic measurements. The scintillation data were used to map the soils composed by the Anthropogenic Black Earth (ABE). The work resulted in the discovery of archaeological ceramics.
Continuing the work with applications of GPR to archaeological research in the state of Pará, Brazil, this paper describes the surveys acquired in the region of Gurupá. The objective is to identify pre-colonial artifacts and constructions in the subsurface. For this purpose, two surveys were carried out at the sites Fort of Santo Antônio de Gurupá, Jacupi Site, and the quilombola community of Gurupá-Miri which were selected as areas of study by the Museu Paraense Emílio Goeldi.
LOCATION AND CHARACTERIZATION OF THE STUDY AREA
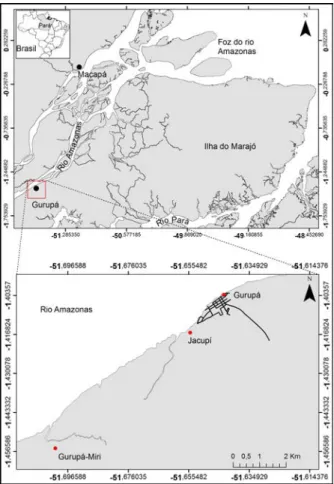
Gurupá is located at the confluence of the Xingu River with the Amazon River Delta, between two important cultural areas of the Amazon in the pre-colonial period: Santarém and Marajó (Fig. 1). The region has an area of 8,540 km2and a population of about
of Afuá, to the south by the municipalities of Melgaço and Porto de Moz, to the east by the cities of Afuá, Breves and Melgaço, and to the west by the Amapá state.
Historiographical documentation and archaeological research over the years have shown that these locations have great potential for discoveries of archaeological remains. These remains traces date back to a significant history, whose evidences are the on-site archeological heritage (for example, the pre-colonial and colonial sites, the reminiscent of more recent occupations, the Fort of the Gurupá, quilombos, the Jewish cemeteries, etc.), the memories, and the oral stories related to the culture and the local history (Iphan, 2001).
Figure 1 – Location of GPR data surveys in the Gurupá and adjacent regions.
Historical documents reporting on European occupations in the area include information on the Fort of Santo Antônio de Gurupá (Fig. 2), located in the region of Gurupá. Its construction was initiated by the Dutch when the region was not yet completely under Portuguese control, at a time when trade between Europeans and natives still existed. The beginnings of the history of the natives contact with populations of foreign
countries characterize the strong European flow in Gurupá in the colonial times (Iphan, 2001).
In the archaeological research, information provided by the residents of the sites can be of great importance for the characterization of the changes in the area’s constructions over time. In the case of Gurupá, older residents reported the possible existence of an enclosing moat (trench) around the Fort, which is a characteristic of the Dutch constructions. The application of Georadar described here intended to locate the reported structure and also to find more evidence of human occupation around the Fort.
The Jacupi Site is located at the Jacupi environmental reserve delimited by the Jacupi stream and the Amazon river located in the urban area of the city of Gurupá (Fig. 3). This place was indicated by several residents as an old village where signs of human remains have been found in funerary urns as pointed out excavations prior to geophysical surveys indicating the presence of ceramic artifacts in subsurface (Fig. 4). The site is located in a region of high ABE content which suggests intense human occupation. Based on this information, this area was classified as a potential zone for future excavations and for exploratory GPR surveys in order to confirm and delimit small areas of archeological interest (Schann & Martins, 2010).
Located at approximately 7.8 km from the center of Gurupá, the village of Gurupá-Miri is a quilombola remnant community. It is positioned at an elevated dry land area with dark soil (possibly Anthropogenic Black Earth). This place is much altered by the construction of houses, school, church, community shed, gardens (Fig. 5), and by the actual earth removal for the opening of a branch road that leads to the communities of Axiquara and Maria Ribeira 1 and 2 (Schann & Martins, 2010). In this community was reported a discarding area of shells, which - as informed by the dwellers - can either be 10 remnants of the first quilombos inhabitants occupation or the apex of a partially exposed conch or sambaqui. It is relevant mentioning that shellfish and sambaquis were found in both Catre and Melgaço (Schann & Martins, 2010).
METHODOLOGY Field Acquisition
The first survey occurred on July 9 and 12, 2015, and the measurements were taken in the Jacupi Site and at the Fort of Santo Antônio de Gurupá that is located in the center of the city.
Seven profiles were acquired at the Fort of Santo Antônio de Gurupá: three outside the fortress, each 21 m long, and four inside the structure, each with 8 m in length.
Figure 2 – The Fort of Santo Antônio de Gurupá, where data acquisitions were
carried out. Notice that the survey was performed inside and outside the Fort (Source: Schann & Martins, 2010).
Figure 3 – Area at the Jacupi Site investigated by the GPR method.
Figure 4 – Excavation located at the Jacupi Site in one of the areas with high
concentrations of Anthropogenic Black Earth.
Figure 5 – The main church located in the center of the quilombola community
of Gurupá-Miri evidencing the human constructions around the site.
In the Jacupi Site, nineteen parallel profiles were performed. The first seventeen profiles are 60 m in length each, except for Profiles 3, 4 and 5 that were acquired from the end of the domestic trench. The remaining two profiles are 35 m in length due to irregularities in the area as exemplified in Figure 6a.
The second survey was performed between September 6 and 9, 2016. The data were acquired on the of Gurupá-Miri village area as shown in Figure 6b. The sixty-five profiles acquired at this locality were distributed in nine different size areas.
To guarantee that a survey presents satisfactory results in archaeological applications, it is necessary to appropriately establish the acquisition parameters (such as the antenna frequency, sampling time, and profile spacing) according to the local geology and by observing how the GPR signal behaves in the medium.
Methods
The GPR (Ground Penetration Radar) is an electromagnetic method that uses electromagnetic waves at predefined frequencies that vary from 10 to 2500 MHz to locate structures, geological features or subsurface buried objects.
The GPR electromagnetic method that uses high frequencies consists on the principle of transmission and reflection of electromagnetic waves. In order to collect GPR data, the radar antennas are placed on the surface with the same spacing between each other along parallel profiles, which results in images that displays the lateral variations of the electromagnetic properties of the materials in subsurface (Annan, 1993).
Electromagnetic methods generally have low resolution. However, among these, GPR allows better imaging of the subsurface thus ensuring a good interpretation besides the
(a) (b)
Figure 6 – (a) Arrangement and orientation of the GPR data acquisition profiles measured at the Jacupi Site (b) Distribution of areas around the village of Gurupá-Miri
where the GPR data were collected. In yellow, it can be seen the area excavated to rescue the urn 1 containing human remains.
advantage of the surveys being fast and easy to carry out. These facts, together with the non-invasive nature of the method, make GPR widely used in investigations, such as studies on historical heritage sites and archaeological sites (Nuzzo et al., 2009).
The applicability of GPR to archaeological surveys, however, is compromised by some factors such as the geoarchaeological characteristics of the study area, the process of data acquisition and processing. To circumvent these factors is necessary to carry out an acquisition planning, establish processing steps and criteria for mapping the data according to the research objective (Orlando, 2007).
In all acquisitions, the armored bistatic 400 MHz antenna was used along with the SIR-3000 system produced by the Geophysical Survey Systems, Inc. (GSSI). The survey was perfomerd in common offset. The range used on the Jacupi Site and on the Gurupá-Miri area was 80 ns and the one used on the Fort Santo Antônio de Gurupá was 100 ns. After the acquisition of the GPR sections, the data were processed using the software Reflexw-Win7.0 following the processing routine listed below:
1. Interpolation of horizontal marks: normalizes the horizontal scale of the profile collected in time mode Messinger (2004);
2. Static Correction (Set time zero): eliminates the effect of the right wave and time zero correction. This processing step is applied in order to perform the null-time adjustment with the depth and correct for the terrain topography (Lima, 2006);
3. Manual Gain Application in Y direction: allows you to manually define a gain curve in the Y (time) direction and apply this curve on each point of each collected data trace (Furtado, 2009). Gain functions generally compensate for the effects of radar signal attenuation by improving the visualization of deeper structures; 4. 1D Filters, BandPass Frequency and BandPass
Butterworth: filters that eliminate low- and
high-frequency noise consequently improving the signal-to-noise ratio and contributing to facilitate the identification of subsurface targets (Fernandes, 2015). The Dewow filter, can eliminate much of the low frequencies associated with the saturation of the recording system, which is related to the large amplitudes of direct waves present in the air and on the surface. For this purpose, the window interval should be adjusted to approximately the size of the main pulse (wavelet) through the direct wave, which can be visualized in wiggle window (Sandmeier, 2011);
5. Fk-Filter: used to attenuate noise from inclined reflectors and emphasize dipping reflectors of interest. Its application involves the generation of fk-spectrum, which is achieved by performing the Fourier Transform on the data from the time-space domain.
On studying the electromagnetic methods, it is necessary to know the constitutive relations that determine the characteristics
of the subsurface materials causing anomalies in the natural electric and magnetic fields and that can quantify the physical properties known as electrical permittivity (ε), conductivity(σ)
and magnetic permeability (µ).
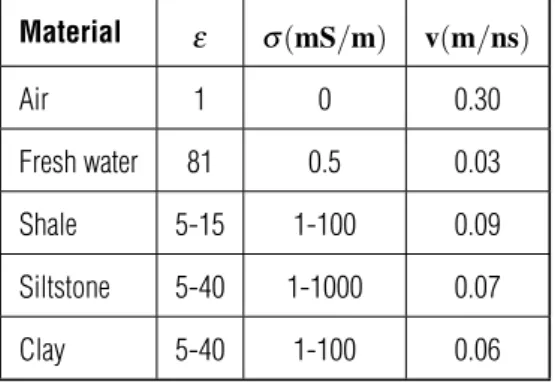
Table 1 – Permittivity relative, electrical conductivity and the electromagnetic
wave velocity for geological materials adapted from Annan (2001).
Material ε σ(mS/m) v(m/ns) Air 1 0 0.30 Fresh water 81 0.5 0.03 Shale 5-15 1-100 0.09 Siltstone 5-40 1-1000 0.07 Clay 5-40 1-100 0.06
Initially, the electromagnetic wave propagates with the speed of light (that is 0.3m/ns) but soon after it penetrates the ground its speed decreases due to its dependence on the constitutive relations that are, in turn, related to the mentioned physical properties. However, of these three properties, only the Electrical Conductivity and the Electrical Permissiveness control this speed. Then, the electromagnetic wave velocity of propagation is a function of these two properties and can be computed through the following expression:
v=√c
εr
, (1)
whereεr = εε0 therefore ε is Electrical Permittivity andε0 =
8.85410−12F/m and c = 0.3m/ns
In this work, the environment average velocity is 0.09 m/ns for both the Jacupi Site and the Fort of the city while for Gurupá-Miri the average velocity was approximately 0.07 m/ns. This velocity difference can be explained by the presence of less weathered Black Soil and by the greater human disturbance in the Jacupi Site and some areas of the Fort. In the Gurupá-Miri, the TPA layer has already been completely eroded because of human actions in the center of the village and most of the soil superficial layer is composed of clayey-sandy sediments Figure 7. Both velocities were estimated from the superposition of the hyperboles found in the profiles acquired in the surveys. Using the software Reflexw-Win7.0, after the analysis of the hyperboles, it was possible to convert the GPR section time-axis into a depth-axis. The GPR estimated velocity
values are corroborated by the approximate velocity values of the propagation environment shown in Table 1.
RESULTS AND DISCUSSIONS Jacupi Site
Of all the acquired profiles only five stood out because the acquisition lines were under Black Soil mounds, which are generally associated with anthropogenic occupation. These profiles are the ones analyzed here and are named Profile 1, Profile 3, Profile 8, Profile 12, and Profile 15. From these profiles, as well as Fernandes (2015) work, three important patterns in the radargrams were observed for archeological applications:
a. the valley-type: generally related to cavities filled with sediments;
b. discontinuities: caused by the interruption of horizontal layer continuity;
c. hyperbolic patterns: indicate the presence of point objects. To provide a better interpretation of the radargrams, the a priori information is of fundamental importance. As already said, in the area of the Jacupi Site there is a thick layer of TPA (Anthropogenic Black Soil) followed by a silvery-yellowish silt. This lithology is confirmed by a trench in the site as shown in Figure 8. Based on that information, it can be stated that the sought anomalies are concentrated in the shallow zone of the profiles.
Profile 1 is 60 meters long. In the positions between 28 m and 34 m (Fig. 9) it is noticeable the concentration of hyperbolic anomalous patterns that reach up to 80 cm in depth. This pattern is characteristic of the subsurface point objects presence. From the depth of 90 cm and further, the GPR signal begins to attenuate due to the layer of clayey-sandy sediments. At a depth of 1.6 m a reflector of strong contrast with the medium begins to stand out. It may be associated with massive concretions of lateritic rocks.
Starting from the trench end, Profile 3 is 44 m long and presents intense hyperbolic patterns at the positions of 30 m and 32 m at a depth of 60 cm. Relating this profile to Profile 1, it is noticeable that both anomalous zones appear in the same position range, that is, between 28 m and 34 m which indicates a lateral continuity of the anomaly (Fig. 10).
With a length of 60 m, Profile 8 presents chaotic and hyperbolic patterns in the position range from 10 m to 14 m at a depth of 60 cm. The chaotic patterns may indicate discard zones
Figure 7 – Excavation of the funeral urn in the center of the village of
Gurupá-Miri, it is perceive the yellowish coloration of the soil where the TPA layer has already been completely extinguished.
Figure 8 – Trench in the Jacupi Site and the lithology variation of the area.
while the hyperbolic patterns may represent the presence of point objects in subsurface (Fig. 11).
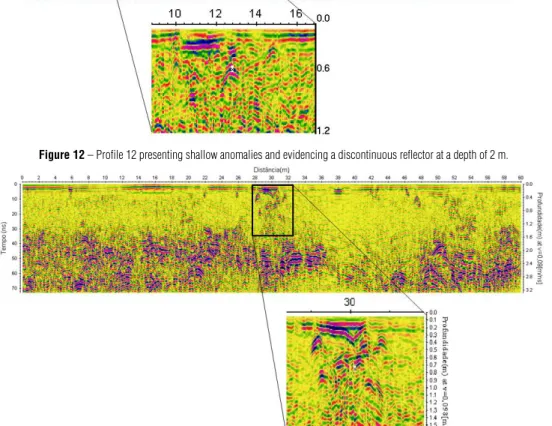
A strong horizontal shallow reflector was identified in Profile 12, which is also 60 m long, in the positions between 10 m and 12 m just below a depth of 60 cm. Profile 12 also presents a discontinuous reflector at a depth of 2 m (Fig. 12). In the other profiles this reflector is continuous.
In Profile 15 (Fig. 13), which is also 60 m long, a superficial anomaly of the valley-type pattern is present at the positions between 28 m and 32 m at a depth of 1 m. This anomaly may be associated with humid-filled cavities.
Profile 1 and Profile 15 are 15 m apart from each other and the analysis of the radargrams indicates that the reflector seen in Profile 1 at a depth of 1.6 m appears at shallower depths (approximately in 1.2 m) from the North to the South direction.
Fort of Santo Antônio de Gurupá
In the Fort area, seven profiles were acquired. Three of them are 21 m long each and were acquired outside the Fort while the other four profiles are 8 m in length each and were acquired inside the Fort. The purpose of acquiring GPR data outside the Fort was to image lithological patterns that could be associated with the moat (trench) reported by the local dwellers. According to them, the moat was enclosing the wall that surrounded the Fort in the nineteenth century. For this objective, the best profile to analyze is Profile 1 (the external part) because it was performed in the direction perpendicular to the wall structure, i.e, perpendicularly to the trench. The wall remains can still be seen on the street leading to the Fort (Fig. 14).
With 21 meters in length, Profile 1, displayed in Figure 15, presents a discontinuity in color in the positions between 4 and 8 m at a depth of 1.5 m and anomalies of chaotic patterns in the distance of 11.5 m, approximately. The anomalies of chaotic
patterns may be related to the concentration of what possibly is the remainder of the surrounding wall of the Fort.
The discontinuity in color present in Profile 1 may be associated with the reported moat. To confirm the continuity of this anomaly, a second profile named Profile 2 (Fig.16) was performed parallel to Profile 1. As result, in Profile 2 was observed the same discontinuity between 4 and 8 m at the same depth described for Profile 1 and the same anomalous pattern for the rest of the surrounding wall.
Gurupá-Miri
For the Gurupá-Miri area, the processed radargrams are the most homogeneous GPR signal of this work. This can be explained by the sediment-content of the soil in which the profiles were performed. In the village, the soil is composed by a more compacted layer of clayey-sandy sediments than the sediments of the first layer in Jacupi, for example, that is composed by TPA. As mentioned before, the sixty-five profiles acquired at this locality were distributed in nine different size areas. Here, only the profiles that present interesting anomalies from the archeological point of view are described and displayed.
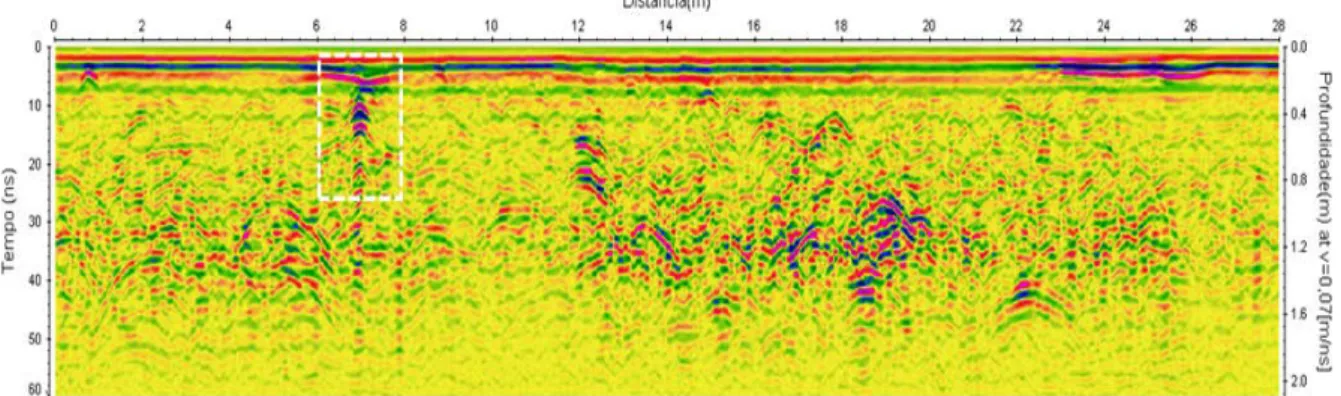
In Area 1, Profile 1 has 16 m in length and presents hyperbolic and of the valley-type anomalous patterns in the distance between 3 m and 5 m at a depth of 70 cm as shown in Figure 17. Possible hyperbolic anomalies can be seen at the end of the profile between the positions 13 and 16 m in shallow depths. A small spot at the end of the profile at a depth of 20 cm was also highlighted because of the archeological interest in this area.
In Area 2, Profile 5 and 6 stood out. Profile 5 is 7 m in length and shows some superficial hyperbolic perturbations in the distances from 0 to 1 m, 3 to 4 m and in the distance of 5 m. These perturbations may indicate the presence of point artifacts as
Figure 9 – Profile 1 acquired in the Jacupi Site highlighting the shallow anomalies of the valley-type.
Figure 10 – Profile 3 showing the same anomalous hyperbolic pattern that appears in Profile 1.
Figure 12 – Profile 12 presenting shallow anomalies and evidencing a discontinuous reflector at a depth of 2 m.
Figure 13 – Profile 15 highlighting anomalous valley-type patterns, which may be associated with a cavity filled with humus.
can be observed in Figure 18. Additionally, this profile presents spot reflectors with significant contrast between the distances of 6 m and 7 m. In Profile 6, the presence of a reflector is noticeable. Besides that, there is an anomaly that seems to be hyperbolic in the distances between 1.5 m and 3 m but changes in shape for deeper depths, approximately 1.7 m. Moreover, in the beginning of the section it can be noticed an anomaly of the valley-type pattern and a hyperbolic anomaly at the position 6 m. It is important to state that Area 2 is near to a house where, according to the local residents, there were several mounds filled with oysters and shellfish (these areas are called by archeologists as material disposal zones). The residents also reported that these mounds are outcropping.
Figure 15 – Profile 1 performed in the external area of the Fort of Santo Antônio
de Gurupá evidencing the discontinuities associated with the reported moat and the wall remains in subsurface.
Figure 16 – Profile 2 made in the external area of the Fort also evidencing the
continuity of the discontinuity present in Profile 1.
Figure 17 – Profile 1 is 16 m long and is located at Area 1 in Gurupá-Miri. The
present valley-type anomalies are highlighted.
Figure 18 – Profile 5 is 7 m long, located at Area 2, and shows hyperbolic
patterns and subsurface disturbances associated to deposits of shells and anthropogenic material.
Figure 19 – Profile 6 placed in Area 2 is 7 m in length and presents shallow
anomalies of the valley-type, hyperbolic anomalies, and an anomaly that begins superficially in position 3 m but turned out to be associated in depth with some other type of striking pattern.
In Area 4, Profile 4 that is 27 m long presents several superficial hyperbolic anomalous patterns which may be interpreted as several point objects in subsurface. These anomalies are seen in this profile at the distances between 9 m and 18 m. A pipe characteristic anomaly was identified at the distance of 21 m and at a depth of 1 m. This profile is shown in Figure 20. In Area 6, Profile 4 is 27 m long and shows discontinuities and hyperbolic anomalies in the distance between 1 m and 4 m from shallow depths till depths that reach up to 90 cm (shown in Fig. 21). These anomalies may be related to agglomerations of point objects.
Another interesting profile is Profile 1 in Area 7 shown in Figure 22. In this profile, it can be observed shallow anomalies of the valley-type at the distance of 8 m, approximately, that may be interpreted as the presence of cavities in subsurface. In the end of this profile, starting at the position 23 m, it is noticeable a color contrast in relation to the colors of the rest of the radargram. This color contrast was associated with the presence of grass on the surveyed area.
CONCLUSIONS
Based on the presented GPR sections, it was possible to identify several anomalous patterns of interest for the archaeological study in the Gurupá and adjacent areas.
In the Jacupi Site, the radargrams exhibit two anomalous patterns: the hyperbolic and the valley-type. These patterns may be associated with the presence of punctual artifacts and/or sediment-filled cavities in subsurface, which in turn are related to anthropogenic activity.
The radargrams performed on the Santo Antônio de Gurupá Fort, presented a lateral discontinuity that may be associated to the trench that enclosed the wall surrounding the Fort built by the
Figure 20 – Profile 4 located in Area 4 is 24 m long and shows a set of shallow hyperbolic patterns and anomalies that may be associated with pipes or lateritic
concretions, but because they were not in the range of interest for archeology they were discarded in the interpretation.
Figure 21 – Profile 4 is 27 m long, placed in Area 6, and shows a shallow anomaly of the hyperbolic type together with superficial discontinuities in the positions
between 2 and 4 meters.
Figure 22 – Profile 1 of Area 7 highlighting anomalies of the valley-type and the effect of grass on the radargram.
Dutch in the 19th century, which may be a confirmation of the story reported by the local residents.
In the Gurupá-Miri community, unlikely the results acquired for the above described areas, the GPR signal pattern was sort of homogeneous because the profiles were acquired on a compact sandy-clayey layer. These GPR profiles results together with
the dwellers reports indicate a great potential for archeological exploration in the region. Shallow anomalies were identified in the radargrams performed in the area the local residents reported as an ancient discard area for shells and scraps of seafood. Although these indications seem to be enough evidence of the previous existence of this discard area, these shallow anomalies
may also be associated to the various building constructions near the area. Even analyzing the radargrams without considering their anomalous patterns related to the region pipelines, it still is not possible to state to what the shallow anomalies are really associated to.
Therefore, the GPR archeological application on the Jacupi Site, the Fort of Santo Antônio de Guarupá, and the Gurupá-Miri areas proved to be efficient in identifying regions of high potential for presenting, in subsurface, remains related to the anthropogenic activities of the ancient Amazonian population.
ACKNOWLEDGMENTS
The authors would like to thank the ”OCA” Project for providing conditions for the performance of the data collection, the Department of Geophysics of Universidade Federal do Pará for providing the GPR equipment used in this research, and finally to the professors, researchers, students, and all the local citizens who participated and assisted this research surveys.
REFERENCES
ALVES JGV. 1979. Métodos aplicados à arqueologia no estado do Pará. Master’s dissertation. Programa de Pós-graduação em Geofísica. Universidade Federal do Pará. Belém, Pará, Brazil. 64 pp.
ANNAN AP. 1993. Pratical Processing of GPR data. In: Proceedings of Second Government Workshop on Ground Penetrating Radar. Columbus. Ohio. 26 pp.
ANNAN AP. 2001. Ground Penetrating Radar. Workshops notes in Canada Sensors & Software. 33 pp.
ARAGÃO RC. 2006. Metodologia Geofísica aplicada a pesquisa de Salvamento arqueológico nos sítios Bittencourt, Jambuaçu e Jaburu, Estado do Pará. Master’s dissertation. Universidade Federal do Pará. Brazil. 60 pp.
BARRADAS JA, SCHAAN DP & LUIZ JG. 1999. Magnetic and GPR survey to identify archaeological features on Cacoal site, Anajás river, Marajó Island, Pará, Brazil. In: 6th International Congress of the Brazilian Geophysical Society. Rio de Janeiro, Brazil.
FERNANDES I. 2015. Investigações GPR em apoio a arqueologia pré-histórica na área de influência do aproveitamento hidrelétrico de Dardanelos-MT. Master’s dissertation. Instituto de Astronomia, Geofísica - Universidade de São Paulo. Brazil. 161 pp.
FURTADO CQ. 2009. Processamento e Modelagem de dados de GPR utilizando o Reflexw 4.5. Faculdade de Geofísica. Trabalho de Conclusão de Curso. Universidade Federal do Pará. Brazil. 27 pp.
IPHAN. 2001. Report of research implemented in the municipality of Gurupa carried out by the OCA. Technical report. Institute of National Historical and Artistic Heritage.
LIMA R. 2006. Otimização de Perfis de Reflexão de GPR sobre Manilhas de Concreto e Tubulações de PVC no Sítio de Geofísica Rasa no IAG/USP. Master’s dissertation. Instituto de Astronomia e Ciências Atmosféricas-Universidade de São Paulo. Brazil. 130 pp.
MESSINGER J. 2004. Effective automatic picking of traveltime data with precision. In: 10th International Conference on Ground Penetrating Radar. The Netherlands, IEEE. 4 pp.
NUZZO L, LEUCCI G & NEGRI S. 2009. GPR, ERT and Magnetic Investigations inside the Martyrium of St Philip. Hierapolis, Turkey. Archaeological Prospection, 16(13): 177–192.
ORLANDO L. 2007. Georadar data collection, anomaly shape and archaeological interpretation – a case study from central Italy. Journal Archaeological Prospection, 14(3): 213–225.
PINHO U & SANTOS J. 2014. Sítio arqueológico em Gurupá revela novidades sobre ocupação milenar. Available on: <http://www.museu-goeldi.br/portal/content/s-tio-arqueol-gico-em-gurup-revela-novidades-sobre-ocupa-o-milenar>. Access on: September, 2016.
RODRIGUES S, PORSANI JL, SANTOS VRN, DEBLASIS PAD & GIANNINI PCF. 2009. GPR and inductive electromagnetic surveys applied in three coastal sambaqui (shell mounds) archaeological sites in Santa Catarina state, South Brazil. Journal of Archaeological Science, 36: 2081–2088.
SANDMEIER KJ. 2011. Manual of software Reflexw. version 6.0, Karlsruhe, Germany. 543 pp.
SCHANN DP & MARTINS CP. 2010. Muito além dos Campos -Arqueologia e História na Amazonia Marajoara. Belém - Pará, Brazil: GKNORONHA. 120 pp.
SOUZA DM. 2012. GPR aplicado à arqueologia nas áreas do Porto da Cargill (Santarém/PA) e no Palacete Facíola (Belém/PA). Master’s dissertation. Programa de Pós-Graduação em Geofísica, Instituto de Geociências, Universidade Federal do Pará. Brazil. 61 pp.
Recebido em 20 outubro, 2018 / Aceito em 20 dezembro, 2018 Received on October 18, 2018 / Accepted on December 20, 2018