(Annals of the Brazilian Academy of Sciences) ISSN 0001-3765
www.scielo.br/aabc
Genetic diversity of the sunflower caterpillar
(
Chlosyne lacinia saundersii
Doubleday and Hewitson)
(Lepidoptera: Nymphalidae) populations determined
by molecular RAPD markers
FABIANE CUNHA1, DANIEL R. SOSA GÓMEZ2, JOSE J. DA SILVA2, TALITA M. ALEXANDRE1 and FLÁVIO MOSCARDI3
1Pós-Graduação em Entomologia, UFPR, Embrapa Soja, Laboratório de Patologia de Insetos
Caixa Postal 231, 86001-970 Londrina, PR, Brasil
2Embrapa Soja, Laboratório de Patologia de Insetos, Caixa Postal 231, 86001-970 Londrina, PR, Brasil 3Universidade Estadual de Londrina – Departamento de Agronomia Laboratório de Controle Microbiano de Insetos
Caixa Postal 6001, 86051-990 Londrina, PR, Brasil
Manuscript received on September 17, 2009; accepted for publication on September 17, 2010
ABSTRACT
Chlosyne lacinia saundersiiis one of the most important pests of sunflower and it is the main target of insecticides applications. Larvae were collected in Londrina (PR), Santa Maria (RS), Dourados (MS), Ribeirão Preto (SP), Brasília (DF), Barreiras (BA), Uberaba (MG) and Vilhena (RO). Genomic DNA was extracted and amplified with ten-mer primers, which produced 101 loci. The size of the RAPD amplicons ranged from 180 to 2564 bp. Polymorphism among populations ranged from 31% to 67%, with the highest polymorphisms of 57% and 67% being detected in Uberaba and Vilhena populations, respectively. Populations with the highest similarity determined with Dice coefficient were from Ribeirão Preto and Barreiras, while insects from Londrina showed the highest similarity among them. Gene flow ofC. lacinia saundersii1.1 was lower than those previously observed for the noctuidAnticarsia gemmatalisHübner, suggesting thatC. lacinia saundersiipopulations are more isolated than the ones of this noctuid. Through the Analysis of Molecular Variance (AMOVA), RAPD variance was 33.64% among geographical populations and 66.36% within populations. These results suggest that populations ofC. lacinia saundersiiare genetically structured.
Key words:amova, gene flow, molecular marker, sunflower pest.
INTRODUCTION
The sunflower caterpillar Chlosyne lacinia saundersii
Doubleday and Hewitson (1849) (Lepidoptera: Nym-phalidae), a Neotropical species, is the main sunflower defoliator in Brazil (Ungaro 1981, Nakano et al. 1981, Gallo et al. 2002). It was first cited in Brazil by Ma-ranhão (1945), in Piracicaba, SP, being further found in other states, as Paraná (Silva et al. 1968, Moscardi 1983, G.L. Villas Boas et al., unpublished data) Rio de Janeiro (Silva et al. 1968), Mato Grosso do Sul (Boiça Jr. et al.
Correspondence to: Flávio Moscardi E-mail: [email protected]
1984) and São Paulo (Silva et al. 1968, Boiça Jr. et al. 1984). Depending on the infestation level, larvae may cause up to 100% defoliation (Nakano et al. 1981). The literature onC. lacinia saundersiiis scanty and most of
the papers is related to controlling this insect with chem-ical insecticides, with very few studies on its biology and ecology and none on the genetic structure of populations of this, insect. Papers related to genetic aspects are re-stricted to the genetics of color variation in larvae ofC. lacinia saundersii(Gorodenski 1969), while Neck et al.
Rica reported that the larva of C. lacinia saundersiiis
polimorphic, with coloration ranging from black to or-ange. In Brazil, Gallo et al. (2002) described the larva of C. lacinia saundersii as of black coloration, while
Zucchi et al. (1993) described the larva as orange in color and covered with black scoli and setae. As this in-sect is an agricultural pest and considering the sunflower expansion (from 77.000 ha to 94.000 ha. i.e., 22.1%) (Lazzaroto et al. 2005) in the last six years in Brazil, it has a favorable habitat in terms of food resources, which can make possible the increase in the genetic flow thus, reducing the genetic differentiation. Therefore, studies related to the population genetics would be important for the development of management strategies mainly in species that faced changes in their habitats (Lougheed et al. 2000).
In the present study we have chosen, among the available molecular techniques, to use the RAPD (Ran-dom Amplified Polymorphic DNA), as it identifies the DNA polymorphism amplified at random through the use of a sole initiator of arbitrary sequence without pre-vious knowledge of the species genome moreover this technique is of reduced cost (Williams et al. 1990). Al-though this technique results in amplification of ran-dom sequences, several authors have demonstrated its efficiency to ditinguish genotypes in insect populations (eg. Carvalho and Vieira 2001, Oliveira et al. 2002, Lopes-da-Silva et al. 2004). Considering thatC. lacinia saundersiiis an insect of distinct geographical and
cli-matic conditions, this study aimed to evaluate the intra and interspecific genetic variation in this insect, which can contribute to the development of proper strategies for the integrated management of this pest.
MATERIALS AND METHODS
INSECTCOLLECTION
Second to fourth-instar C. lacinia saundersii larvae were collected in eight Brazilian states, (Table I). Col-lections were made from December 2007 to June 2008 in sunflowers or in other host plants and sent to the Lab-oratory of Entomology of Embrapa Soja, Londrina, PR, Brazil. Larvae were kept in environmental chambers (FANEM, model 347 CDG, São Paulo, SP) at 26◦C±
1◦C. 65%±5% UR, and 12h of photophase), and
mon-itored to record for the occurrence of parasitoids and entomopathogens. Last instar larvae were placed in 15 mL sealed plastic vials containing dehydrated sil-ica gel, which were maintained at –15◦C for further
DNA extraction. Thirty larvae were used for each popu-lation, being 10 of the nigra, 10 of the bicolor, and 10 of the rufa coloration.
DNA EXTRACTION
The DNA was extracted according to the protocol of Rogers and Bendich (1988), with few modifications. The extraction was made from the larval head to avoid a possible contamination with parasitoids in the larval hemocele (D.R. Sosa Gómez, unpublished data). Each sample was macerated in 480μl of extraction buffer
at a final concentration of 200mM Tris-HCl (pH 8.0), 70mM EDTA, 2M NaCl, and 1% β-Mercaptoethanol.
After addition of 120μl of cetyltrimethyl ammonium
bromide 10%, the samples were kept at 65◦C for 5 min.
Then, 6μl of Proteinase K (10 mg/ml) was added and
the samples were incubated at 65◦C for 60 min. After
that the samples were kept at environment temperature and centrifuged at 16.000 rpm for 15 min. The super-natant (500μl) was transferred to another
microcentri-fuge tube and added to it the same volume of chloro-phorm/isoamyl alcool (24:1).
After homogenization, each sample was centri-fuged at 16.000 rpm for 15 min and, then, the aqueous phase (400μl) was transferred to another tube where
the nucleic acids were precipitated with the same vol-ume of cold isopropanol plus 45% of the volvol-ume of am-monium acetate (10M). DNA samples were mixed by gently shaking the tube and kept at –20◦C for 2 h at
–4◦C overnight. The samples were, then, centrifuged at
14.000 rpm for 15 min, discarding the supernatant and washing the pellets with 300μL of cold ethanol 70%.
The pellets were dry, with the tubes inverted, in environ-ment temperature for 10 min, being, then, re-suspended with 100.8μl of RNAse solution (40μg/ml) plus TE.
After that, the tubes were placed in an environmental chambers from 30 min to 2 h for RNA degradation. Aliquots of DNA were kept at –15◦C and defrost when
needed for DNA amplification.
TABLE I
Data onChlosyne lacinia saundersiicollection sites.
Site Host Plant Date Coordinates
Barreiras – BA Helianthus annuus 11/06/2008 12◦07′29 79′′S 44◦59′14 59′′O Brasília – DF Tithonia diversifolia 10/03/2008 15◦43′43 76′′S 47◦53′58 61′′O Dourados – MS Parthenium hysterophorus 18/01/2008 22◦16′59 06′′S 54◦49′18 06′′O Londrina – PR Helianthus annuus 13/12/2007 23◦11′29 74′′S 51◦10′59 93′′O Ribeirão Preto – SP Tithonia diversifolia 30/04/2008 21◦10′12 18′′S 47◦50′51 55′′O Santa Maria – RS Helianthus annuus 31/01/2008 29◦43′41 34′′S 53◦44′40 89′′O Uberaba – MG Helianthus annuus 10/03/2008 19◦29′54 64′′S 48◦02′19 10′′O Vilhena – RO Oryza sativa 05/05/2008 12◦07′24 85′′S 60◦17′24 71′′O
USA), and its integrity was evaluated through electro-phoresis in agarosis 0.8% gel and colored with 10 mg/ml of ethidium bromide. The electrophoresis was conduc-ted with buffer of 10mM of NaOH and pH adjusconduc-ted to 8.5 with boric acid (Brody and Kern 2004). The DNA was visualized and the image was digitalized using a transluminator with a system of image capture L-PIX – ST and L-PIX IMAGE 7.1M Pixel. Images were cap-tured with the software L-PIX IMAGE 1.0.1 (Loccus Biotecnologia, São Paulo – SP).
RAPD REACTIONS
The amplification reactions were conducted in a vol-ume of 25μl containing about 9ηg of DNA, Milli Q
sterile water, buffer 10×, 0.4μM of primer, 2.4 mM of
MgCl2, 0.1mM of dNTP and Taq polymerase enzyme
(Gibco BRE) (1U). The independent control of the re-actions was conducted without the template DNA, when the amplification reaction with each primer was done. The primers that did not produce clear amplification were not considered in the analysis. The PCR was done using a thermocycler PTC 200 DNA Engine™ (MJ Research, Scientific Support, Hayward, CA) 3.8 ver-sion, with the following program: 45 cycles at 94◦C
for 15 sec, 39◦C for 30 sec, and 72◦C for 1 min, and
a final extension of 72◦C for 7 min. With a volume
of 25μl, the product of RAPD was submitted to
elec-trophoresis in agarose 1.3% and buffer SB 1× at 120 volts. The Lambda DNA, digested with the endonucle-asesEcoRI,HindIII andBamHI, was used as a marker
of molecular weight. The gels were colored with 4.5μl
of ethidium bromide at mg/ml, and the image digital-ized by the system previously described.
DATAANALYSIS
Digital photos from gels were visually analyzed depict-ing the presence (1) and absence (0) of amplified bands with the different primers, assuming the occurrence of two allels per locus. Only conspicuous and consistent bands, as well as their absence, were considered to gen-erate the binary matrix. The similarity among samples was calculated using the Dice Coefficient by the for-mula 2h/(a+b), being “h” the number of observed bands and “a+b” the total number considering presence and absence of bands (Dice 1945). This matrix was submit-ted to cluster analysis using the unweighsubmit-ted pair-group method with aritmetic mean (UPGMA). The procedures were conducted through the program NTSYSpc 2.01 of Numerical Taxonomy (Rohlf 2000). To verify the fit-ness between the similarity matrix and the obtained den-drogram, the coefficient of cophenetic (r) was calcu-lated according to Sokal and Rohlf (1962). The statisti-cal stability of the groupings was estimated by the boot-strap analysis, with 1.000 replications, using the com-puter program Applied Maths Bionumerics (1998).
The structure of the populations was determined by the analysis of variance for molecular data (AMOVA) by using the program Arlequin (Schneider et al. 2000).
RESULTS
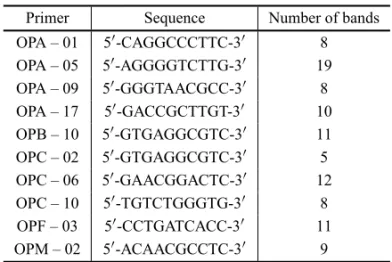
The ten used primers generated 101 loci, characterizing a high level of polymorphism in theC. lacinia saundersii
Fig. 1 – Intra specific variation OPA-05 obtained by genomic DNA amplification ofChlosyne lacinia saundersiifrom Santa Maria, RS and Uberaba, MG. As molecular marker the fago Lambda DNA, digested with theEcoRI,HindIII, andBamHI endonucleases, was used.
from 180 to 2.564 pb. No monomorphic loci were served among the studied populations despite being ob-served within each population (Table II).
TABLE II
Number of RAPD loci forChlosyne lacinia saundersii.
Primer Sequence Number of bands OPA – 01 5′-CAGGCCCTTC-3′ 8 OPA – 05 5′-AGGGGTCTTG-3′ 19 OPA – 09 5′-GGGTAACGCC-3′ 8 OPA – 17 5′-GACCGCTTGT-3′ 10 OPB – 10 5′-GTGAGGCGTC-3′ 11 OPC – 02 5′-GTGAGGCGTC-3′ 5 OPC – 06 5′-GAACGGACTC-3′ 12 OPC – 10 5′-TGTCTGGGTG-3′ 8 OPF – 03 5′-CCTGATCACC-3′ 11 OPM – 02 5′-ACAACGCCTC-3′ 9
The polymorphism among the populations ranged from 31% to 67%, with the ones with the greater num-ber of polymorphic loci (57% e 67%) being from Ube-raba and Vilhena, respectively. However the smaller polymorphism was detected for the population from Brasília (31%), followed by the one from Ribeirão Preto (35%) (Table III).
The largest proportion of individuals from Barrei-ras, Brasília, Ribeirão Preto, Dourados, Londrina, and Santa Maria formed six main groups according to their geographical location (Fig. 2). However, those from Uberaba and Vilhena presented similarities with indi-viduals from other locations. The insects with the low-est similarity coefficient index were from the popula-tions of Ribeirão Preto and Barreiras, while those with
the highest similarity were collected in the region of Londrina (Fig. 2).
The populations with a close similarity among them were those from Londrina, Dourados and Santa Maria, which presented Dice coefficients ranging from 0.765 to 0.775 (Fig. 2). The most divergent population was the one from Vilhena, RO, with a Dice coefficient of 0.695. This population presented the highest value of polymorphic loci differently from the Brasília and Ribeirão Preto populations, which were the least poly-morphic ones (Table III).
TABLE III
Number of polymorphic bands produced by the primers used for the caracterization of
Chlosyne lacinia saundersiipopulations.
Origin of the Number of population polymorphic loci (%) Barreiras 42 (41)
Brasília 31 (30)
Dourados 48 (47)
Londrina 40 (39)
Ribeirão Preto 35 (34) Santa Maria 46 (45)
Uberaba 58 (57)
Vilhena 68 (67)
The bootstrap analysis was consistent with the Dice UPGMA dendogram for the clusters (Fig. 2). The AMOVA results presented a fixation index8st of 0.34
indicating that 33.64% of the genetic variation ocurred among populations, and 66.36% occurred within them (P<0.001) (Table IV).
DISCUSSION
Populations from Londrina, Dourados and Santa Maria were genetically close (Dice coef. = 0.76) compared to populations from Vilhena, Uberaba, Barreiras and Ri-beirão Preto. The highest genetic dissimilarity (Dice coef. = 0.71–0.74) was observed between populations from Vilhena and Uberaba. The most heterogeneous population was from Vilhena, as samples from this population are found interspersed among populations from other localities.
The gene flow indexes (Nm) ranged from 0.9 be-tween the populations of Londrina and Ribeirão Pre-to, up to 6.7 between the populations of Vilhena and Uberaba (Table V). The gene flow index considering all the C. lacinia saundersii studied populations was 1.1, which is relatively low when compared, for instance, to populations of Anticarsia gemmatalis (Lepidoptera: Noctuidae), with a gene flow of 3.05 (Sosa-Gómez 2004). According to this author, the great flying capac-ity of this species would help to explain the high sim-ilarity among populations, since the geographical dis-tances among them were large. Conversely, the similar-ity among populations ofC. lacinia saundersiiis lower
and, consequently, there are lower interchange of ge-netic characteristics among them probably because the sunflower cultivated area is still small and patchy, which hampers the gene flow among populations.
The area cultivated with sunflower in Brazil is cur-rently of 94.000 hectares, while soybean is grown over 21 million hectares (CONAB 2008). The continuity of soybean areas could be favoring a greater migration and, thus, a larger gene flow index of the velvetbean caterpillar (A. gemmatalis) in relation to the sunflower
caterpillar due to the relative discontinuity of sunflower cultivated areas in the country. On the other hand, the sunflower caterpillar also feeds on alternative host plants, mainly of Asteraceae (Moscardi 1983, Campos-Farinha et al. 1997, Moscardi et al. 2005). However,
there have been no studies related to the association of genotypes of C. lacinia saundersii with these natural
plant hosts. On the other hand, there are known studies with the fall armyworm,Spodoptera frugiperda
(Lepi-doptera: Noctuidae), which confirmed a greater gen-etic similarity among populations obtained from a same plant host (McMichael and Pashley 1999, Busato et al. 2004). It suggests that the host plant represents an im-portant factor in the natural selection process. There-fore, more detailed studies on geographical barriers, distribution, and abundance of these hosts can help to clarify the impact of host plants onC. lacinia saundersii
genic flow.
Busato et al. (2004) evaluated the genetic diver-sity ofS. frugiperdausing AFLP markers and observed
that studied populations were not different as there were overlapping of individuals from distinct populations in rice and/or corn. Almost nothing is known about the mi-gration behavior of the sunflower caterpillar. Therefore, the origin and frequency of possible migrations are not known for this insect when occurring in sunflower and wild host plants in Brazil.C. lacinia saundersiioccurs in diverse regions where sunflower is present in this coun-try. Thus, it is possible that this species is well adapted to the different conditions of climate and topography.
Through the AMOVA, 34.64% of the total gen-etic variability could be attributed to differences among populations ofC. lacinia saundersii, and 66.3% to
dif-ferences within populations, which is an indicative that the studied populations were structured. Similar val-ues were obtained withSternechus subsignatus
(Coleop-tera: Curculionidae) that presented difference, among populations of 29% (Sosa-Gómez et al. 2008). ForA. gemmatalisandS. frugiperdathe variation among popu-lations were of 14% and 18%, respectively (Sosa-Gómez 2004, Martinelli et al. 2006). These lower values may be related to the high gene flow in populations of these lepidopterous species.
The RAPD markers used in the present study were efficient for the genetic diferentiation ofC. lacinia saun-dersiipopulations. This type of work is the only one
Fig. 3 – Map with the geographical distances among the populations ofChlosyne lacinia saundersii. Was based on the coordinates of each collection site and expressed in kilometers through the software GPS TrackMakerr13.4 (http://www.gpstm.com/).
TABLE IV
Analysis of molecular variance (AMOVA) for eight geographical populations ofChlosyne lacinia saundersii.
Source of variation g.l. Sum of Components Percent of Probability Fixation squares of variance variation index8st Among populations 7 739.452 3.66 (Va)* 33.64 P<0.001 0.34 Within populations 207 1.495.888 7.23 (Vb)* 66.36 P<0.001 –
Total 214 2.235.340 10.89 – – –
TABLE V
Paired comparisons among populations ofChlosyne lacinia saundersii
through the Nei coefficient for the gene flow (N m) estimate.
Values of
Vilhena Uberaba Brasília Ribeirão Santa Londrina Dourados Barreiras
Nm Preto Maria
Vilhena xxxxxx 6.7 2.3 2.1 2.7 2.1 3.2 2.0
Uberaba xxxxxx 2.5 2.2 2.9 2.0 2.8 2.1
Brasília xxxxxx 1.0 1.7 1.2 1.7 1.5
Ribeirão Preto xxxxxx 1.2 0.9 1.3 1.6
Santa Maria xxxxxx 1.8 3.5 1.6
Londrina xxxxxxx 1.9 1.1
Dourados xxxxxx 1.8
Barreiras xxxxxx
ACKNOWLEDGMENTS
The authors thank Dr. Vanoli Fronza for revising the manuscript, Dr. Eliseu Binneck for the statistical sup-port, Silvana R. Rockenbach for the technical assistance; for insect collections, the following researchers: Débora Pires de Paula (Embrapa Recursos Genéticos e Biotec-nologia), Mônica C. Pires and Pedro V. Lima (Fundação Bahia), Marino Alves (UNESP de Ribeirão Preto), Mar-ley Utumi (Embrapa Rondonia), Talita M. Alexandre and Jovenil J. da Silva (Embrapa Soja), Rejane C.R.K Roggia (UFSM), and Neylson Eustáquio Arantes (Em-brapa Soja/Epamig – Uberaba); Adair V. Carneiro and Danilo Estevão for the support with the pictures and figures. This work was supported by Embrapa Soja and Coordenação de Aperfeiçoamento de Pessoal de Nível Superior (Capes) and was approved for publication by the Publications Committee of Embrapa Soja with num-ber 01/2009.
RESUMO
Chlosyne lacinia saundersiié uma das mais importantes pra-gas da cultura do girassol e o principal alvo das aplicações de inseticidas. As larvas foram coletadas em Londrina (PR), Santa Maria (RS), Dourados (MS), Ribeirão Preto (SP), Bra-sília (DF), Barreiras (BA), Uberaba (MG) e Vilhena (RO). O DNA genômico foi extraído e amplificado com dez primers, que produziram 101 locos. O tamanho das amplificações de RAPD variou de 180 a 2564 pb. O polimorfismo entre as populações variou de 31% a 67%, com maior polimorfismo 57% e 67%, detectado em populações de Uberaba e Vilhena,
respectivamente. As populações com maior similaridade de-terminada com o coeficiente de Dice foram de Ribeirão Preto e Barreiras, enquanto os insetos coletados em Londrina apre-sentaram maior similaridade entre eles. O fluxo gênico deC. lacinia saundersiide 1,1 foi menor que o observado para a
Anticarsia gemmatalisHübner Noctuidae, sugerindo que as populações deC. lacinia saundersiiestão mais isoladas do que estes noctuideos. Através da análise de variância molecular (AMOVA), RAPD a variação foi de 33,64% entre as popula-ções geográficas e 66,36% dentro das populapopula-ções. Estes resul-tados sugerem que as populações deC. lacinia saundersiisão geneticamente estruturadas.
Palavras-chave: amova, fluxo gênico, marcador molecular, praga do girassol.
REFERENCES
APPLIEDMATHSBIONUMERICS. 1998. The integral study of biological relationships. Manual, version 1.01, Kor-trijk, Belgium, 154 p.
BOIÇA JR AL, BOLONHEZI AC AND PACCINI NETO J. 1984. Levantamento de insetos pragas e seus inimigos naturais em girassol (Helianthus annuusL.), cultivada em primeira e segunda época, no município de Sevíria-MS. An Soc Entomol Bras 13: 189–196.
BRODYJRANDKERNSE. 2004. Sodium boric acid: a Tris-free, cooler conductive medium for DNA eletrophoresis. BioTechniques 36: 214–216.
(J.E. Smith, 1797) (Lepidoptera: Noctuidae) associadas ao milho e arroz no Rio Grande do Sul. Neotrop Entomol 33: 709–716.
CAMPOS-FARINHA AEC, PINTO NPOANDGOVONE JS. 1997. Estudo do comportamento e desenvolvimento de lagartas deChlosyne lacinia saundersii, Doubleday and Hewitson (1849) (Lepidoptera: Nymphalidae), no ataque a uma planta de girassol (Helianthus annuusL.). Arq Inst Biol 64: 143–147.
CARVALHOAORANDVIEIRA LGE. 2001. Determinação das condições ótimas para análises de PCR-RAPD em Atta sexdens rubropilosaForel (Hymenoptera: Formici-dae). Neotrop Entolmol 30: 593–600.
COMPANHIANACIONAL DE ABASTECIMENTO, CONAB. 2008. Acompanhamento da safra de girassol 2007/2008. Disponível em<http://www.conab.gov.br/conabweb/ download/moc/titulos/T51s2007-2008.pdf>.
DEVRIESPJ. 1987. The butterflies of Costa Rica and their natural history Papilionidae, Pieridae, Nymphalidae. Prin-ceton University Press, 327 p.
DICELR. 1945. Measures of the amount of ecologic associ-ation between species. Ecology 26: 297–302.
EDWARDS WH. 1893. Notes on a polymorphic butterfly, Synchloe lacinia, Geyer (in Hub. Zutr.), with description of its peparatory stages. Can Ent 25: 286–291.
GALLODET AL. 2002. Entomologia Agrícola, Piracicaba, FEALQ, 920 p.
GORODENSKI SA. 1969. The genetics of three polymor-phic larval color forms ofChlosyne lacinia(Lepidoptera, Nymphalidae). Genet Res 14: 332–336.
LAZZAROTO JJ, ROESSING AR AND MELLO HC. 2005. O agronegócio do girassol no mundo e no Brasil. In: GIRASSOL NOBRASIL(Ed), Londrina: Embrapa Soja, p. 15–42.
LOPES-DA-SILVA M, TONET GEL AND VIEIRA LGE. 2004. Characterization and genetic relationships among brazilian biotypes of Schizaphis graminum (Rondani) (Hemiptera: Aphididae) using RAPD markers. Neotrop Entomol 33: 043–049.
LOUGHEED SC, GIBBSHL, PRIORKA ANDWEATHER -HEADPJ. 2000. A comparison of RAPDversus micro-satellite DNA markers in population studies of the Mas-sasauga rattlesnake. J Hered 91: 458–463.
MARANHÃOZC. 1945. Chlosyne lacinia saundersii, praga do girassol. Rev da Agricultura, Piracicaba 20(1-2): 199. MARTINELLIS, BARATA RM, ZUCCHI MI, SILVAFILHO MCANDOMOTOC. 2006. Molecular variability of
Spo-doptera frugiperda(Lepidoptera: Noctuidae) Populations Associated to Maize and Cotton Crops in Brazil. J Econ Entomol 99: 519–526.
MCMICHAELMANDPASHLEYDP. 1999. Differences in amplified fragment-length polymorphisms in fall army-worm (Lepidoptera: Noctuidae) host strains. Ann Ento-mol Soc Am 92: 175–181.
MOSCARDIF. 1983. Plantas Hospedeiras da lagarta do giras-sol,Chlosyne lacinia saundersii, no Estado do Paraná. In: EMPRESABRASILEIRA DEPESQUISAAGROPECUÁRIA. Centro Nacional de Pesquisa de Soja, Londrina, PR. Re-sultados de Pesquisa de Girassol Londrina, p. 25–26. MOSCARDI F, SOSA-GÓMEZ DR ANDCORSO IC. 2005.
Invertebrados associados ao girassol e seu manejo. In: GIRASSOL NO BRASIL(Ed), Londrina: Embrapa Soja, p. 471–500.
NAKANO O, SILVEIRA NETO S AND ZUCCHI RA. 1981. Entomologia Econômica. Piracicaba, Livroceres, 314 p. NECKRW, BUSHLANDDRUMONDBA. 1971. Epistasis,
associated lethals and brood effect on larval colour poly-morphism of the patch butterflyChlosyne laciniaGeyer. Heredity 26: 73–84.
OLIVEIRA CM, FUNGARO MH, CAMARGO LEA AND LOPESJRS. 2002. Análise comparativa da estabilidade deDalbulus maidis(Delong and Wolcott) (Hemiptera: Ci-cadellidae) sobre diferentes métodos de preservação para uso de RAPD-PCR. Neotrop Entomol 31: 225–231. ROGERSSOANDBENDICHAJ. 1988. Extraction of DNA
from plant tissues. Plant Mol Biol 6: 1–10.
ROHLFFJ. 2000. Ntsys-Pc Numerical taxonomy and mul-tivariate analysis system version 2.1. Exeter Software, Setauket, NY.
SCHNEIDERS, ROESSLIDANDEXCOFFIERL. 2000. Ar-lequin, version 2.0: A software for population genetic data analysis. Genetics and Biomtry Laboratory, University of Geneva, Switzerland.
SILVAAGA, GONÇALVESCR, GALVÃODM, GONÇALVES AJL, GOMESJ, SILVAMNANDSIMONIL. 1968. Quar-to catálogo dos inseQuar-tos que vivem nas plantas do Brasil; seus parasitos e predadores. Rio de Janeiro, Ministério da Agricultura/laboratório central de patologia vegetal, 622 p.
SOKALRRANDROHHLFFJ. 1962. The comparison of den-dograms by objective methods. Taxon 11: 30–40. SOSAGÓMEZ DR. 2004. Intraspecific variation and
gemmatalisHübner, 1818 (Insecta: Lepidoptera: Noctu-idae). Genet Mol Biol 27: 378–384.
SOSA-GÓMEZDR, CORONELN, BINNECKE, ZUCCHIMI ANDROSADO-NETOG. 2008. RAPD and mitochondrial DNA analysis of the soybean stalk weevil, Sternechus subsignatus(Coleoptera: Curculionidae). Bull Entomol Res 98: 475–481.
UNGAROMRG. 1981. Recomendações técnicas para o cul-tivo do girassol. Correio Agrícola Bayer 2: 314–319.
WILLIAMSJG, KUBELIKAR, LIVAK KJ, RAFALSKI LA ANDTINGEYSV. 1990. DNA polymorphism amplified by arbitrary primers are useful as genetic markers. Nucleic Acids Res 18: 6531–6535.